Abstract
The mathematical model for definition of hole coordinates under satellites in cariage of planetary gear by results of indirect measurements is improved. Algorithm of revealing and elimination of incorrect initial data in automatic or manual mode is developed and implemented.
1. Introduction
Modern heavy-duty planetary gearboxes are complex technical devices. To ensure their best performance, high – tech research is required at the design stage, and high manufacturing accuracy is required at the production stage. Therefore, new mathematical models are currently being developed and existing ones are being improved to study the dynamic characteristics of such mechanisms [1-4]. A separate scientific brunch has emerged, devoted to the study of the influence of deformations caused by the working conditions of the gearbox, and technological errors that occur during manufacture and assembly, on the dynamic characteristics of the gearbox [5, 6].
This paper is devoted to the correction of the geometry of the already manufactured planetary gear carrier based on the results of indirect measurements. The correction is made at the stage of final assembly of satellite nodes.
The mathematical model for a more accurate determination of the complex errors of the satellite nodes, taking into account the finite accuracy of measuring the errors in the manufacture of the planetary gear carrier, has already been considered in details in [7]. A logical continuation of these studies was the development of a more perfect model, which, in contrast to the previously used ones [8-11], takes into account the errors not only of the center-to-center distances of the bores for the satellites in the carrier, but also other geometric parameters of the carrier controlled by the manufacturer. These are the center-to-center distances of the central bores of the carrier for the bearing necks and the bores for the satellites, the crossing of the axes of the bores for the satellites between themselves and relatively to the central axis of the carrier.
2. Statement of the problem and an algorithm of its solution
An increase in the accuracy of determining complex errors in this model is achieved by using additional equations for calculating the coordinates of the centers of the boreholes for satellites in the carrier.
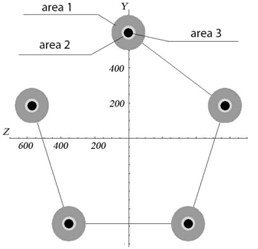
In accordance with the example considered in the paper [7], in the case of a carrier with five satellites (Fig. 1), the resulting system includes 58 equations for 19 sought coordinates, which are the coordinates and for one cheek of the carrier, and and – for the other, where 1÷5 (coordinate 0, since the center of the boring under the axis No. 1 in one of the carrier cheeks lies directly on the axis – see Fig. 2).
Fig. 13-D model of planetary gearbox carrier with five satellites
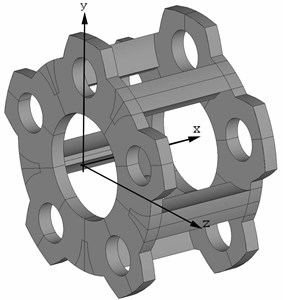
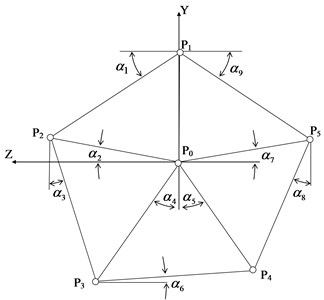
Fig. 2Scheme of the location of the centers of the bores (P) in the plane of the cheek of the carrier YZ and the angular values for the trigonometric relations (α)
This system is not only overdetermined (the number of equations exceeds the number of unknowns) and inconsistent (due to measurement errors), but also deliberately linearized in order to simplify as much as possible. The calculation errors caused by the adopted simplifications can be minimized using an iterative algorithm used in the paper [12].
The first approximate solution of the resulting system of equations is sought using the geometric parameters (Fig. 2), determined under the assumption that the sought coordinates of the boring of the carrier for the satellites form regular pentagons. Then the angular values αi are refined according to the results of the first iteration, and the calculation is repeated. Subsequent approximations are searched in a similar way until the “hit”, calculated at each iteration of the criterion, in the confidence interval determined by the accuracy of the measurements.
The mentioned criterion is the sum of the squares of the residuals (the differences between the left and right sides of the equations of the system when the unknowns calculated at the last iteration are substituted into them), which characterizes the deviations of the initial data (measured accuracy parameters of the carrier) from their calculated estimates made according to the results of each iteration. A stable decrease in this value, noted when solving test examples, indicates a good convergence of the iterative process [12].
Due to the increased requirements for calculation accuracy, the described algorithm is implemented in Stephen Wolfram's «Mathematica» symbolic computation package, which allows calculations to be made with any predetermined accuracy, regardless of the digit capacity of the machine used [13].
The analyzed model has an important property that can significantly improve the accuracy and reliability of the calculations. Because of the essential overdetermination of the system and the nature of the relationship between the indirect measurement results used as input data, all equations associated with any of the choice (but one) of the measurement results can be excluded from the system. In this case, the rank of the matrix of the coefficient system does not become less than the number of unknowns, which leaves the possibility of its approximate solution.
By substituting the solution of the “truncated” system by the above method into the equations excluded from it, and solving them with respect to the excluded parameter (measurement), its expected value may be obtained. The deviation of this value from the measured value can serve as an excellent criterion for the reliability of this parameter.
If there is not more than one coarse error in the initial data (these are 30 measurement results), the process of diagnosis and exclusion of such an error is easily automated, and the task is reduced to the excluding each of the measurement results from the initial data one by one with the calculation of its expected value.
If the deviation of any of the measurement results from its expected value is greater than some predetermined value (e.g., the same measurement accuracy), then such a measurement should be considered erroneous, and the solution obtained without regard to this measurement should be chosen as the best approximation.
If the deviations in all the measurements do not exceed a given value, then the best solution is the one obtained with the full system.
3. Test calculations
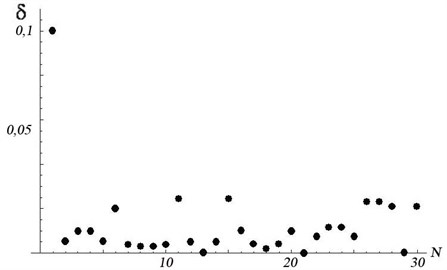
Fig. 3 shows the standard (root-mean-square) deviations of the excluded measurement results from their expected values, calculated according to the formula:
where is the number of the excluded dimension, , , are the coefficients of the system made from the equations excluded from the model, , – dimensionality (rate) of the matrix [].
Fig. 3Root-mean-square deviations of measurement results from their expected values: abscissa axis – serial number of the excluded measurement, ordinates axis – deviation value (mm)
The right parts of these equations contain the value of the excluded dimension, and the vector {} is the solution of the “truncated” system of equations, i.e., the calculated coordinates of the bore centers.
Fig. 3 shows that , the deviation of the first parameter from its expected value, calculated by the above methodology, is maximum. This is quite consistent with the test set of initial data, where all measurements except the first correspond to a perfectly accurate construction, and parameter No. 1 (this is the result of measurement, see Fig. 2) differs by 0.1 mm from its perfectly accurate value (600 mm). The presence of insignificant deviations of the other parameters can be explained by the influence of the first parameter, which was present in the equations when determining these deviations.
An additional criterion for “suspiciousness” of any of the measurement results can be a significant decrease in the value of the sum of squares of deviations by the right-hand sides of the model equations (value of the minimizing function) when excluding from it the equations corresponding to this parameter.
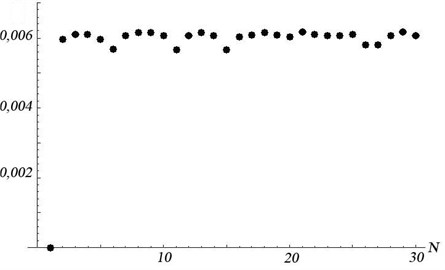
Fig. 4, for example, shows the values of the minimizing function (mm2) obtained during the test solution. When the parameter 1 is excluded from the calculations, a sharp, almost up to zero, decrease in the discrepancy indicates a faulty measurement . Thus, the program successfully diagnoses a gross measurement error of the first parameter.
Fig. 4Values of the minimizing function (mm2) when excluding the N-th measurement
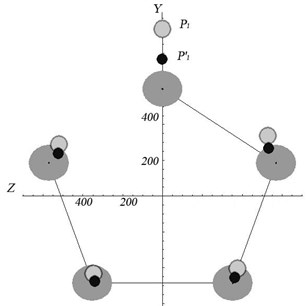
If there is more than one coarse error in the raw data, their diagnosis is not so obvious, especially if the error values are of the same order. Nevertheless, it is possible, but not in automated, but in manual mode, by analyzing the visualized results of the calculations performed.
Fig. 5Visualization of the results of test calculations with erroneous measurement P0P1: area 1 – confidence intervals of the positions of the bore centers for the satellite axes; areas 2 and 3 are the positions of the centers of the bore holes for the axes in the right and left cheeks of the carrier
a)
b)
Fig. 5 shows an example of visualization of the results of test calculations with an erroneous measurement . Fig. 5(a) shows the results of the solution when the measurement is excluded from the model, and Fig. 5(b) shows the results without the exclusion. Confidence intervals and bore center deviations are displayed with the appropriate scaling factor (coefficient).
4. Conclusions
The practical value of the work is as follows.
The methodology presented in this paper allows to correct manufacturing errors and improve the assembly accuracy of heavy-duty planetary gearboxes.
The novelty of the work is as follows.
The developed and soft-implemented implemented method for determining the coordinates of the bores under the axes in the carrier allows to take into account all the precision characteristics of the driver controlled by the manufacturer. In this case, a redefined system of equations is solved with automatic rejection of incorrect measurement results, which increases the reliability of determining the desired complex errors of satellite nodes.
References
-
Cho Jin Rae, Jeong Ki Yong Dynamic Response Analysis of 2.5MW Wind Turbine Gearbox with Flexible Pins Journal of the Computational Structural Engineering Institute of Korea, Vol. 29, Issue 1, 2016, p. 37-44, https://doi.org/1010.7734/coseik.2016.29.1.37
-
He Z. X., Chang L. H., Liu Q. T. Dynamic modeling of planetary gear transmission coupled with gearbox vibrations. International Gear Conference, 2014, p. 330-339, https://doi.org/10.1533/9781782421955.330
-
Karray M., Feki N., Chaari F., Haddar M. Dynamic analysis of high power gear transmission system in bucket wheel excavator. International Gear Conference, 2014, p. 606-614, https://doi.org/10.1533/9781782421955.606
-
Chapron M., Gu X., Velex P., Becquerelle S. A simplified 3D dynamic model of helical and double-helical planetary gears to study the influence of some usual position and geometrical errors. International Gear Conference, 2014, p. 879-888, https://doi.org/10.1533/9781782421955.879
-
Ren F., Qin D. Investigation of the effect of manufacturing errors on dynamic characteristics of herringbone planetary gear trains. International Gear Conference, 2014, p. 230-239, https://doi.org/10.1533/9781782421955.230
-
Ryali Lokaditya, Talbot David A dynamic load distribution model of planetary gear sets. Mechanism and Machine Theory, Vol. 158, 2021, p. 104229, https://doi.org/10.1016/j.mechmachtheory. 2020.104229
-
Nasonov D., Raevsky V., Volkhonskaya A. The procedure for accounting and compensation of errors of planetary gear manufacture and assembly. Vibroengineering Procedia, Vol. 32, 2020, p. 235-239.
-
Ayrapetov E. L., Genkin M. D. Statics of Planetary Mechanisms. Nauka, Moscow, 1976, p. 264.
-
Ayrapetov E. L., Genkin M. D. Dynamics of Planetary Mechanisms. Nauka, Moscow, 1980, p. 256.
-
Leontiev Yu M. Research of Static Loading of Powerful Ship Planetary Gearboxes. Ph.D. Thesis, Moscow, 2001, p. 229.
-
Leontiev Yu M., Polunin I. V., Lysenkov V. S. Analysis of the impact of precision manufacturing of turbo gearboxes on vibration activity. 5th Scientific and Technical Conference View to the future, Saint-Petersburg, 2007, p. 319-328.
-
Leontiev Yu M., Nasonov D. About an algorithm for numerical solution of one of the incorrectly defined problems of practical interest. Proceedings of the V All-Russian Scientific-Practical Conference with International Participation Topical Issues of Modern Science and Education, Vol. 2, 2010, p. 280-287.
-
The System for Current Technical Computations, https://www.wolfram.com/mathematica.
About this article

