Abstract
The stability of mine shafts is crucial for safe production in underground mining. To elucidate the impact of adjacent shaft mining disturbance on shaft structural stability in underground mines, this study takes a Manganese Mine in Guizhou, China as a case study. A refined three-dimensional model at engineering scale was established by using the Rhino-FLAC3D coupled modeling method. This model can numerically simulate the mining of ore bodies at different stages of mining. The displacement, stress distribution, and plastic zone in both strata and shaft surrounding rock were systematically analyzed to reveal the response laws of shaft surrounding rock under mining disturbance. The results showed that during the first and second mining phases, no measurable deformation occurred in the surrounding rock of the main shaft, auxiliary shaft, or ventilation shaft. During the third mining phase, the maximum displacement observed in these shafts’ surrounding rock reached 0.048 m, which remains within the stability threshold of rock masses according to evaluation criteria. Regression analysis was conducted on the monitoring displacement of three mining stages, and power function fitting curves were obtained. Plastic zones (20-30 m range) developed along the periphery of goaf areas, maintaining a safe distance of 45-55 m from adjacent shafts. A stress gradient formed around goaf areas, with tension stresses up to 1.33 MPa exceeding the ultimate tension strength of roof strata. There was potential tension failure in the roof strata of the goaf. Although mining disturbance effects on main and auxiliary shafts intensified with depth progression, no substantial structural impacts were observed. This confirms that all shaft structures can maintain stability during operational phases. The findings provide theoretical guidance for shaft stability control in deep mining operations.
Highlights
- During the third mining phase, the maximum displacement observed in these shafts’ surrounding rock reached 0.048 m, which remains within the stability threshold of rock masses according to evaluation criteria.
- Regression analysis was conducted on the monitoring displacement of three mining stages, and power function fitting curves were obtained.
- Plastic zones (20-30 m range) developed along the periphery of goaf areas, maintaining a safe distance of 45-55 m from adjacent shafts.
- A stress gradient formed around goaf areas, with tension stresses up to 1.33 MPa exceeding the ultimate tension strength of roof strata.
- There was potential tension failure in the roof strata of the goaf. Although mining disturbance effects on main and auxiliary shafts intensified with depth progression, no substantial structural impacts were observed.
1. Introduction
The stability of shaft structures in underground mines is affected by the mining of ore bodies adjacent to the shafts [1-2]. To ensure shaft stability, protective ore bodies near shafts are generally left unmined, inevitably resulting in ore loss [3]. The thickness of protective ore bodies is typically determined through empirical formulas, numerical simulations, and model testing [4-6]. As mining-induced disturbances near shafts are unavoidable, it becomes crucial to reveal the response laws and stability evolution mechanism of surrounding rock in deep mine shafts under adjacent mining activities.
Extensive research has been conducted regarding the impact of underground mining on shaft stability. Zhang et al. [7] analyzed fracturing effect variations in different sections and strata of ZJ2-1 and ZJ2-2 shafts at Zhujidong Mine through fracturing scale, construction curves, and pressure drop data, with verification by microseismic monitoring. The interaction mechanism between drilling, fracturing, and drainage engineering throughout the project cycle was revealed, along with key issues and suggestions for gas control in unmined coal areas. Zheng [8] investigated the influence of excavation on shaft surrounding rock stability at Shaling Gold Mine through mechanical response analysis. Four excavation support schemes were simulated using Flac3D software, leading to the selection of an improved construction technology. Xin [9] established numerical models in ANSYS and FLAC3D to simulate mining in Xiaoguanzhuang Iron Mine’s northern area. Comparative analysis showed that continued use of sublevel caving method at –450m level would endanger main and auxiliary shafts, while backfill mining could effectively reduce surface and shaft deformation. Liu et al. [10] conducted tilt monitoring on an 800m deep vertical shaft in Shandong, analyzing spatiotemporal deformation characteristics and influencing factors. A prediction model was developed using four deep learning methods (RNN, LSTM, GRU, DCNN), with model reliability verified through engineering applications. Xue et al. [11] established numerical models to analyze deformation patterns of inclined shafts under two working face mining conditions, calculating horizontal deformation distributions through probability integral method. Liu et al. [12] constructed 3D models using 3Dmine-Rhion-Griddle-FLAC3D coupling to study shaft deformation, stress, and plastic zones during mining, verifying that surrounding rock remained in primary stress state. Zhang et al. [13] optimized safety pillar parameters through 3D Mine-Rhinoceros-FLAC3D modeling, demonstrating that mining disturbance could be controlled within 10 m range and stability requirements could be met with 79° extraction angle. Scholars have achieved fruitful results in the study of wellbore stability. However, research on the impact of multi process mining of deep ore bodies on wellbore stability has not yet been conducted. Gan et al. [14] has proposed a new method for constructing knowledge graphs (KG) based on ontology to improve the elasticity of underground structures. A comprehensive elastic knowledge system considering 10 categories of underground structures has been established. The system is built on the basis of elasticity quantification analysis, fault tree modeling with insufficient elasticity, and event tree analysis of disaster chain processes. Then, a KG construction system method that integrates top-down and bottom-up strategies was proposed.
The first-phase mining project of Guizhou Manganese Mine has been put into operation, with current extraction activities being conducted for ore bodies above the –170 m level. Underground ore bodies have been divided into eight mining levels: +70 m, +35 m, ±0 m, –35 m, –80 m, –110 m, –140 m, and –170 m. The deep mining engineering design covers ore bodies between –170 m and –555 m, subdivided into eleven levels: –205 m, –240 m, –275 m, –310 m, –345 m, –380 m, –415 m, –450 m, –485 m, –520 m, and –555 m. Among these, –205 m and –240 m levels are designated as the deep second-phase project, while the remaining levels (–275 m to –555 m) constitute the deep third-phase project. In Guizhou Manganese Mine, phased mining operations are implemented. The deep mining area below –170 m level is primarily concentrated between –170 m and –555 m, with a total mining depth exceeding 1,040 m. The substantial mining depth poses potential threats to surface structures and shafts. Furthermore, both main and auxiliary shafts are located in the hanging wall of the ore body.
A Manganese Mine in Guizhou, China was studied through Rhino-FLAC3D coupling modeling to establish a detailed three-dimensional model. Mining simulations at different stages were conducted to obtain displacement, stress distribution, and plastic zone in strata and shaft surrounding rock. The response laws and stability under mining disturbances were revealed. This study establishes a physics-based critical safety distance threshold where plastic zones around goafs cease to propagate toward shafts. This replaces empirical safety pillar design with mechanics-driven spatial benchmarks validated through 3D numerical modeling. We develop a predictive power-law framework that correlates mining progression stages with shaft displacement. The exponent captures accelerated deformation in deep phases, enabling early-warning capability beyond conventional linear extrapolation methods. This research provides theoretical references for shaft safety control in mining engineering.
2. Geological conditions of the mining area
2.1. Terrain and landforms in the mining area
The mining area is located at the northeastern foothills of Fanjing Mountain, the main peak of the Wuling Mountain range, where valleys are well developed. The terrain is deeply incised, being classified as structural denudation and karst erosion landforms. The overall topography of the mining area is characterized by higher elevation in the south and lower in the north. The mining area is roughly bounded by the F2 fault.
In the northern section dominated by karst erosion landforms, the landscape is predominantly characterized by peak clusters, sinkholes, depressions, and structural terraces. Surface runoff is underdeveloped in this region. The southern section exhibits structural denudation landforms with steep terrain slopes. Valleys are well developed in this area, primarily featuring surface runoff.
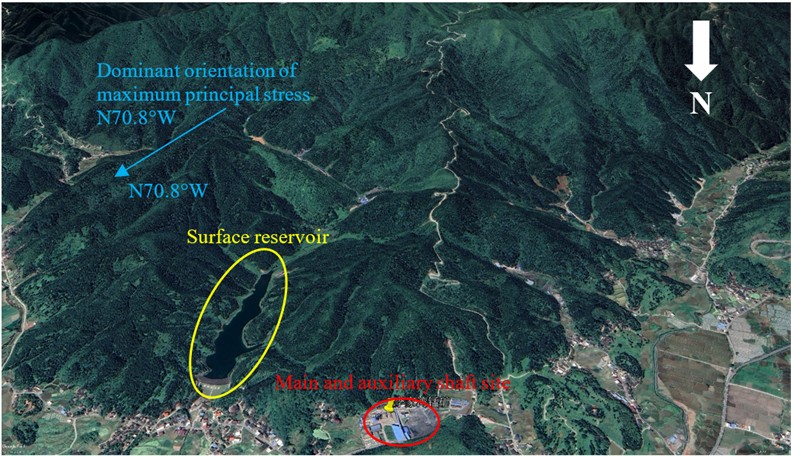
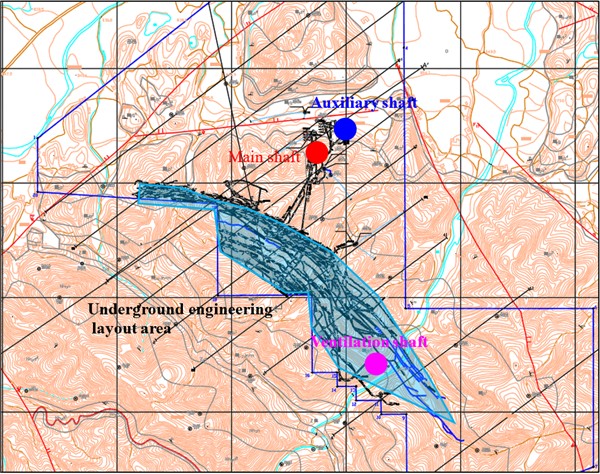
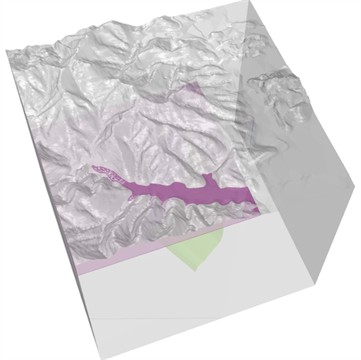
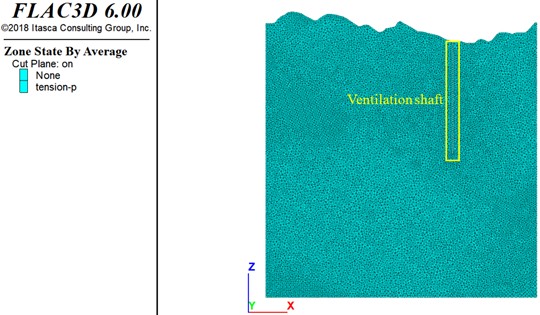
The highest recorded flood level elevation in the region is measured at 861 m. A relative elevation difference of 250 m is observed between the highest and lowest peaks in the mining area. Vegetation development shows regional variations: better forest coverage is found in the southern clastic rock structural denudation area, while poorer vegetation growth is observed in the northern carbonate karst landforms, as shown in Fig. 1. The spatial relationship between the layout of underground mining engineering and the wellbore is shown in Fig. 2. The main and auxiliary shafts are far away from the underground engineering. The ventilation shaft is located within the scope of the project.
Fig. 1Terrain and landforms in the mining area
2.2. Hydrogeological conditions
The region is characterized by a continental climate with distinct seasons. The average annual precipitation is measured at 1,378.3 mm. The rainy season occurs from May to August. Approximately 70 % of the annual rainfall is concentrated during this period. Numerous mountain streams are developed within the area. These streams ultimately converge into a single river, which joins an underground river approximately 200 m from the mining area. Surface runoff is underdeveloped, with groundwater flow dominated by underground rivers.
The Zhailanggou Reservoir was constructed on the eastern side of the mining area, with a maximum capacity of 224×104 m³. Normal water level elevation is maintained at 881.9 m, while designed flood level and checked flood level are set at 883.6 m and 884.18 m respectively. The reservoir base is composed of thick weakly permeable layers. Under natural conditions, the reservoir’s impact on ore deposits is considered minimal. Major faults surrounding the mining area are characterized by weak water conductivity, generally exerting limited influence on manganese deposit water recharge [15].
A thick weakly permeable aquifer is interposed between the mining scope and shallow karst aquifers. Consequently, during deep mining operations, the likelihood of underground workings connecting with overlying karst aquifers is minimized. The hydrogeological complexity of the deposit is classified as simple.
Fig. 2Underground ore body mining and shafts location
2.3. Engineering geological conditions
The engineering geological rock groups within the mining area are classified into six categories: extremely soft rock, soft rock, moderately soft rock, moderately hard rock, hard rock, and loose rock. The lithology of the manganese ore roof surrounding rock is mainly carbonaceous shale, with an RQD value of 70.9. The saturated uniaxial compressive strength is measured as 20.3 MPa. The rock mass quality index M is determined to be 0.52, corresponding to a Class III rock mass classification, indicating medium-quality rock mass.
According to borehole logging records, fresh rock is relatively intact, but severe weathering is observed within 2-3 days after core extraction. Through exploration and verification works, it was found that the mine tunnels and working face roofs are relatively fractured. Consequently, the stability of the direct roof surrounding rock in the ore layer is generally assessed as poor.
Strong surface weathering effects are observed in the manganese ore exploration area with significant depth. The stratum lithology is characterized by relative complexity while geological structures remain relatively simple, dominated by layered formations. Well-developed interlayer structural planes are present, with moderately developed joints and fractures. The overall slope stability is evaluated as poor.
The ore layer roof is categorized as a moderately soft to moderately hard rock engineering geological rock group. The floor is classified as a moderately hard rock engineering geological rock group, exhibiting relatively poor roof stability but better floor stability. In accordance with the “Specifications for Hydrogeological and Engineering Geological Exploration in Mining Areas”, the engineering geological conditions of the mining area are classified as stratified type, with medium-level engineering geological conditions.
2.4. Rock mechanics parameters
Physical and mechanical tests were conducted on five types of rocks in the mine: sandstone, rhodochrosite, carbonaceous shale, silty shale, and dolomite. A series of rock mechanical property tests were completed, including conventional physical parameter testing, uniaxial tensile strength tests, uniaxial compressive strength tests, and triaxial compressive strength tests. Representative mechanical parameters of surrounding rocks and orebody rocks were obtained through these experiments.
Given scale discrepancies between laboratory specimens and in situ rock masses, rock mechanics parameters were converted to engineering-scale values through empirical methods including RQD classification, CSIR and Q-system classifications, GSI classification, and geotechnical code-based approaches [16]. Comprehensive reduction factors were applied to derive underground rock mass parameters. Backfill mechanical parameters were obtained through backfill testing, while fault mechanical parameters were determined via laboratory experiments, as detailed in Table 1.
Table 1Mechanical parameters of mineral rock mass
Rock material | Natural gravity (kN/m3) | Elastic modulus (GPa) | Poisson’s ratio | Tensile strength (MPa) | Cohesion (MPa) | Internal friction angle / (°) |
Sandstone | 27.3 | 0.72 | 0.16 | 1.07 | 1.37 | 31.54 |
Rhodochrosite | 30.7 | 1.68 | 0.19 | 2.12 | 3.51 | 36.21 |
Carbonaceous shale | 27.2 | 1.24 | 0.21 | 1.17 | 2.89 | 29.65 |
Powdery shale | 26.9 | 0.66 | 0.17 | 1.36 | 2.04 | 32.12 |
Dolomite | 27.8 | 1.59 | 0.22 | 1.71 | 2.68 | 31.07 |
Concrete | 25.0 | 12.30 | 0.12 | / | 4.50 | 39.00 |
3. Current situation of mining
3.1. Mining methods
The pseudo-inclined flexible shield support mining method is currently predominantly employed for manganese ore extraction. Based on field application observations, this method has demonstrated good adaptability to the currently mined orebody thickness range of 1.5 m-2.5 m. The floor undulations are relatively minor, while advantages in mining costs and roof safety maintenance have been verified. Comprehensive analysis indicates the successful application of this mining method.
The working face is arranged along the strike direction with advance mining conducted following the strike orientation. Both the upper return airway and lower haulage roadway are driven along the strike of the ore vein. The cutting process is performed through inclined roadways arranged in pseudo-inclined configuration, maintaining pseudo-dip angles of 30-35°.
The operational stope measures 280 m in strike length and 40 m in dip length. The ore layer exhibits dip angles ranging from 35° to 55°, averaging 44°, with thickness varying between 0 m-3.4 m and averaging 2.5 m. Shield supports of 1.5 m-2.5 m type are implemented for ground control.
3.2. Underground mining status
The manganese mine is developed in phased stages. Phase I operations are designed for orebody extraction above the –170 m level, Phase II for orebody extraction between –170 m and –240 m levels, and Phase III for orebody extraction between –240 m and –555 m levels. Four mining levels are currently being actively worked: the –170 m level, –140 m level, –110 m level, and –80 m level.
4. Numerical model and research scheme
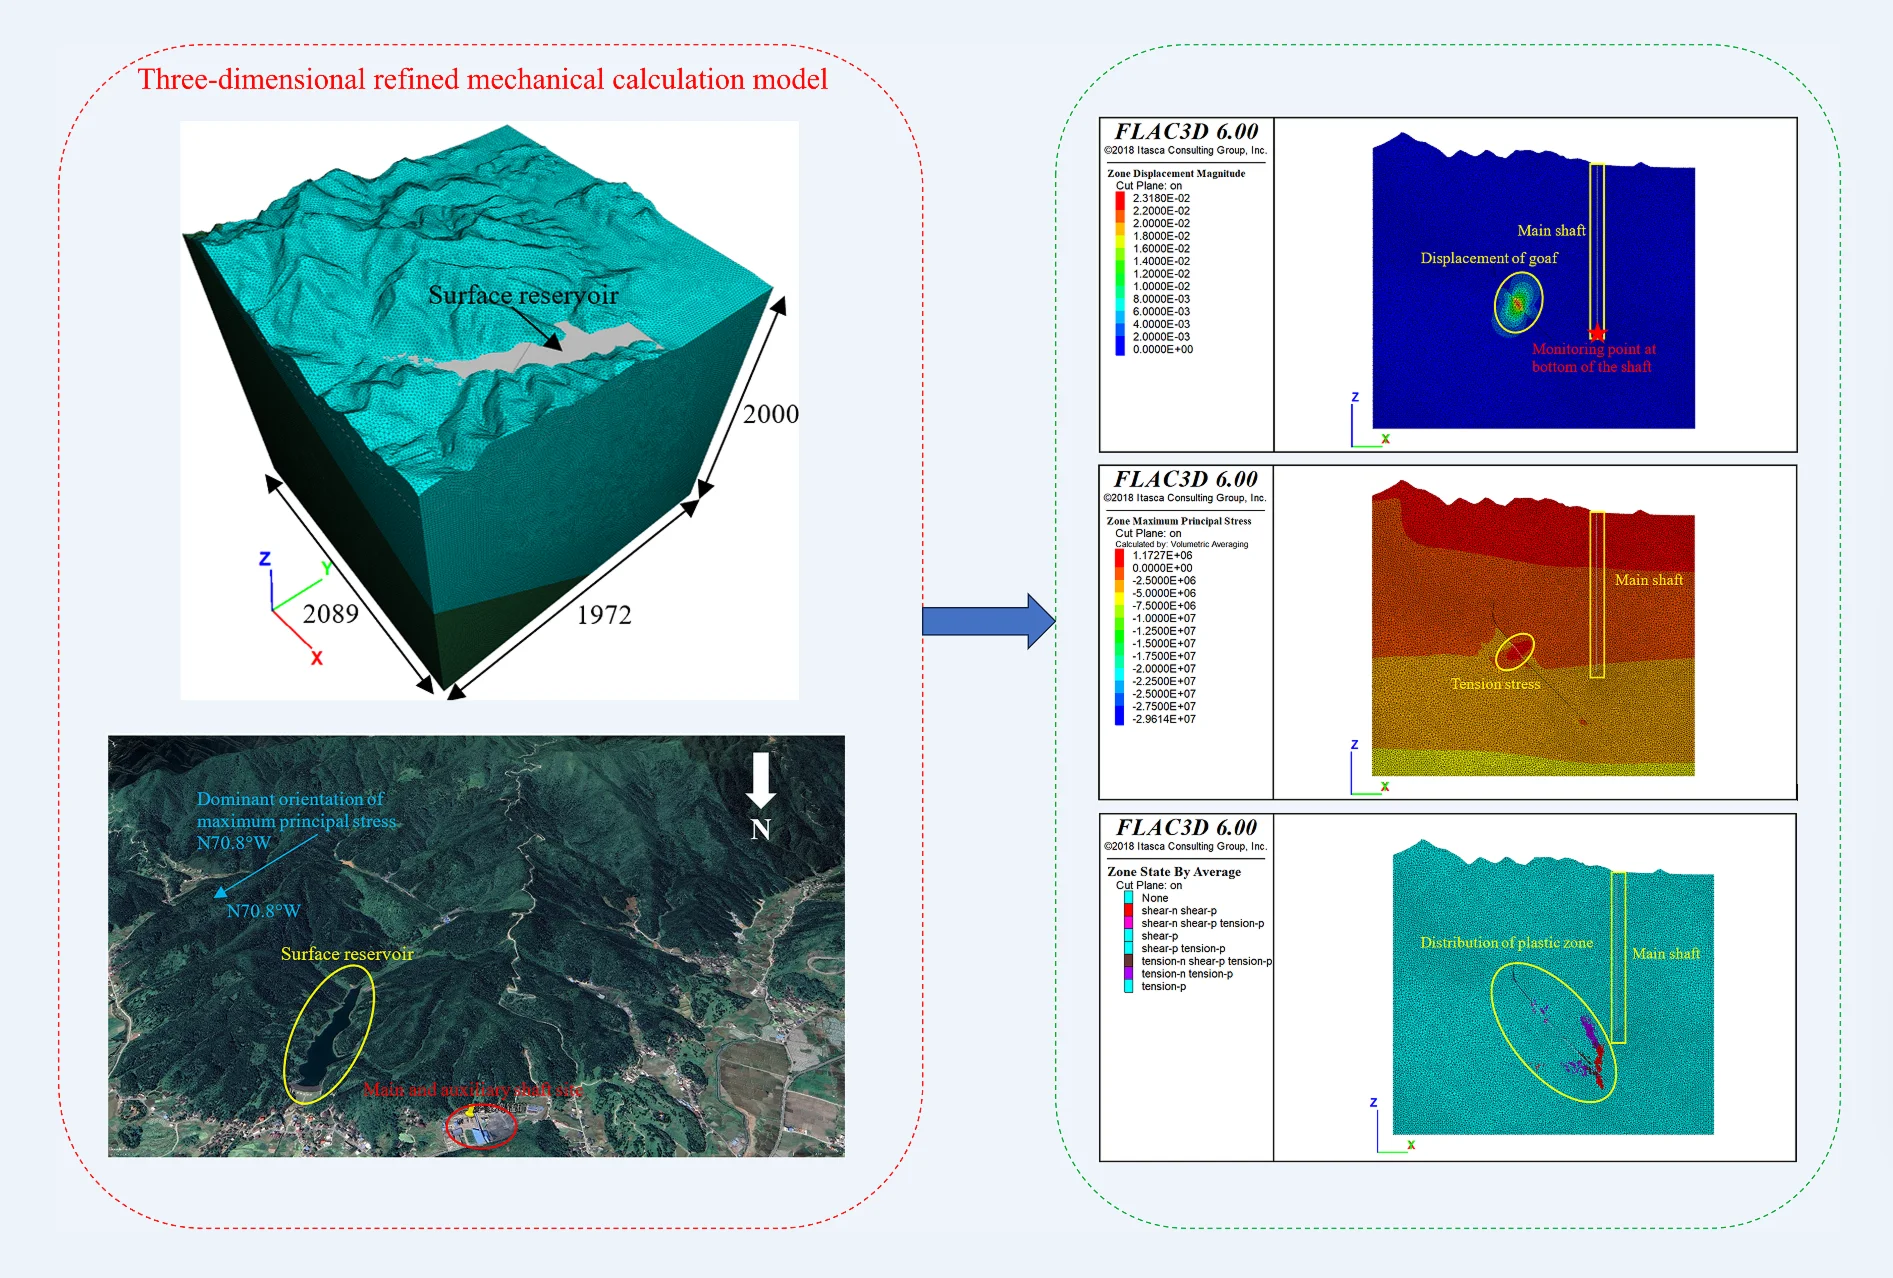
4.1. Rhino-FLAC3D coupling fine modeling
The three-dimensional modeling work for underground orebody mining simulation in this study was accomplished through collaborative application of 3DMINE, Rhino, and AUTOCAD. Technical processing of mine design and existing condition drawings was first conducted using AUTOCAD, where unnecessary lines and surfaces were removed. The processed data is then imported into 3DMINE. The elevation allocation of surface features, strata, ore bodies, and rock mass contours has been achieved. The elevation of some curves has been adjusted.
The modified graphics were then transferred to Rhino for three-dimensional model construction, achieving the transformation from two-dimensional plan drawings to three-dimensional solid models. Finally, the Rhino plugin Griddle was employed to perform meshing of complex geological bodies and engineering structures. The transition from modeling to computational processes was completed.
Through on-site investigation and data collection, a large number of documents were obtained, including mine production design, vertical shaft engineering layout, and current production status diagram. These materials contained substantial information, some of which was not applicable to the modeling process. Technical processing of the collected data was therefore conducted according to research objectives. Mine design and current status drawings were technically processed using AUTOCAD, with unnecessary lines and surfaces removed, ultimately producing diagrams utilizable in Rhino. The processed experimental stope and surrounding rock are illustrated in Fig. 3.
A three-dimensional model incorporating surface topography was created through trimming and extrusion operations using the processed surface topographic map. Then import the processed ore body and stratigraphic map into Rhino software. In Rhino software, conversion, layout, trimming, embedding, and segmentation operations are performed. Finally, a three-dimensional model containing the ore body, multiple rock layers, and faults is formed, as shown in Fig. 4. The model measures 1972 m in length, 2089 m in width, and 1825-2107 m in height.
Fig. 3Contour lines of mining area
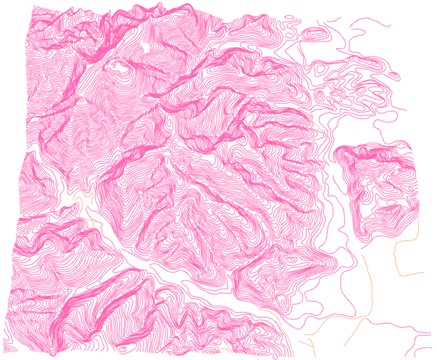
Fig. 4Rhinoceros 3D solid model
The established three-dimensional model was quality-checked using Rhino’s self-inspection module. After meeting the requirements, non-manifold merging, NURBS object processing, and mesh density setting are operated upon. Finally, a three-dimensional mechanical analysis mesh model is formed. Node and element information was exported using Rhino’s data output functionality. The Rhino plugin Griddle was employed to generate *.f3grid files compatible with FLAC3D format using these node and element data files. Finally, the FLAC3D Grid module’s Import command was utilized to incorporate the *.f3grid files, creating a comprehensive analysis model containing orebodies, surrounding rock, and shafts (Fig. 5). The numerical 3D model is a three-dimensional explicit Lagrangian finite-volume program.
Fig. 5FLAC3D calculation model (unit: m)
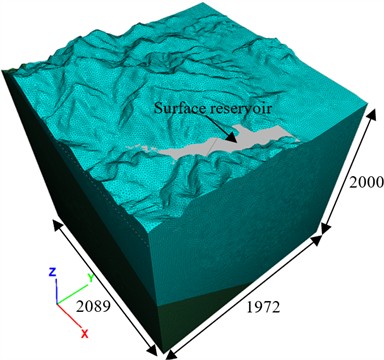
Fig. 6Schematic diagram of Mohr-Coulomb yield criterion
The numerical simulation model represents a block extracted from the global geological structure. To maintain consistency with in-situ conditions, boundary treatments were implemented. Previous studies on boundary condition effects have demonstrated that when model dimensions exceed 3-5 times the target structure (orebody), boundary influences become negligible. Following this principle, the selected model dimensions (: 1972 m, : 2089 m, : 1825-2107 m) satisfy boundary condition requirements, containing 4,609,706 elements and 2,034,524 nodes.
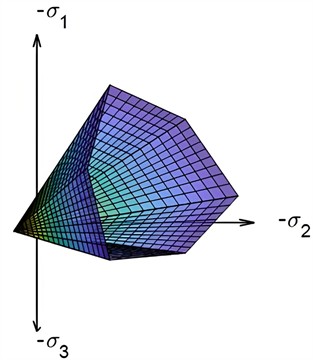
The Mohr-Coulomb constitutive model was adopted for three-dimensional numerical simulation. As illustrated in Fig. 6. The Mohr-Coulomb yield criterion (M-C criterion) considers the maximum shear stress under normal or mean stress, where material yielding occurs when the shear-normal stress ratio reaches critical values. Shear failure initiates when shear stress equals or exceeds material shear strength combined with frictional resistance from normal stress.
Boundary conditions were applied to simulate original media beyond mining influence. The model’s upper surface (ground surface) was set as free boundary, while the base received fixed constraints. Hinge supports were applied along and boundaries, permitting displacement parallel to boundaries while restricting normal-direction movement.
Lateral pressure coefficients were determined as 1.16 and 0.666 at 1000 m depth, and 1.03 and 0.606 at 1400 m depth. Empirical relationships were established: 455/Z+0.705 and 208/Z+0.458. Within the test depth range, principal stress magnitudes followed SH ≥ SV > Sh, indicating horizontal stress dominance in shallow crust with strong contemporary tectonic activity. Measured maximum horizontal principal stresses ranged 27.77-37.68 MPa, minimum horizontal principal stresses 14.07-20.18 MPa, and vertical principal stresses 30.19-38.31 MPa. The dominant orientation of maximum principal stress was approximately N70.8°W. Based on measured data, maximum principal stress was applied along model boundaries according to this predominant orientation.
4.2. Simulated mining scheme
The Phase I manganese mining project has been put into production, with current extraction operations being conducted at levels above –170 m. Eight mining levels are divided: +70 m, +35 m, ±0 m, –35 m, –80 m, –110 m, –140 m, and –170 m. The Phase II project is designed for exploitation of the –205 m and –240 m levels, while Phase III will target levels including –275 m, –310 m, –345 m, –380 m, –415 m, –450 m, –485 m, –520 m, and –555 m.
To simulate orebody extraction in these designed mining levels, three-dimensional mechanical analysis models are established. Level-specific orebody models are constructed, and mining simulation processes for Phases I, II, and III are conducted. The numerical simulation is implemented through the following sequential steps:
(1) The original in-situ stress equilibrium state of the mining area is obtained.
(2) Shaft construction processes are simulated, with the post-excavation equilibrium model being acquired.
(3) Mining processes at different levels are simulated according to the characteristics and extraction sequence of the pseudo-inclined flexible shield support mining method. Phase I operations are focused on orebody extraction above –170 m. Phase II operations are conducted for orebody extraction between –170 m and –240 m. Phase III operations are implemented for orebody extraction between –240 m and –555 m.
4.3. Stability assessment criteria
According to the allowable values for displacement and deformation required by different protection levels specified in relevant regulations [17-18], the criteria for determining the impact of underground mining on surface stability in mining areas are deformation ±2 mm/m, inclination ±3 mm/m, and curvature ±0.2×10⁻³/m.
The criterion for determining the deformation and displacement of underground rock formations based on the analogy of underground mining experience is that displacements below 20 mm have little effect on the stability of the rock mass. A displacement of 20-50 mm can maintain the stability of the rock mass. Displacement on the order of 50-100 mm poses potential stability issues for the rock mass 100 mm belongs to the problem of large deformation displacement, and there is a phenomenon of rock mass failure, which may also occur on a large scale. In addition to using deformation displacement as a criterion, comprehensive judgment is assisted by stress magnitude and plastic zone distribution [19-20]. This numerical simulation used indicators such as maximum unbalanced force, rock stress, surface displacement, and plastic zone distribution to determine mining stability.
5. Analysis of results based on numerical simulation
5.1. Stability of main shaft structure
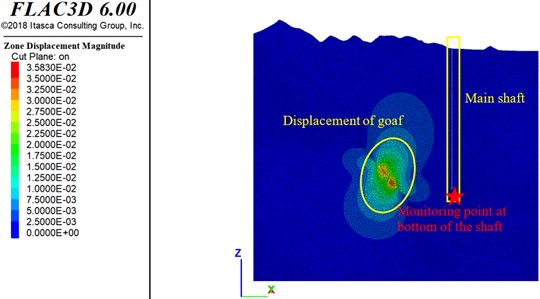
Goafs are formed after orebody extraction. Unloading deformation is generated in overlying rock strata due to stress relief effects. When deformation reaches a certain degree, it is gradually propagated to adjacent shaft surrounding rock. The safety of shaft structures is potentially affected. To investigate deformation characteristics of shaft surrounding rock post-mining, the orebody extraction process was simulated using FLAC3D. Deformation displacement data of shaft surrounding rock were obtained. Displacement contour plots are shown in Fig. 7.
As revealed in Fig. 7, during Phase I mining operations, deformation displacements of the main shaft and surrounding rock mass are observed to approach zero, with no impact detected from underground orebody extraction. This indicates the main shaft is not affected by Phase I mining activities and remains in a safe and stable condition. Following Phase II operations, minimal deformation displacements are measured in the main shaft and surrounding rock mass, showing essentially no influence from underground orebody extraction. The main shaft is demonstrated to maintain stable conditions throughout mining activities. After Phase III operations, a deformation displacement of 0.16 m is generated at the goaf roof. The deformation displacement gradually decreases towards the main shaft direction. The maximum deformation displacement in main shaft surrounding rock is recorded as 0.048 m. According to evaluation criteria, the rock mass is confirmed to retain basic stability.
Fig. 7Displacement in surrounding rock mass of main shaft and goaf (unit:m)
a) Phase I
b) Phase II
c) Phase III
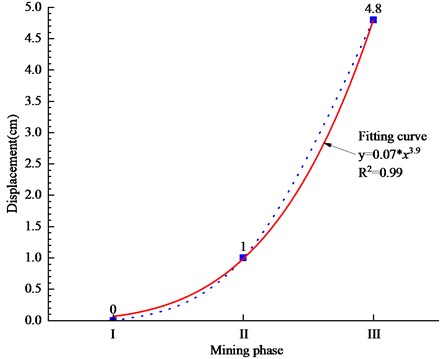
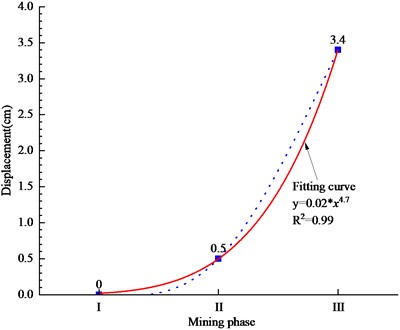
In order to obtain the displacement of the main shaft closest to the ore body under the three stages of mining conditions. Monitoring points were applied to the main shaft model. The displacement of the main shaft has been obtained, as shown in Fig. 8. By conducting regression analysis on the displacement of three mining stages, a power function Eq. (1) fitting curve was obtained. The fitting effect is good, 0.99:
where, is phase, is displacement.
Fig. 8Displacement fitting curve for three mining stages
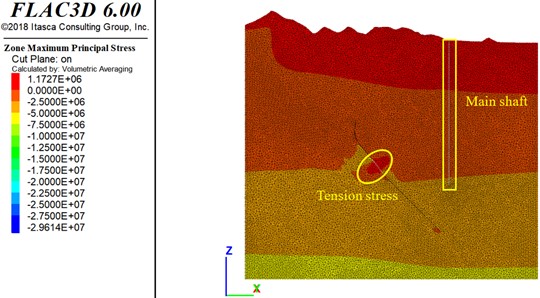
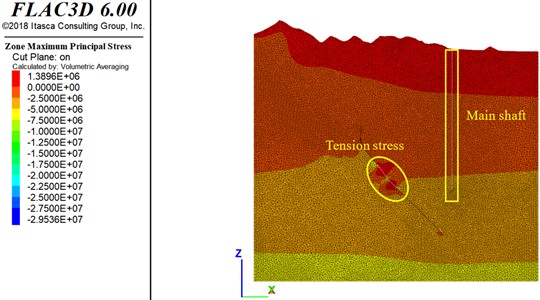
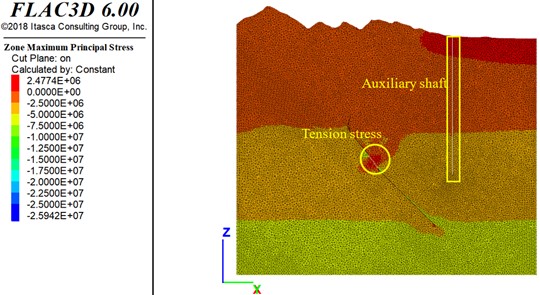
The original in-situ strata stress is fundamentally maintained in equilibrium. When underground orebodies are extracted, local stress fields are disturbed, resulting in stress transfer and concentration phenomena. Stress magnitude and distribution patterns in shaft surrounding rock may be affected. To investigate stress distribution characteristics in shaft surrounding rock post-mining, the orebody extraction process was simulated using FLAC3D. Stress distribution patterns were obtained, as shown in Fig. 9. Tensile stress is defined as positive and compressive stress as negative in the model.
As shown in Fig. 9, after Phase I and II mining operations, stress in the main shaft surrounding rock exhibits regular stratified distribution patterns. Compressive stress increases with depth. No stress concentration is observed in the main shaft structure. This indicates mining disturbances from Phases I and II operations do not directly affect the main shaft structure. The main shaft remains stable. Following Phase III operations, gradual stress transition patterns are formed around the goaf area. Tensile stress develops in overlying strata above the goaf, reaching 1.42 MPa which exceeds the ultimate tensile strength 1.17 MPa. This demonstrates mining disturbances from Phase III operations alter stress distributions in overlying strata. Tensile failure potential exists in the goaf roof. Compressive stress predominantly distributes in shaft surrounding rock. All compressive stresses remain below the ultimate compressive strength of rock mass, indicating limited impacts on the shaft structure.
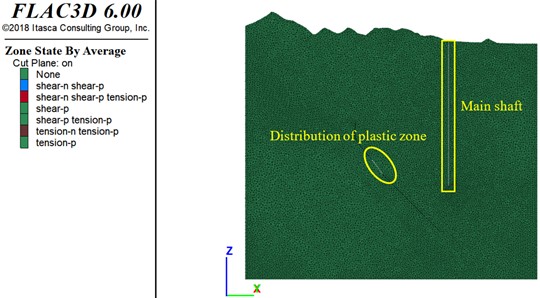
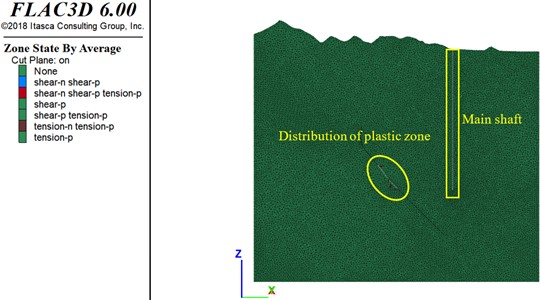
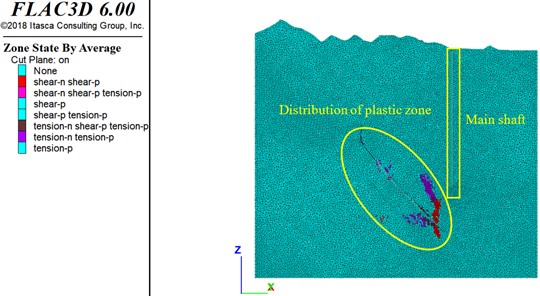
Following the extraction of underground ore bodies, surrounding rock masses are subjected to unloading deformation and shear stresses. When stress exceeds ultimate bearing capacity, plastic deformation is induced. To investigate whether plastic zone distribution in strata extends to shafts after underground mining operations, the ore body extraction process was simulated by using FLAC3D. The plastic zone distribution in shaft surrounding rock was obtained, as shown in Fig. 10.
Fig. 9Stress in surrounding rock mass of main shaft and goaf (unit:Pa)
a) Phase I
b) Phase II
c) Phase III
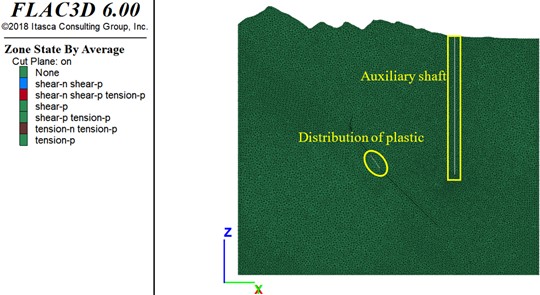
As revealed in Fig. 10, no plastic zones were generated in surrounding rock masses near the main shaft after first and second mining phases. The main shaft structure and adjacent surrounding rock remained unaffected by underground mining activities, with the main shaft structure being maintained in a safe and stable state. Simulation results were found consistent with deformation displacement and stress measurements of the main shaft. After third-phase mining operations, plastic zones of limited scope were generated in surrounding rock masses of goaf areas, primarily distributed along excavation boundaries. However, plastic zone development had not extended to rock masses near the main shaft, indicating minimal impact of ore extraction on main shaft structural integrity.
Fig. 10Distribution of plastic zones in goaf and main shaft surrounding rock
a) Phase I
b) Phase II
c) Phase III
5.2. Stability of auxiliary shaft structure
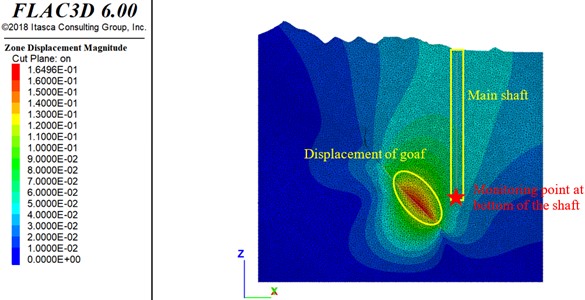
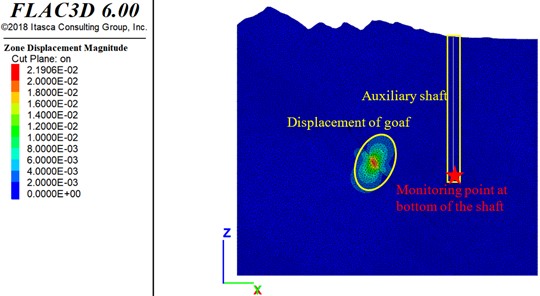
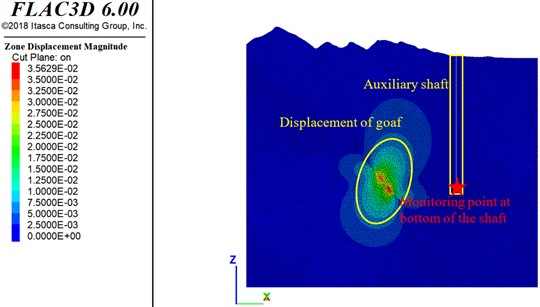
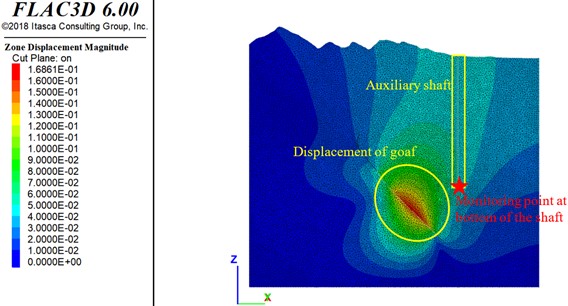
Following ore body extraction, goaf areas are formed. Overlying rock strata undergo unloading deformation due to stress relief. When deformation reaches critical levels, it progressively propagates towards adjacent shaft surrounding rock, potentially compromising shaft structure safety. To investigate deformation characteristics of shaft surrounding rock post-mining, the ore body extraction process was simulated using FLAC3D. Deformation displacement patterns in shaft surrounding rock were obtained, as illustrated in Fig. 11.
Fig. 11Displacement in surrounding rock mass of auxiliary shaft and goaf (unit:m)
a) Phase I
b) Phase II
c) Phase III
As shown in Fig. 11, after first and second-phase mining operations, deformation displacements in auxiliary shaft structures and surrounding rock masses were found approaching zero. No discernible influence from underground mining activities was observed, indicating structural integrity preservation of auxiliary shafts during initial mining phases. Following third-phase extraction, deformation displacements reaching 0.16 m were generated at goaf area roofs. Displacement magnitudes were observed gradually diminishing towards auxiliary shaft directions. Maximum deformation displacement measured in auxiliary shaft surrounding rock was recorded at 0.034 m. According to stability evaluation criteria, rock masses were determined to maintain fundamental stability.
In order to obtain the displacement of the auxiliary shaft closest to the ore body under the three stages of mining conditions. Monitoring points were applied to the auxiliary shaft model. The displacement of the auxiliary shaft has been obtained, as shown in Fig. 12. By conducting regression analysis on the displacement of three mining stages, a power function Eq. (2) fitting curve was obtained. The fitting effect is good, 0.99:
where, is phase, is displacement.
Fig. 12Displacement fitting curve for three mining stages
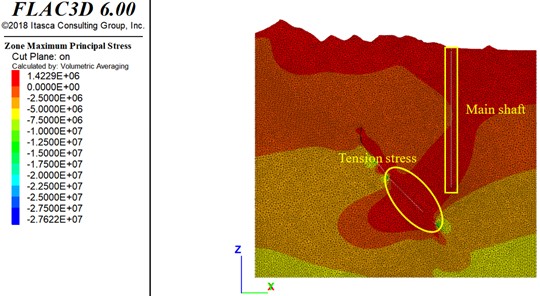
In original geological conditions, in-situ stress within strata is maintained in a balanced state. Following underground ore body extraction, localized stress fields are disturbed, leading to stress redistribution and concentration phenomena. These alterations may affect stress magnitude and distribution patterns in shaft surrounding rock. To investigate stress distribution characteristics in shaft surrounding rock post-mining, the ore body extraction process was numerically simulated using FLAC3D. Stress distribution patterns were obtained, as presented in Fig. 13. In the numerical model, tensile stress is defined as positive while compressive stress as negative.
As revealed in Fig. 13, stress distribution in surrounding rock masses near auxiliary shafts exhibits regular stratified patterns. Compressive stress magnitudes are observed increasing with depth progression. No stress concentration phenomena were detected in auxiliary shaft structures. Stress discontinuity zones were identified at interfaces between goaf areas and ore-rock boundaries.
Mining disturbances from first and second-phase operations showed no direct impact on auxiliary shaft structures, which remained stable. Gradual stress transition patterns were formed around goaf areas. Tensile stress fields were developed in overlying strata of goaf regions, with tensile stress reaching 1.33 MPa. This value exceeds the ultimate tensile strength of roof rock masses, indicating that mining disturbances during advanced deep mining stages influenced stress distribution in overlying strata.
Tensile failure potential was identified in goaf area roofs. Compressive stress predominates in rock masses surrounding shafts, with magnitudes remaining below ultimate compressive strength of rock masses. These findings demonstrate limited impact on shaft structural integrity.
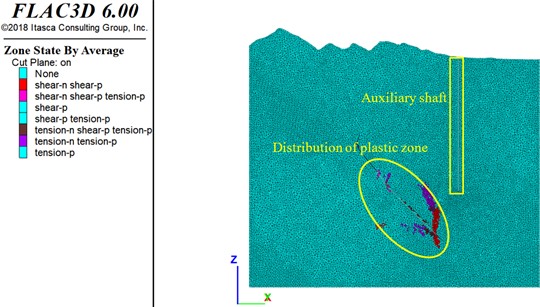
Following underground ore body extraction, surrounding rock masses are subjected to unloading deformation and shear stresses. When stress thresholds are exceeded, plastic deformation is induced. To investigate whether plastic zone distribution in strata extends to shafts post-mining, the ore body extraction process was simulated using FLAC3D, with plastic zone distribution in shaft surrounding rock being obtained, as shown in Fig. 14.
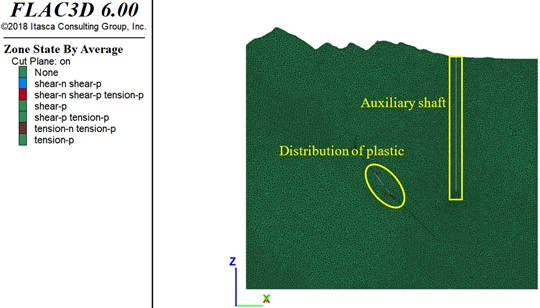
As demonstrated in Fig. 14, no plastic zones were generated in surrounding rock masses adjacent to auxiliary shafts. This indicates that auxiliary shaft structures and surrounding rock remained unaffected by first and second-phase mining operations. The auxiliary shaft structure was maintained in a safe and stable condition. Simulation results were found consistent with deformation displacement and stress measurements.
Fig. 13Stress in surrounding rock mass of auxiliary shaft and goaf (unit:Pa)
a) Phase I
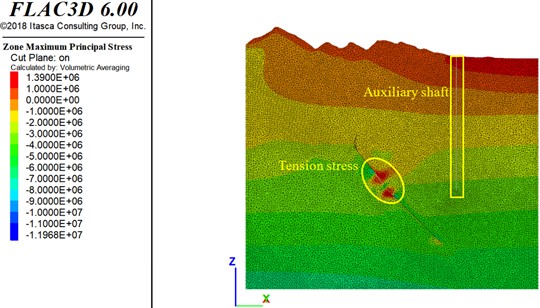
b) Phase II
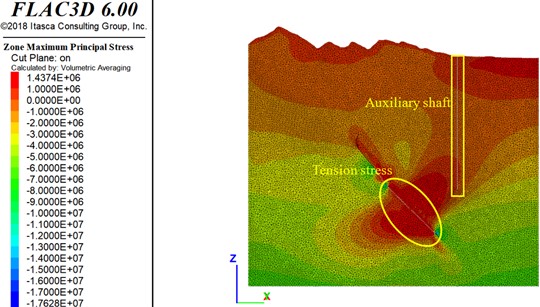
c) Phase III
Following third-phase deep mining operations, plastic zones of limited scope were developed in surrounding rock masses of goaf areas. These plastic zones primarily distributed along excavation boundaries. However, plastic zone propagation had not reached rock masses near the auxiliary shaft, aligning with observations from main shaft simulations. This confirms minimal structural impact of ore extraction on auxiliary shaft, with influence being restricted to rock masses between goaf areas and auxiliary shaft.
Fig. 14Distribution of plastic zones in goaf and auxiliary shaft surrounding rock
a) Phase I
b) Phase II
c) Phase III
5.3. Stability of ventilation shaft structure
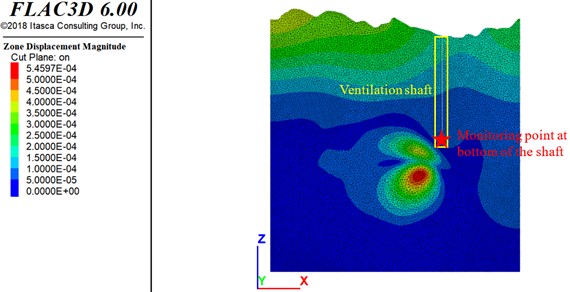
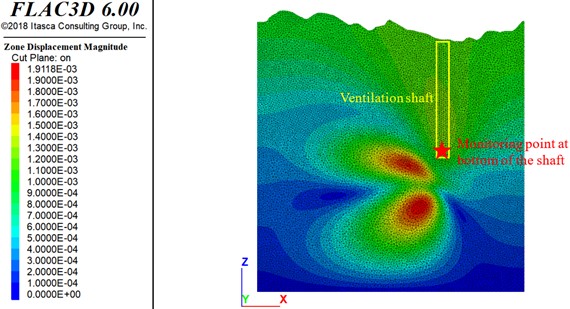
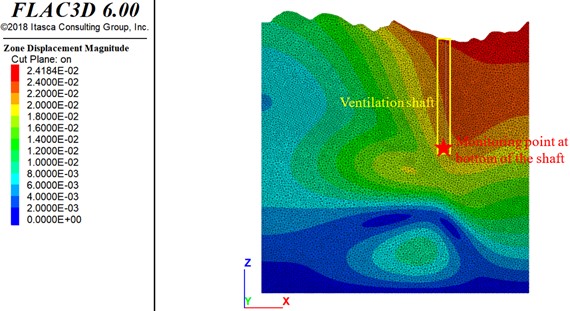
Following ore body extraction, goaf areas are formed. Overlying rock strata undergo unloading deformation due to stress relief. When deformation reaches critical levels, it progressively propagates towards adjacent shaft surrounding rock, potentially compromising shaft structural safety. To investigate deformation characteristics of shaft surrounding rock post-mining, the ore body extraction process was simulated using FLAC3D. Deformation displacement patterns in shaft surrounding rock were obtained, as illustrated in Fig. 15.
As shown in Fig. 15, after first-phase mining operations, deformation displacements in ventilation shaft structures and surrounding rock masses ranged from 0.05 to 0.2 mm. Following second-phase extraction, displacements remained within 0.05-0.2 mm. Such displacement magnitudes were deemed negligible for shaft rock strata, confirming no detectable influence of underground mining activities on ventilation shafts. The structural integrity of ventilation shaft was preserved during initial mining phases, maintaining safe and stable conditions.
Fig. 15Displacement in surrounding rock mass of ventilation shaft and goaf (unit:m)
a) Phase I
b) Phase II
c) Phase III
After third-phase mining operations, deformation displacements of 0.02 m were measured in ventilation shaft surrounding rock. According to stability evaluation criteria, rock masses were determined to maintain fundamental stability.
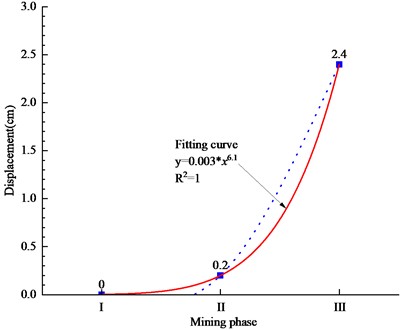
In order to obtain the displacement of the ventilation shaft closest to the ore body under the three stages of mining conditions. Monitoring points were applied to the ventilation shaft model. The displacement of the ventilation shaft has been obtained, as shown in Fig. 16. By conducting regression analysis on the displacement of three mining stages, a power function Eq. (3) fitting curve was obtained. The fitting effect is good, 1:
where, is phase, is displacement.
Fig. 16Displacement fitting curve for three mining stages
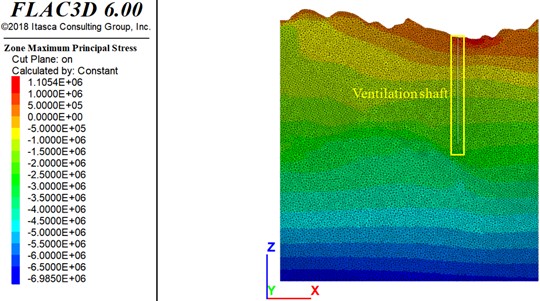
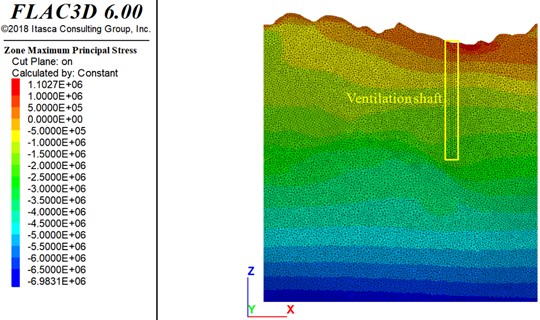
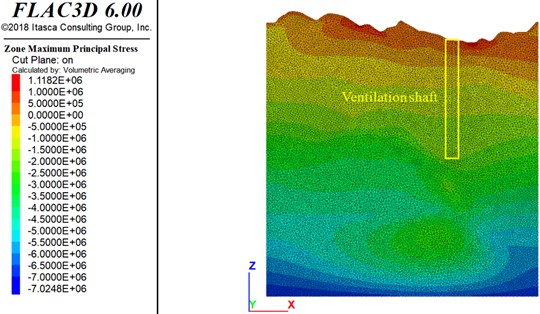
In original geological conditions, in-situ stress within strata is maintained in a balanced state. Following underground ore body extraction, localized stress fields are disturbed, leading to stress redistribution and concentration phenomena. Stress magnitude and distribution patterns in shaft surrounding rock may be affected. To investigate stress distribution characteristics in shaft surrounding rock post-mining, the ore body extraction process was numerically simulated using FLAC3D. Stress distribution patterns were obtained, as presented in Fig. 17. In the numerical model, tensile stress is defined as positive while compressive stress as negative.
As revealed in Fig. 17, after first and second-phase mining operations, stress distribution in surrounding rock masses near ventilation shafts exhibited regular stratified patterns. Compressive stress magnitudes were observed increasing with depth progression. No stress concentration phenomena were detected in ventilation shaft structures. Stress discontinuity zones were identified at interfaces between goaf areas and ore-rock boundaries. Mining-induced disturbances from underground operations showed no direct impact on ventilation shaft structures, which remained stable.
Following third-phase mining operations, stress distribution in rock strata exhibited systematic layered patterns. Compressive stress magnitudes increased with depth progression. Tensile stress fields were developed in upper strata, reaching 1.11 MPa. This value remained below the ultimate tensile strength of rock masses, demonstrating low susceptibility to tensile failure in ventilation shafts.
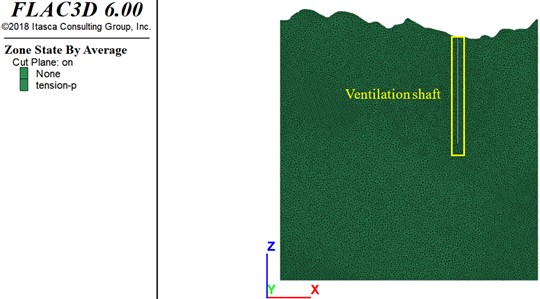
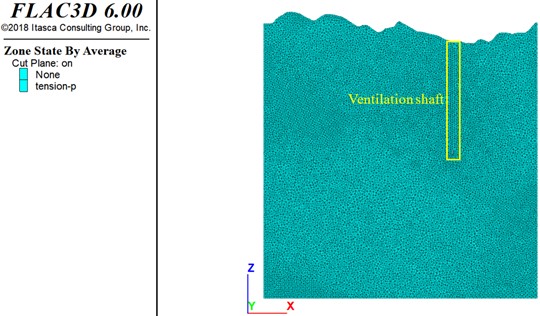
Following underground ore body extraction, surrounding rock masses are subjected to unloading deformation and shear stresses. When stress exceeds ultimate bearing capacity, plastic deformation is induced. To investigate whether plastic zone distribution in strata extends to shafts post-mining, the ore body extraction process was simulated using FLAC3D. Plastic zone distribution in shaft surrounding rock was obtained, as shown in Fig. 18.
As demonstrated in Fig. 18, no plastic zones were generated in surrounding rock masses adjacent to ventilation shafts after first, second, and third-phase mining operations. This indicates that ventilation shaft structures and surrounding rock remained unaffected by underground mining activities. The ventilation shaft structure was maintained in a safe and stable condition. Simulation results were found consistent with deformation displacement and stress measurements.
Fig. 17Stress in surrounding rock mass of ventilation shaft and goaf (unit:Pa)
a) Phase I
b) Phase II
c) Phase III
6. Discussion
The comprehensive numerical simulations conducted in this study provide significant insights into the response mechanisms of shaft surrounding rock under multi-stage mining disturbances in deep manganese operations. Our findings demonstrate that while mining-induced effects intensify with depth progression, critical infrastructure maintains structural integrity when specific spatial and mechanical thresholds are observed.
The consistent 45-55 m separation between plastic zones and shaft structures establishes a physics-based safety distance threshold. This empirically observed buffer aligns with the 79° extraction angle proposed by Zhang et al. (2022) and provides a mechanics-driven alternative to traditional empirical pillar design methods. The absence of stress concentration in shaft linings further confirms the effectiveness of this spatial separation.
Fig. 18Distribution of plastic zones in goaf and ventilation shaft surrounding rock
a) Phase I
b) Phase II
c) Phase III
The high-exponent power-law relationships between mining phase progression and displacement reveal accelerating deformation dynamics in deep mining stages. This nonlinear behavior underscores the limitation of conventional linear extrapolation methods for deep mining impact assessment and provides a predictive framework for deformation early-warning systems. The ventilation shaft exhibited greater displacement sensitivity (0.9-1.2 mm in initial phases) compared to main/auxiliary shafts despite similar safety margins. This differential response likely stems from its location within the project scope and highlights the need for infrastructure-specific monitoring protocols in mining layouts. The tensile stress concentrations (1.33-1.42 MPa) exceeding rock tensile strength in goaf roofs indicate potential progressive failure mechanisms. While not directly threatening shafts, this aligns with studies by Wang et al. (2022) on mining-induced fracture propagation and necessitates separate ground control strategies for production zones.
Our Rhino-FLAC3D coupling approach enabled unprecedented geometric accuracy in modeling complex orebody configurations and shaft interactions, overcoming mesh generation limitations noted in earlier studies (Liu et al., 2021). The phase-based simulation protocol successfully captured the transition from shallow elastic deformation to deep plastic regime response, validating the staged extraction design.
The 20-30 m plastic zones around goafs with 45-55 m safety buffers provide quantifiable design parameters for protective pillar optimization. When combined with our predictive displacement equations, these enable: Dynamic adjustment of extraction sequences based on real-time monitoring data, cost-benefit analysis of ore recovery versus infrastructure protection, risk-based maintenance scheduling for shaft infrastructure.
In conclusion, this study establishes that strategically maintained spatial buffers and phase-aware monitoring can ensure shaft stability even under intensive deep mining. The mechanics-based safety thresholds replace empirical design rules, while the predictive displacement models offer new paradigms for infrastructure risk management in ultra-deep mining operations.
7. Conclusions
A Manganese Mine in Guizhou, China was studied through Rhino-FLAC3D coupling modeling to establish a refined three-dimensional mechanical analysis model at engineering scale. Mining simulations at different stages were conducted to obtain deformation displacements, stress distributions, and plastic zones in strata and shaft surrounding rock. The main conclusions are summarized as follows:
1) Under first and second-phase mining operations, no deformation was generated in main shaft surrounding rock. During third-phase mining, maximum deformation displacement of 0.048 m was measured in main shaft surrounding rock. According to stability evaluation criteria, rock masses were determined to maintain fundamental stability. Plastic zones of limited scope (45-50 m from main shaft) were developed in goaf area surrounding rock, primarily distributed along excavation boundaries.
2) Minimal deformation was induced in auxiliary shaft surrounding rock during first and second-phase mining. Maximum deformation displacement of 0.034 m was recorded in auxiliary shaft surrounding rock under third-phase mining. Stability evaluation confirmed basic rock mass stability. Plastic zones extending 20-30 m from goaf areas were formed, remaining 55 m distant from auxiliary shaft. Regression analysis was conducted on the monitoring displacement of three mining stages, and power function fitting curves were obtained. The fitting effect is good.
3) Ventilation shaft surrounding rock exhibited displacements of 0.9-1.2 mm during initial mining phases. Under third-phase mining, maximum deformation displacement of 0.02 m was observed in ventilation shaft surrounding rock, meeting stability requirements. Plastic deformation had not occurred in ventilation shaft surrounding rock.
4) Gradual stress transition patterns were formed around goaf areas. Tensile stress reaching 1.33 MPa was developed in overlying strata of void zones, demonstrating that mining disturbances during advanced deep mining stages affected stress distribution in overlying strata. Tensile failure susceptibility was identified in void zone roofs.
5) The influence of mining disturbances on main and auxiliary shafts was observed to gradually increase with mining depth progression, yet no substantial impacts were detected. Operational stability of main shaft, auxiliary shaft, and ventilation shaft during mine production phases was confirmed.
References
-
M. Pang et al., “Study on the impact of deep mining on the stability of the surface and vertical shafts of a mine,” China Mining Engineering, Vol. 50, No. 6, pp. 16–20, 2021, https://doi.org/10.19607/j.cnki.cn11-5068/tf.2021.06.004
-
Z. Gu et al., “Numerical analysis of the influence of deep underground mining on shaft stability,” Nonferrous Metals, Vol. 73, No. 5, pp. 14–19, 2021, https://doi.org/10.3969/j.issn.1671-4172.2021.05.003
-
X. Wang et al., “Study on the stability of 14 row return air shaft in No. 1 ore body hanging wall lean ore of Jinchuan No. 2 mining area,” Metal Mine, No. 6, pp. 165–171, 2021, https://doi.org/10.19614/j.cnki.jsks.202106021
-
X. Zhao et al., “Numerical simulation analysis of the influence of deep mining in a certain metal mine on the stability of the shaft,” Mining Technology, Vol. 24, No. 4, pp. 241–246, 2024, https://doi.org/10.3969/j.issn.1671-2900.2024.04.044
-
J. Yue, “Research on the prediction and control of shaft deformation caused by underground mining,” China University of Mining and Technology, 2022.
-
T. Zhang, “Analysis of the seepage characteristics of surrounding rock in deep shaft engineering of metal mines and research on the prediction of water inrush risk,” University of Science and Technology Beijing, 2022.
-
Z. Zhang, K. Yang, and X. Hua, “Interaction mechanism of the full – cycle construction effect of ground horizontal wells in unmined areas of coal mines and development suggestions,” Coal Science and Technology, pp. 1–15, Apr. 2025.
-
J. Zheng, “Study on the stability analysis and support design of surrounding rock in ultra-deep shafts,” Northeastern University, 2021.
-
G. Xin, “Numerical simulation study on the influence of underground mining in the northern area of Xiaoguanzhuang iron mine on surface subsidence and shaft deformation,” Northeastern University, 2014.
-
H. Liu et al., “Exploration and application of deep learning based wellbore deformation forecasting model,” Journal of China Coal Society, Vol. 50, No. 2, pp. 732–747, 2025, https://doi.org/10.13225/j.cnki.jccs.2024.0069
-
Q. Xue, R. Zhang, and G. Xu, “Stability analysis of wellbore with mining of area covered by pedestrian inclined shaft in Jiaozishan coal mine,” Coal Technology, Vol. 43, No. 5, pp. 119–123, 2024, https://doi.org/10.13301/j.cnki.ct.2024.05.023
-
J. Liu et al., “Three-dimensional model construction and shaft stability analysis for filling mining,” Mining and Metallurgical Engineering, Vol. 41, No. 5, pp. 18–21, 2021, https://doi.org/10.3969/j.issn.0253-6099.2021.05.005
-
C. Zhang et al., “Shaft safety pillar delineation and optimization simulation of filling mining method,” Journal of Mining and Safety Engineering, Vol. 39, No. 1, pp. 136–145, 2022, https://doi.org/10.13545/j.cnki.jmse.2021.0044
-
B.-L. Gan, D.-M. Zhang, Z.-K. Huang, F.-Y. Zheng, R. Zhu, and W. Zhang, “Ontology-driven knowledge graph for decision-making in resilience enhancement of underground structures: Framework and application,” Tunnelling and Underground Space Technology, Vol. 163, p. 106739, Sep. 2025, https://doi.org/10.1016/j.tust.2025.106739
-
C. Pany, U. Tripathy, and L. Misra, “Application of artificial neural network and autoregressive model in stream flow forecasting,” Journal of Indian Water Works Association, Vol. 33, No. 1, pp. 61–68, 2001.
-
E. Hoek and E. Brown, “The Hoek-Brown failure criterion and GSI-2018 edition,” Journal of Rock Mechanics and Geotechnical Engineering, Vol. 11, No. 3, pp. 445–463, 2019.
-
“Code for investigation of geotechnical engineering,” GB50021-2001, China Architecture and Building Press, Beijing, 2009.
-
“Code for design of nonferrous metal mining,” GB50771-2012, China Planning Press, Beijing, 2012.
-
X. Wang et al., “Forensic analysis and numerical simulation of a catastrophic landslide of dissolved and fractured rock slope subject to underground mining,” Landslides, Vol. 19, No. 5, pp. 1045–1067, Feb. 2022, https://doi.org/10.1007/s10346-021-01842-y
-
G. Ma, X. Hu, Y. Yin, G. Luo, and Y. Pan, “Failure mechanisms and development of catastrophic rockslides triggered by precipitation and open-pit mining in Emei, Sichuan, China,” Landslides, Vol. 15, No. 7, pp. 1401–1414, May 2018, https://doi.org/10.1007/s10346-018-0981-5
About this article

This work was supported by the Natural Sciences Funding Project of Hunan Province (2024JJ6110, 2024JJ8049), Application Basic Research and Soft Science Research Plan of Yiyang City (2024YR02), and aid program for Science and Technology Innovative Research Team in Higher Educational Institutions of Hunan Province.
The datasets generated during and/or analyzed during the current study are available from the corresponding author on reasonable request.
Wang Feifei wrote the initial draft (including substantive translation). Jiang Anmin and Cui Zhenjun carried out the software analysis.
The authors declare that they have no conflict of interest.
