Abstract
The increasing of forest fires highlights the importance of rapidly and accurately quantifying the burned areas, which is crucial evidence for determining the cause of fire and assigning responsibility. This study develops an operational tool based on the cloud-computing abilities of the PIE-Engine platform and Sentinel-2 satellite imagery. The burned areas are rapidly extracted by applying differential spectral indices such as dNDVI, dNBR and dNBR2 using the adaptive thresholds determined by the Otsu algorithm. Compared with field investigations, the accuracy of using a wildfire case in Liuhe Village, Hubei Province is high. The findings indicate that dNBR can achieve an area accuracy of 98.22 % and a pixel-level F1-score of 0.94, significantly higher than dNDVI. Although the accuracy of the random forest model is slightly high, the dNBR based method achieves an excellent balance between computational efficiency (about 2 s of processing time) and accuracy. In addition, we have developed a user-friendly web application that allows for custom parameter settings and visualizes results as a quantitative burned area map. This tool only requires a web browser, greatly reducing the technical barriers of remote sensing applications and providing a transparent, efficient, and accessible solution for supporting forest fire investigation and emergency response.

Highlights
- A lightweight burned area extraction method combining dNBR and Otsu adaptive thresholding achieves 98.22% area accuracy on the PIE-Engine cloud platform.
- The dNBR index significantly outperforms dNDVI and dNBR2, providing optimal fire scar identification with a pixel-level F1‑score of 0.94.
- A browser‑based tool enables rapid post‑fire assessment within ~2 seconds, requiring no software installation and lowering the barrier for field investigations.
1. Introduction
Forest fires have significant impacts on ecosystems and socio-economic systems [1]. It will cause soil erosion, land cover changes [2], and significant greenhouse gas emissions [3], posing a threat to public safety and property [2]. In 2024, China recorded a total of 295 forest and grassland fires, including 292 forest fires and resulting in 13 fatalities. A survey showed that over 95 % of investigated forest fires were caused by human activities [4]. Intentionally or negligently signing forest fires constitutes a violation of the law. In serious cases, criminal responsibility will be pursued in accordance with the law [5]. Rapid estimation of burned area is crucial for post-fire investigations, and is the key basis for determining fire severity and assigning responsibilities [6, 7].
Traditional burned area assessment methods mainly rely on field surveys and manual digitization. Although they have high accuracy, these approaches are time-consuming, labor-intensive, and unsuitable for long-term repetitive monitoring [8]. Advances in remote sensing have greatly improved the ability to collect and analyze wildfire data through Earth observation, which is essential for fire investigations [9]. Although global burn area products based on remote sensing technology are available, there are still significant limitations [10]. For example, MODIS-derived low-resolution global burned area products such as MCD64A1 have significant omission errors in detecting small-scale fires under 100 hectares [11]. Therefore, to obtain accurate statistics on the fire coverage area, Landsat, Sentinel or higher-resolution images are required [12].
Many remote sensing methods have been proposed for burned area mapping, which are mainly categorized into two groups: bi-temporal spectral index differencing and machine learning classification [11, 13]. Although machine learning and deep learning methods, including architectures such as the hybrid BiLSTM-BiGRU models for efficient sequential data processing in network security [14], and object detectors such as YOLO variants [15-16], have shown high accuracy in complex pattern recognition. Their application to burned area mapping typically requires large amounts of high-quality training data, computationally intensive model development, and substantial hardware resources [17]. In addition, exporting trained classifiers in platforms requires complex programming and adaptation [18]. In contrast, the spectral index methods have high computational efficiency, is easy to implement, and is easy to transfer across platforms, making them particularly effective in rapidly delineating fire perimeters [19-20]. However, the application of the threshold-based spectral index methods is limited due to their sensitivity to vegetation type, phenology, and atmospheric conditions [21-23]. Dynamic thresholding algorithms and machine learning classifiers such as Random Forest have been proposed to improve robustness [24-25]. However, integrating them into user-friendly tools that can be operated by filed investigators remains challenging. Recent cross-domain studies have further demonstrated the versatility of adaptive thresholding and lightweight models in resource-constrained environments [26-28].
The exponential growth of remote sensing data volumes over decades has brought technical challenges to data transmission, storage, and processing, due to the complex spectral and spatial characteristics of these images [29-30]. Ultilizing the potential of remote sensing requires advanced technical skills and, in most cases, proficient programming [31]. Therefore, fire investigators may be unwilling or inadequately to effectively utilize remote sensing datasets [32]. Cloud-based remote sensing platforms (represented by Google Earth Engine (GEE)) equipped with supercomputing capabilities have proven effective for storing, processing, and analyzing massive amounts of remote sensing data [33]. At the same time, cloud platforms in China are developing rapidly. It is worth noting that PIE-Engine, developed by PIESAT Information Technology Co., Ltd., has achieved significant progress [34]. Locally developed platforms such as PIE-Engine provide Chinese-language interfaces, reducing implementation barriers and better meeting the practical needs of grassroots fire investigations [35]. In addition, these platforms may be integrated into smart city frameworks for environmental monitoring and emergency response, in line the with emerging trends of ethical and governance-aware urban sensing systems [36].
Combined multi-temporal Sentinel-2 imagery with adaptive thresholding techniques, a customizable tool based on the PIE-Engine cloud platform is developed for rapid extraction of burned areas. Main contributions are manifested in the following three aspects:
(1) A lightweight extraction framework that combines multiple spectral indices (dNDVI, dNBR, dNBR2) with the Otsu adaptive thresholding method is proposed. This framework can significantly reduce computational and operational barriers while maintaining high accuracy.
(2) An interactive application on the PIE-Engine platform that supports user-defined parameters (such as the study area, time range, and spectral indices) is constructed. This implements a “ready-to-adjust-and-use” feature, facilitating on-site investigation.
(3) The accuracy and efficiency of this tool are validated through a typical wildfire case study. Comparing the results with those from traditional thresholding methods and field surveys, the applicable scope and limitations of this tool are verified.
2. Materialand research method
2.1. Study area and data sources
Liuhe Village lies in the eastern mountainous region of Xugu Town, Xinzhou District, Wuhan (115°02'01"E-115°02'37"E, 30°53'55"N-30°54'13"N). The study area covers an area of 1,200 hectares, including 70.87 hectares of farmland and 516.2 hectares of forested land. This region is characterized by a subtropical monsoon climate with abundant rainfall and high temperatures during the synchronous rainy and hot seasons. The terrain is dominated by low hills and mountains, and the vegetation is mainly composed of highly flammable pine trees and understory grasses. On October 4, 2019, extreme drought and elevated temperatures triggered a forest fire near Liuhe Village, and the fire danger index continued to reach its maximum level (red alert). Field surveys conducted on December 21, 2019 used a GPS data collector (Unistrong MG758) to record the boundaries of burn scars. The integration with satellite imagery during post-processing confirmed that the burned area was 106.25 hectares (Fig. 1).
This study used Sentinel-2 satellite data accessed by the PIE-Engine platform (https://engine.piesat.cn/engine/home). The Sentinel-2 mission, operated by the European Space Agency, used twin satellites (Sentinel-2A and 2B) to achieve a combined 5-day revisit cycle. Each satellite was equipped with a Multispectral Imager (MSI) that can capture13 spectral bands in the visible, near-infrared (NIR), and shortwave infrared (SWIR) regions, with a spatial resolution of up to 10 m. We used the Level-2A Bottom-of-Atmosphere reflectance products (Dataset ID: “S2/L2A”) provided by PIE-Engine.
Fig. 1Location of the study area. Source: National Geomatics Center of China, Tianditu imagery base map [GS(2025)1508], retrieved March 2025, from https://www.tianditu.gov.cn
![Location of the study area. Source: National Geomatics Center of China, Tianditu imagery base map [GS(2025)1508], retrieved March 2025, from https://www.tianditu.gov.cn](https://static-01.extrica.com/articles/25306/25306-img1.jpg)
2.2. Advantages of data preprocessing and platform computation
One of the core advantages of implementing this method on the PIE-Engine platform is the use of its cloud-native parallel computing architecture. Unlike traditional desktop remote sensing software (such as ENVI and ArcGIS) that requires downloading, local storage, and sequential processing of large satellite image datasets (a process often taking minutes to hours), PIE-Engine performs these computations in parallel on its servers. This architecture allows for near-instantaneous access, preprocessing, and analysis of Sentinel-2 imagery directly in the web browser, which is crucial for achieving the fast-processing times. A web-based application was designed to visualize results, featuring automated threshold calculation, manual threshold adjustment, and binary map generation. The workflow is shown in Fig. 2.
Sentinel-2 Level-2A images are provided by PIE-Engine with atmospheric correction. For each image including the study region and period, the cloudMask function is used for cloud removal. False-color synthesis was generated by assigning SWIR (Band 12), NIR (Band 8), and red (Band 4) bands to the RGB channels respectively to improve the visibility of burned scars. All available cloud-free images were fused and clipped to the study area boundary, and resampled to are solution of 10 m. Fig. 3 shows the pre-fire and post-fire false-color synthesis.
Fig. 2Flowchart of the methodology
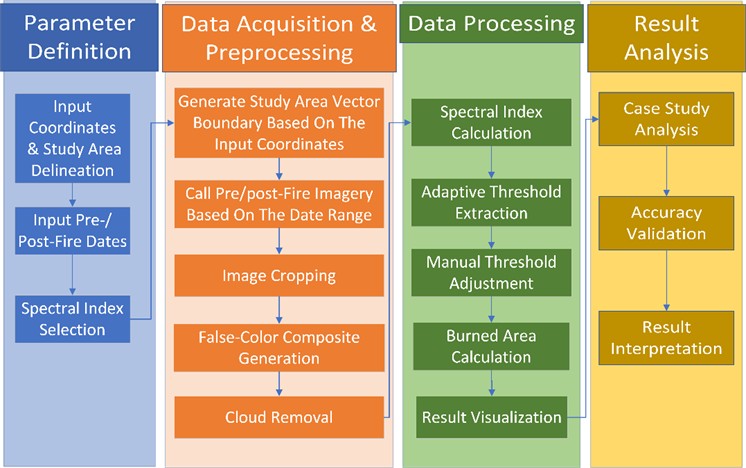
Fig. 3Sentinel-2 false color composite images a) before and b) after the fire
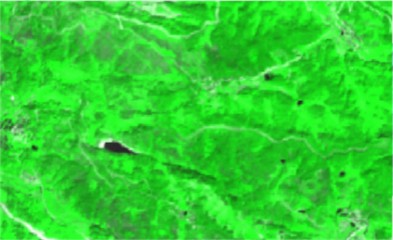
a)
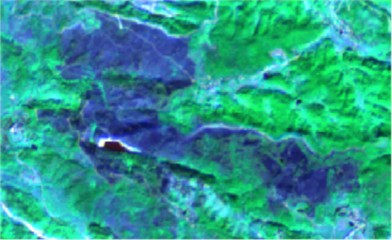
b)
2.3. Spectral index calculation
For the pre- and post-fire image synthesis, three spectral indices are calculated as follows:
1) Normalized Difference Vegetation Index (NDVI) [37]:
2) Normalized Burn Ratio (NBR) [38]:
3) Normalized Burn Ratio 2 (NBR2) [39]:
where , , , and represent the BOA reflectance values of Sentinel-2 Band 4 (Red, 665 nm), Band 8 (NIR, 842 nm), Band 11 (SWIR1, 1610 nm), and Band 12 (SWIR2, 2190 nm), respectively.
The difference indices (dNDVI, dNBR, dNBR2) were calculated by subtracting the pre-fire index value from the post-fire index value for each pixel [40], with an output resolution of 10 m.
2.4. Threshold extraction and area calculation
The Otsu algorithm is used to obtain an adaptive threshold for segmenting burned areas from each difference index image [41]. The algorithm finds the threshold that maximizes the inter-class variance between the foreground (burned) and background (unburned) pixel classes:
where and are the probabilities of the two classes separated by threshold ; and are the mean intensities of the two classes, and is the global mean intensity of the difference image.
Although the Otsu threshold () provides a statistically robust starting point, errors in residual commission (unburned areas classified as burned) or omission (missed burned areas) may occur in heterogeneous landscapes. To address this, this tool includes a manual adjustment interface. Users can fine-tune the final threshold () by applying a constant offset () to : , where can be increased or decreased in steps of 0.05 based on visual inspection of the preliminary binary map and local knowledge. This simple and effective post-Otsu adjustment allows users to account for spectral changes at specific locations. The core adaptive thresholding framework (Otsu + manual calibration) is universal and can be reused to detect other anomalies (such as floods, and deforestation) by replacing the input spectral indices with relevant ones (such as NDWI for water).
The burned area () in hectares is calculated as: , where is account of pixels classified as burning.
2.5. Web-based user interface
The entire workflow runs locally in the PIE-Engine platform. A browser-accessible interface is built with the UI components of the platform: the InputNumber widgets for coordinate and threshold offset (), the DateSelect components for defining pre-fire and post-fire time ranges, the Select dropdowns for selecting the spectral index, and a Button for trigger processing. All widgets are nested in a Panel container for a responsive layout. After execution, the application will display an interactive map with a binary burned area mask and output the calculated area in hectares.
2.6. Accuracy assessment
The main accuracy of the burned area range is evaluated by comparing the remotely sensed estimates () with the ground-surveyed reference area ( = 106.25 ha). The area accuracy (%) was calculated as follows:
To enhance the quantitative evaluation, we have added pixel-level classification metrics from a stratified random sample of points (500). This sample is used to calculate the confusion matrix and obtain the following standard classification indicators:
Accuracy (User Accuracy): Measures the reliability of the classification, that is, the proportion of predicted burned pixels that are actually burned:
Recall (Producer Accuracy): Measures the completeness of the classification, that is, the proportion of actual burned pixels that are correctly identified:
F1-Score: the harmonic mean of accuracy and recall, providing a single balanced metric:
Cohen’s Kappa Coefficient (): Measures the consistency between classification and reference data, exceeding accidental expectations:
where (True Positives) is the number of pixels correctly classified as burned; (False Positives) refers to the number of pixels incorrectly classified as burned (commission error), and (False Negatives) is the number of burned pixels incorrectly classified as unburned (omission error). is the observed agreement (overall accuracy), and is the expected accidental consistency calculated based on the marginal sum of the confusion matrix.
In addition, a comparative experiment was conducted to place the performance of this index-based method in the background. A Random Forest (RF) classifier is implemented on the same PIE-Engine platform using the pre-fire and post-fire reflectance values of bands B2, B3, B4, B8, B11, and B12 as features. The model is trained on a separate set of labeled data from the same event. Its performance (Precision, Recall, F1, Kappa) and computational execution time are compared with the dNBR+Otsu method to highlight the trade-offs between accuracy, complexity, and operational efficiency.
3. Results and analysis
3.1. User interface and processing efficiency
The web application developed on the PIE-Engine platform demonstrated efficient burned area extraction through its intuitive interface and robust processing algorithms. As shown in Fig. 4, there is a parameter configuration panel (Fig. 4(a)) on the left sidebar of the interface. It is used to define the area coordinates, temporal ranges, and processing thresholds. The system automatically selects optimal pre-fire and post-fire Sentinel-2 scenes in the user-specified date range. The calculation results include the adaptive thresholds and area metrics, which are dynamically shown in the lower left panel (Fig. 4(b)). The central mapping area (Fig. 4(c)) visualizes the results, and the layer management module (Fig. 4(d)) allows for flexible switching of layers. This responsive design ensures full functionality in devices without the need to specialized software.
3.2. Automatic burned area identification
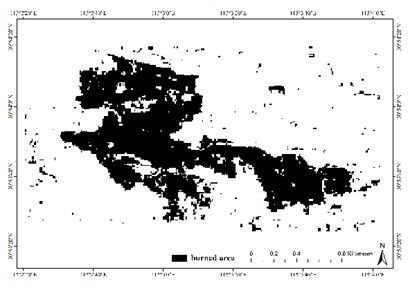
Fig. 5 shows the adaptive-threshold burned area maps generated within about 2 s. There are significant performance differences between the indicators. The dNBR index produces the most spatially coherent results with minimal noise (Fig. 5(b)). The dNDVI output contains a significant amount of noise and omission errors, particularly misclassifying terrain shadows in northwestern regions due to its known sensitivity to illumination variations, atmospheric interference, and solar geometry effects (Fig. 5(a)). The dNBR2 index performs moderately and effectively distinguishes agricultural changes in eastern farmlands (Fig. 5(c)). Common challenges include false alarms caused by human interference near settlements, seasonal errors in agricultural classification, and incorrect delineation of water-vegetation boundaries during hydrological fluctuations. These limitations highlight the complex interactions between spectral signatures and landscape changes in post-fire environments.
Fig. 4User interface and main functions of the application
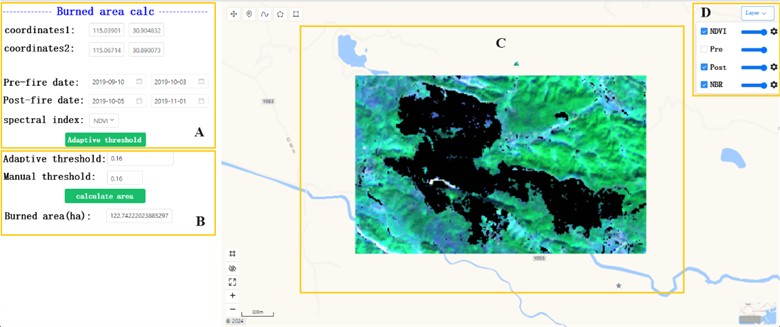
Fig. 5Burned area maps recognized by adaptive threshold of: a) dNDVI; b) dNBR; c) dNBR2
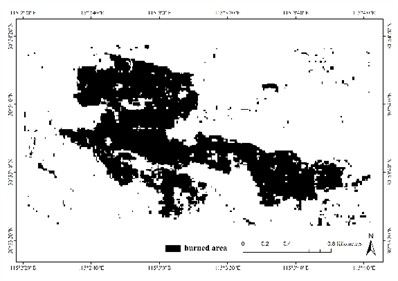
a)
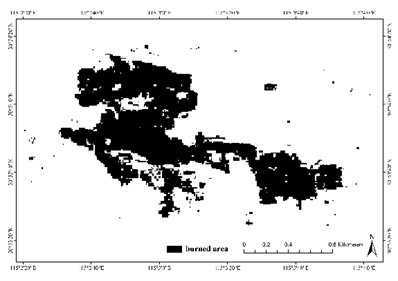
b)
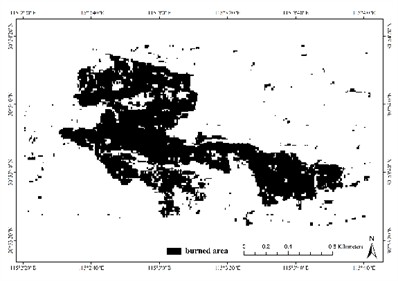
c)
3.3. Quantitative accuracy and comparative evaluation
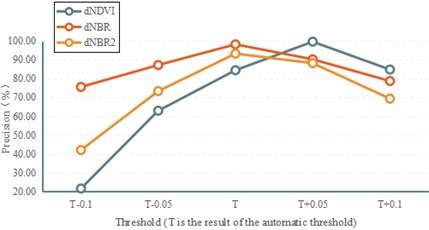
Quantitative assessment confirms the superiority of dNBR. The adaptive thresholding approach using dNBR achieve an area accuracy () of 98.22 % (108.14 ha compared to the ground truth of 106.25 ha) at an optimal threshold of 0.32 (Table 1). The pixel-level classification metrics obtained from 500 validation points provide a more detailed evaluation (Table 1). dNBR achieves the highest F1-score (0.94) and Kappa coefficient (0.92), indicating an excellent balance between precision (0.95) and recall (0.93).Although manually adjusted dNDVI can achieve a high area accuracy (99.64 %), this comes at the cost of a severe damage recall (0.71), leading to significant omission errors and a lower F1-score (0.81). The visual examination of the results (Figs. 6-7) confirms that the dNBR adaptive thresholding approach best balances the accuracy and reliability, effectively minimizing omission and commission errors while maintaining the integrity of burn scar.
Table 1Accuracy assessment of burned area extraction using different spectral indices
Spectral indexes | Area (ha) | (%) | Precision | Recall | F1-Score | Kappa () |
dNDVI | 108.92 | 84.48 | 0.87 | 0.76 | 0.81 | 0.78 |
dNBR | 108.14 | 98.22 | 0.95 | 0.93 | 0.94 | 0.92 |
dNBR2 | 113.36 | 93.31 | 0.91 | 0.94 | 0.92 | 0.89 |
Random forest | 105.89 | 99.66 | 0.97 | 0.96 | 0.96 | 0.95 |
To address the uncertainty of boundary delineation, a 30-meter buffer zone around the reference fire perimeter is analyzed. In this boundary region, the dNBR method maintains a high classification accuracy (Producer accuracy > 90 %), indicating robust performance in distinguishing the gradient between burned and live vegetation, although some inevitable edge pixel mixing. A Random Forest (RF) classifier is implemented on the PIE-Engine for comparison. As shown in Table 1, the RF model achieves a slightly higher pixel-level accuracy (F1 = 0.96, = 0.95) and area accuracy (99.66 %). However, its execution time on the cloud platform is significantly longer (about 45 s for model prediction) than the near-instantaneous processing (about 2 s) of the dNBR+Otsu method. This comparison highlights the trade-off empirically: although advanced machine learning can provides light accuracy gains, this spectral index method achieves an excellent balance between computational efficiency, operational simplicity, and “good-enough” accuracy for rapid responses.
Fig. 6Accuracy evaluation result of burned area after threshold adjustment
3.4. Ethical, social, and practical implications
The deployment of automated remote sensing tools for forest fire analysis is of great importance. First, regarding transparency and algorithmic decision-making, the proposed methodology (Otsu on dNBR) is fully transparent and deterministic. This contrasts with “black-box” deep learning models and is crucial for generating evidence that can be carefully examined and interpreted in policy-making or legal liability assessments. Then environmental and privacy considerations must be balanced. Although satellite monitoring is indispensable for environmental protection and disaster management, its use must be balanced with privacy regulations, especially when capturing private property with high-resolution data. This tool uses medium-resolution Sentinel-2 data (10 m), which can alleviate personal privacy while still being suitable for area-based damage assessment. Finally, ensuring fair access to such technology is a key practical issue. The design of this tool on the cloud-based PIE-Engine platform directly addresses this only using a web browser, thereby eliminating the need for expensive computing hardware or specialized software licenses. This is particularly beneficial for forestry departments or researchers in regions with limited technical infrastructure, reducing the barrier to advanced geospatial analysis.
Fig. 7Burned area map recognized by adjusted threshold (0.21) for dNDVI
4. Conclusions
This study developed and validated an operational tool on the PIE-Engine cloud platform for rapid burned area extraction using Sentinel-2 imagery. The objectives of creating a user-friendly tool using cloud computing to evaluate the performance of key spectral indices and demonstrate a practical solution for fire investigation are achieved. The key findings are as follows:
1) The PIE-Engine-based tool can effectively generate burned area maps and calculate affected areas using medium-resolution Sentinel-2 data. Its cloud-native architecture and parallel computing resources enable processing times to be about 2 s, overcoming the efficiency limitations of traditional desktop software workflows. The developed tool provides a scientifically reliable and browser-accessible alternative to field-intensive surveys, significantly improving operational applicability.
2) Comparative analysis show that there are substantial performance differences in the three spectral indices. Although dNDVI has higher accuracy after manual threshold adjustment (increasing from 84.48 % to 99.64 %), it consistently produces erroneous pixels and is not recommended as the primary burned area extraction index. In contrast, the combination of dNBR with Otsu adaptive thresholding shows optimal performance in burn scar identification and area calculation. The adaptive thresholding results (an area accuracy of 98.22 %, F1-score of 0.94) confirms the findings of Sukmono et al. [42]. Its ability to provide high accuracy without manual intervention makes dNBR the preferred choice for operational applications.
3) The tool provides a cost-effective and reliable solution for rapid assessment. Although the accuracy of the Random Forest model is slightly high, its longer processing time highlights the advantages of the proposed method: providing sufficiently accurate results with maximal speed and minimal complexity, which is often the priority in initial post-fire emergency response and investigation.
Future work will focus on three enhancements: (a) Assessing and improving the algorithm’s universality and transferability through testing in different ecological zones; (b) Reducing errors from agricultural areas and shadows using non-forest masking and additional filtering criteria; and (c) Increasing flexibility by integrating multi-source satellite data to improve temporal resolution. The transferability and broader “global applicability” of the framework will be validated through extensive multi-regional case studies in subsequent research.
References
-
S. Kalogiannidis, F. Chatzitheodoridis, D. Kalfas, C. Patitsa, and A. Papagrigoriou, “Socio-psychological, economic and environmental effects of forest fires,” Fire, Vol. 6, No. 7, p. 280, Jul. 2023, https://doi.org/10.3390/fire6070280
-
A. Duane, M. Castellnou, and L. Brotons, “Towards a comprehensive look at global drivers of novel extreme wildfire events,” Climatic Change, Vol. 165, No. 3-4, p. 43, Apr. 2021, https://doi.org/10.1007/s10584-021-03066-4
-
C. A. Silva, G. Santilli, E. E. Sano, and G. Laneve, “Fire occurrences and greenhouse gas emissions from deforestation in the Brazilian Amazon,” Remote Sensing, Vol. 13, No. 3, p. 376, Jan. 2021, https://doi.org/10.3390/rs13030376
-
X. Tian, F. Zhao, L. Shu, and M. Wang, “Distribution characteristics and the influence factors of forest fires in China,” Forest Ecology and Management, Vol. 310, pp. 460–467, Dec. 2013, https://doi.org/10.1016/j.foreco.2013.08.025
-
L. Knopp, M. Wieland, M. Rättich, and S. Martinis, “A deep learning approach for burned area segmentation with Sentinel-2 data,” Remote Sensing, Vol. 12, No. 15, p. 2422, Jul. 2020, https://doi.org/10.3390/rs12152422
-
X. Wang et al., “Estimation of forest fire burned area by distinguishing non-photosynthetic and photosynthetic vegetation using triangular space method,” Remote Sensing, Vol. 15, No. 12, p. 3115, Jun. 2023, https://doi.org/10.3390/rs15123115
-
H. Tong, J. Yuan, J. Zhang, H. Wang, and T. Li, “Real-time wildfire monitoring using low-altitude remote sensing imagery,” Remote Sensing, Vol. 16, No. 15, p. 2827, Aug. 2024, https://doi.org/10.3390/rs16152827
-
R. Llorens, J. A. Sobrino, C. Fernández, J. M. Fernández-Alonso, and J. A. Vega, “A methodology to estimate forest fires burned areas and burn severity degrees using Sentinel-2 data. Application to the October 2017 fires in the Iberian Peninsula,” International Journal of Applied Earth Observation and Geoinformation, Vol. 95, p. 102243, Mar. 2021, https://doi.org/10.1016/j.jag.2020.102243
-
E. Kurbanov et al., “Remote sensing of forest burnt area, burn severity, and post-fire recovery: a review,” Remote Sensing, Vol. 14, No. 19, p. 4714, Sep. 2022, https://doi.org/10.3390/rs14194714
-
C. Suwanprasit and Shahnawaz, “Mapping burned areas in Thailand using Sentinel-2 imagery and OBIA techniques,” Scientific Reports, Vol. 14, No. 1, p. 9609, Apr. 2024, https://doi.org/10.1038/s41598-024-60512-w
-
P. Liu, Y. Liu, X. Guo, W. Zhao, H. Wu, and W. Xu, “Burned area detection and mapping using time series Sentinel-2 multispectral images,” Remote Sensing of Environment, Vol. 296, p. 113753, Oct. 2023, https://doi.org/10.1016/j.rse.2023.113753
-
A. Bastarrika et al., “An automatic procedure for mapping burned areas globally using Sentinel-2 and VIIRS/MODIS active fires in Google Earth Engine,” ISPRS Journal of Photogrammetry and Remote Sensing, Vol. 218, pp. 232–245, Dec. 2024, https://doi.org/10.1016/j.isprsjprs.2024.08.019
-
S. Bar, B. R. Parida, and A. C. Pandey, “Landsat-8 and Sentinel-2 based Forest fire burn area mapping using machine learning algorithms on GEE cloud platform over Uttarakhand, Western Himalaya,” Remote Sensing Applications: Society and Environment, Vol. 18, p. 100324, Apr. 2020, https://doi.org/10.1016/j.rsase.2020.100324
-
Z. A. Haider et al., “Optimizing cloud security with a hybrid BiLSTM-BiGRU model for efficient intrusion detection,” ICCK Transactions on Sensing, Communication, and Control, Vol. 2, No. 2, pp. 106–121, May 2025, https://doi.org/10.62762/tscc.2024.433246
-
X. Jin et al., “YOLOv7-Bw: a dense small object efficient detector based on remote sensing image,” ICCK Transactions on Intelligent Systematics, Vol. 1, No. 1, pp. 30–39, May 2024, https://doi.org/10.62762/tis.2024.137321
-
H. Sun, Y. Wang, J. Du, and R. Wang, “MFE-YOLO: a multi-feature fusion algorithm for airport bird detection,” ICCK Transactions on Intelligent Systematics, Vol. 2, No. 2, pp. 85–94, May 2025, https://doi.org/10.62762/tis.2025.323887
-
H. Atasever and E. Tercan, “Deep learning-based burned forest areas mapping via Sentinel-2 imagery: a comparative study,” Environmental Science and Pollution Research, Vol. 31, No. 4, pp. 5304–5318, Dec. 2023, https://doi.org/10.1007/s11356-023-31575-5
-
X. Chen, Y. Zhang, S. Wang, Z. Zhao, C. Liu, and J. Wen, “Comparative study of machine learning methods for mapping forest fire areas using Sentinel-1B and 2A imagery,” Frontiers in Remote Sensing, Vol. 5, p. 14466, Dec. 2024, https://doi.org/10.3389/frsen.2024.1446641
-
D. Liu, Y. Qu, X. Yang, and Q. Zhao, “TSSA-NBR: a burned area extraction method based on time-series spectral angle with full spectral shape,” Remote Sensing, Vol. 17, No. 13, p. 2283, Jul. 2025, https://doi.org/10.3390/rs17132283
-
R. Tiengo, S. Merino-De-Miguel, J. Uchôa, N. Guiomar, and A. Gil, “Burned areas mapping using sentinel-2 data and a Rao’s Q index-based change detection approach: a case study in three mediterranean islands’ wildfires (2019-2022),” Remote Sensing, Vol. 17, No. 5, p. 830, Feb. 2025, https://doi.org/10.3390/rs17050830
-
S. Parks et al., “Giving ecological meaning to satellite-derived fire severity metrics across north american forests,” Remote Sensing, Vol. 11, No. 14, p. 1735, Jul. 2019, https://doi.org/10.3390/rs11141735
-
M. Sismanis, R.-T. Chadoulis, I. Manakos, and A. Drosou, “An unsupervised burned area mapping approach using Sentinel-2 images,” Land, Vol. 12, No. 2, p. 379, Jan. 2023, https://doi.org/10.3390/land12020379
-
M. C. Henry and J. K. Maingi, “Evaluating landsat – and Sentinel-2-derived burn indices to map burn scars in Chyulu Hills, Kenya,” Fire, Vol. 7, No. 12, p. 472, Dec. 2024, https://doi.org/10.3390/fire7120472
-
Y. Ding, M. Wang, Y. Fu, L. Zhang, and X. Wang, “A wildfire detection algorithm based on the dynamic brightness temperature threshold,” Forests, Vol. 14, No. 3, p. 477, Feb. 2023, https://doi.org/10.3390/f14030477
-
T. V. Loboda, L. Giglio, L. Boschetti, and C. O. Justice, “Regional fire monitoring and characterization using global NASA MODIS fire products in dry lands of Central Asia,” Frontiers of Earth Science, Vol. 6, No. 2, pp. 196–205, Jun. 2012, https://doi.org/10.1007/s11707-012-0313-3
-
A. Ali Alhussan, E.-S. M. El-Kenawy, D. Sami Khafaga, A. H. Alharbi, and M. M. Eid, “Groundwater resource prediction and management using comment feedback optimization algorithm for deep learning,” IEEE Access, Vol. 13, pp. 169554–169593, Jan. 2025, https://doi.org/10.1109/access.2025.3614168
-
A. E.-S. Saqr, M. S. Saraya, and E.-S. M. El-Kenawy, “Enhancing CO2 emissions prediction for electric vehicles using Greylag Goose optimization and machine learning,” Scientific Reports, Vol. 15, No. 1, p. 16612, May 2025, https://doi.org/10.1038/s41598-025-99472-0
-
E.-S. M. Elkenawy, A. A. Alhussan, M. M. Eid, and A. Ibrahim, “Rainfall classification and forecasting based on a novel voting adaptive dynamic optimization algorithm,” Frontiers in Environmental Science, Vol. 12, p. 14176, Jun. 2024, https://doi.org/10.3389/fenvs.2024.1417664
-
M. Chi, A. Plaza, J. A. Benediktsson, Z. Sun, J. Shen, and Y. Zhu, “Big data for remote sensing: challenges and opportunities,” Proceedings of the IEEE, Vol. 104, No. 11, pp. 2207–2219, Nov. 2016, https://doi.org/10.1109/jproc.2016.2598228
-
D. Phiri, M. Simwanda, S. Salekin, V. Nyirenda, Y. Murayama, and M. Ranagalage, “Sentinel-2 Data for land cover/use mapping: a review,” Remote Sensing, Vol. 12, No. 14, p. 2291, Jul. 2020, https://doi.org/10.3390/rs12142291
-
M. Aghababaei et al., “Introducing ARTMO’s machine-learning classification algorithms toolbox: application to plant-type detection in a semi-steppe iranian landscape,” Remote Sensing, Vol. 14, No. 18, p. 4452, Sep. 2022, https://doi.org/10.3390/rs14184452
-
S. T. Seydi, M. Akhoondzadeh, M. Amani, and S. Mahdavi, “Wildfire damage assessment over australia using sentinel-2 imagery and modis land cover product within the google earth engine cloud platform,” Remote Sensing, Vol. 13, No. 2, p. 220, Jan. 2021, https://doi.org/10.3390/rs13020220
-
A. Velastegui-Montoya, N. Montalván-Burbano, P. Carrión-Mero, H. Rivera-Torres, L. Sadeck, and M. Adami, “Google earth engine: a global analysis and future trends,” Remote Sensing, Vol. 15, No. 14, p. 3675, Jul. 2023, https://doi.org/10.3390/rs15143675
-
J. Zeng, X. Dai, W. Li, J. Xu, W. Li, and D. Liu, “Quantifying the impact and importance of natural, economic, and mining activities on environmental quality using the PIE-engine cloud platform: a case study of seven typical mining cities in China,” Sustainability, Vol. 16, No. 4, p. 1447, Feb. 2024, https://doi.org/10.3390/su16041447
-
G. Gao, Z. Chen, Y. Wei, X. Zhu, and X. Yu, “Enhancing DeepLabv3+ convolutional neural network model for precise apple orchard identification using GF-6 remote sensing images and PIE-engine cloud platform,” Remote Sensing, Vol. 17, No. 11, p. 1923, May 2025, https://doi.org/10.3390/rs17111923
-
S. Rafique, S. Iqbal, D. Ali, and F. Khan, “Navigating ethical challenges in 6G-enabled smart cities: privacy, equity, and governance,” ICCK Transactions on Sensing, Communication, and Control, Vol. 2, No. 1, pp. 48–65, Mar. 2025, https://doi.org/10.62762/tscc.2025.291581
-
J. W. Rouse, R. H. Haas, J. A. Schell, and D. W. Deering, “Monitoring vegetation systems in the great plains with ERTS,” in Proceedings of the Earth Resources Technology Satellite Symposium, Vol. 1, pp. 309–317, 1973.
-
L. Ji, L. Zhang, B. K. Wylie, and J. Rover, “On the terminology of the spectral vegetation index (NIR − SWIR)/(NIR + SWIR),” International Journal of Remote Sensing, Vol. 32, No. 21, pp. 6901–6909, Nov. 2011, https://doi.org/10.1080/01431161.2010.510811
-
M. J. L. García and V. Caselles, “Mapping burns and natural reforestation using thematic Mapper data,” Geocarto International, Vol. 6, No. 1, pp. 31–37, Sep. 2008, https://doi.org/10.1080/10106049109354290
-
S. A. Parks, L. M. Holsinger, M. A. Voss, R. A. Loehman, and N. P. Robinson, “Mean composite fire severity metrics computed with Google Earth engine offer improved accuracy and expanded mapping potential,” Remote Sensing, Vol. 10, No. 6, p. 879, Jun. 2018, https://doi.org/10.3390/rs10060879
-
S. L. Bangare, A. Dubal, P. S. Bangare, and S. T. Patil, “Reviewing Otsu’s method for image thresholding,” International Journal of Applied Engineering Research, Vol. 10, No. 9, pp. 21777–21783, May 2015, https://doi.org/10.37622/ijaer/10.9.2015.21777-21783
-
A. Sukmono, F. Hadi, E. Widayanti, A. L. Nugraha, and N. Bashit, “identifying burnt areas in forests and land fire using multitemporal normalized burn ratio (NBR) index on Sentinel-2 satellite imagery,” International Journal of Safety and Security Engineering, Vol. 13, No. 3, pp. 469–477, Jul. 2023, https://doi.org/10.18280/ijsse.130309
About this article

This work was jointly funded or supported by the 2022JSM06 Project, the National Natural Science Foundation of China (Grant No: 31200496), sponsored by the Jiangsu Province University Qinglan Project (2022).
The datasets generated during and/or analyzed during the current study are available from the corresponding author on reasonable request.
Lijun Mao: conceptualization, data processing, and manuscript writing. Tianxiang Zhou: data processing and manuscript writing. Chenghui Nan: acquisition of field survey data, manuscript review, and proofreading.
The authors declare that they have no conflict of interest.
