Abstract
Designing effective Water-Alternating-Gas (WAG) injection schemes is central to improving oil recovery while simultaneously enhancing CO2 storage outcomes in CO2-EOR operations. Operational choices such as injection rate, gas-to-water ratio (GWR), and cumulative CO2 throughput exert strong control on displacement efficiency, recycle rates, and the fraction of CO2 ultimately retained in the reservoir. Although numerical simulation remains the standard tool for WAG optimization, its high computational cost limits its usefulness for rapid evaluation of multiple operational scenarios, particularly under data uncertainty. To address this limitation, this study introduces a machine-learning-based forecasting workflow using the Temporal Fusion Transformer (TFT) to assess short-term CO2-EOR response and guide WAG optimization within a CCUS framework. Monthly injection and production records were digitized for six mature CO2-EOR fields in the United States, spanning a wide range of reservoir properties and development strategies. Pre-CO2 waterflood behavior was characterized using exponential decline functions to separate baseline trends from incremental oil production induced by CO2 injection. The TFT model was trained on multivariate time-series inputs – including water and CO2 injection rates-to predict oil and CO2 production over a 12-month horizon for alternative WAG configurations. Model robustness and predictive skill were improved through systematic hyperparameter tuning. Across most fields, the trained model demonstrated strong performance, achieving coefficients of determination greater than 0.87 for oil forecasts and above 0.91 for CO2 production. The forecasted results were subsequently used to quantify CO2 utilization and short-term retention, enabling field-specific operational insights. In the Denver Unit, for instance, increasing the GWR from 0.9 to 1.7 resulted in a 48 % increase in retained CO2 and a 38 % improvement in utilization efficiency. Conversely, reducing the GWR in the East Vacuum field from 0.7 to 0.2 enhanced near-term sequestration efficiency despite lower injection volumes. These findings highlight the strong sensitivity of CO2 storage performance to tailored WAG design and demonstrate the potential to reduce recycle losses through targeted operational adjustments. This work represents the first application of a Temporal Fusion Transformer model for multi-field CO2 EOR forecasting and WAG optimization from a CCUS perspective. Unlike prior machine-learning studies that focus primarily on production prediction, this framework directly links AI-based forecasts to operational CO2 utilization and retention metrics, enabling rapid scenario screening without full-physics simulation. The proposed efficiency score provides a novel, field-deployable indicator for balancing short-term oil recovery with carbon storage objectives, offering a scalable digital workflow to support CCUS operational decision-making.

Highlights
- Developed the first multi-field application of the Temporal Fusion Transformer (TFT) for CO2-EOR forecasting, enabling rapid 12-month predictions of oil and CO2 production without full-physics reservoir simulation.
- Demonstrated high predictive accuracy across six mature CO2-EOR fields, achieving high R2 values for oil production and CO2 production in most cases.
- Developed an AI-driven workflow that optimized Water-Alternating-Gas (WAG) injection strategies by linking machine learning forecasts to CO2 utilization and retention metrics.
- Introduced a novel efficiency score based on CO2 retention and utilization to balance enhanced oil recovery with carbon storage objectives and rapidly evaluate alternative WAG scenarios.
- Showed that field-specific WAG optimization increased CO2 retention while reducing CO2 utilization, improving the overall efficiency of CCUS operations
1. Introduction
Global climate commitments and net-zero ambitions have intensified the focus on technologies that can simultaneously enhance hydrocarbon recovery and sequester carbon dioxide (CO2). Carbon Capture, Utilization, and Storage (CCUS) represents one of the most mature, technically feasible, and economically viable decarbonization pathways available to the oil and gas industry [1]. Within this context, Enhanced Oil Recovery (EOR) using CO2 – particularly in Water-Alternating-Gas (WAG) injection schemes – has gained renewed interest for its potential to maximize incremental oil recovery while simultaneously storing significant quantities of CO2 underground.
CO2 EOR has been widely applied in the Permian Basin and other mature reservoirs for decades [1]. Yet, optimization of WAG operations remains an ongoing technical and economic challenge. The ratio of gas to water in WAG cycles – commonly represented as the gas-water ratio (GWR) – has a significant influence on reservoir sweep efficiency, mobility control, breakthrough timing, and ultimately on both oil production and CO2 retention [2]. Traditional approaches for optimizing GWR rely on numerical reservoir simulations, empirical decline curve analysis, or rule-of-thumb adjustments informed by operational experience. While effective to a degree, these methods are computationally expensive, time-consuming, and often lack the flexibility for short-term scenario testing.
Recent advances in machine learning (ML) and deep learning (DL) offer new opportunities to transform CO2 EOR optimization workflows. Time series forecasting models – particularly deep neural networks – can learn complex, nonlinear relationships from historical data without explicit assumptions about reservoir behavior. Among these, the Temporal Fusion Transformer (TFT) has emerged as a powerful architecture for multivariate forecasting tasks, combining the strengths of recurrent and attention-based networks [3]. TFT integrates static and time-varying inputs, handles missing data robustly, and offers interpretability via attention weights – making it suitable for data-rich but complex subsurface problems.
Despite the demonstrated success of deep learning in power forecasting, production scheduling, and process optimization, applications to CO2 EOR forecasting remain limited. Most prior efforts in CO2 EOR forecasting have focused on simpler ML models such as Random Forests, XGBoost, or LSTM networks [4-9]. These models, while effective for certain tasks, lack the temporal richness and attention mechanisms of TFT. Moreover, few studies have attempted to link ML forecasts with operational metrics such as CO2 utilization (MCF/BBL) and retention (%), both of which are critical for balancing economic returns and environmental stewardship.
In this study, we present a novel, data-driven framework that leverages TFT to forecast 12 months of CO2 and incremental oil production across six legacy CO2 EOR fields in the Permian Basin: East Vacuum (EV) [10-12], Denver Unit (DU) [1, 13, 14], Wasson San Andres (WSA) [13], Seminole San Andres Unit (SSAU) [15], SACROC [16, 17], and Rangely Weber Sand (RWS) [18, 19]. These fields were selected due to their long production histories, public data availability, and diverse operational characteristics. Production and injection data were digitized from historical publications and technical papers using Automeris.io [17] and preprocessed to isolate the incremental oil response to CO2. For each field, the waterflood trend was extrapolated using an exponential decline curve to estimate baseline performance; the difference was attributed to CO2 injection response – a method consistent with prior analytical approaches [21].
To evaluate short-term operational strategies, five different WAG scenarios were created per field by varying the GWR. These scenarios were inputted into the TFT model, which was trained on historical data and used to forecast monthly oil and CO2 production. Performance metrics including RMSE, MAE, and were calculated to assess model accuracy. Additionally, we calculated CO2 throughput, utilization, and retention efficiency using assumed formation volume factors (FVF) of 0.5 for CO2 and 1.0 for water as these values are common in Permian basin CCUS fields [13, 14]. This allowed us to compute a novel efficiency score (retention/utilization) to rank WAG scenarios by both economic and environmental merit.
Our results demonstrate that moderate WAG ratios (~1.5-2.5) offer the best trade-off between incremental oil recovery and CO2 retention. The approach presented here enables rapid scenario screening without full-scale simulation, making it highly applicable for annual planning and operational optimization. To the best of our knowledge, this is the first study to apply a Temporal Fusion Transformer across multiple legacy EOR fields for CCUS optimization. This work not only advances the application of AI in reservoir engineering but also contributes a replicable framework for accelerating digital CCUS strategies.
The novelty of this work lies in integrating Temporal Fusion Transformer forecasting with operational CO2 management metrics across multiple legacy CO2 EOR fields. While previous studies have applied machine learning to production prediction, this study uniquely couples AI-based forecasts with CO2 utilization, retention, and an efficiency score to directly guide WAG optimization. To the authors’ knowledge, this represents the first multi-field application of TFT for short-term CCUS operational planning, providing a fast, data-driven alternative to computationally intensive reservoir simulation.
In this study, CO2 utilization is implemented through Water-Alternating-Gas (WAG) injection, where alternating slugs of CO2 and water are injected to improve sweep efficiency while promoting subsurface CO2 storage. CO2 usage is quantitatively evaluated using three operational metrics: utilization (MCF injected per barrel of incremental oil), retention (% of injected CO2 remaining in the reservoir), and throughput-adjusted efficiency.
Historical injection and production data are used to characterize baseline waterflood performance via exponential decline analysis, enabling isolation of incremental oil recovery attributable to CO2 injection. Forecasted oil and CO2 production from the Temporal Fusion Transformer (TFT) model are subsequently used to compute utilization and retention under multiple gas-water ratio (GWR) scenarios.
By varying GWR while maintaining approximately constant total injection volume, this workflow directly evaluates how CO2 allocation between gas and water phases impacts short-term recovery and sequestration outcomes. An efficiency score, defined as the ratio of CO2 retention to utilization, is introduced as a practical screening metric to balance economic performance with carbon storage effectiveness.
2. Field and data description
This study focuses on six legacy CO2 EOR fields in the United States with mature operational histories and publicly available production and injection data: East Vacuum (EV), Denver Unit (DU), Wasson San Andres Field (WSA), Seminole San Andres Unit (SSAU), SACROC, and Rangely Weber Sand (RWS). These fields represent a diverse range of reservoir architectures, injection strategies, and WAG implementations, offering a robust testbed for developing and validating short-term machine learning-based forecasting models.
2.1. Field selection and characteristics
The selected fields span the Permian Basin and other major CO2 EOR hubs, encompassing a range of heterogeneity, operational practices, and injection histories:
1) Denver Unit (DU): The Denver Unit in the Wasson Field is a major San Andres carbonate reservoir under CO2 EOR since 1983, following pilot testing in 1978. It features strong surveillance programs and variable WAG ratios. The field is currently operated by Occidental Petroleum [1, 13, 14].
2) SACROC: The SACROC Unit in the Midland Basin began CO2 injection in 1972, transitioning from immiscible to miscible floods over time. It targets the Pennsylvanian Canyon Reef with decades of EOR experience. Kinder Morgan is the current operator [2, 17].
3) Wasson San Andres Field (WSA): The WSA represents a combination of units (e.g., Willard, Bennet Ranch, DU) in the San Andres formation. Discovered in 1936, it includes thick carbonate with extensive WAG-based EOR development since the 1980’s [13].
4) Seminole San Andres Unit (SSAU): SSAU includes complex carbonate facies and a well-developed Residual Oil Zone. It has a long CO2 EOR history with consistently high WAG ratios and known field-wide geological heterogeneity [15].
5) East Vacuum (EV): East Vacuum is a smaller, data-rich field with phased CO2injection. It serves as a valuable site for short-term CO2 performance evaluation [10-12].
6) Rangely Weber Sand (RWS): RWS lies in the Paradox Basin and is geologically distinct with a siliciclastic Weber Sand reservoir. Its behavior under CO2 EOR differs from carbonate analogs, making it a valuable contrast field [18, 19].
2.2. Data acquisition and digitization
Historical production and injection data were digitized using Automeris.io [17, 20], an open-source graphical digitization tool, from publicly available technical sources and additional literature and field summaries from DOE reports and technical presentations were also referenced to contextualize the data and validate trends [1, 2, 10-19].
Where necessary, data were smoothed using a moving average filter to minimize digitization noise. Missing values or inconsistencies were handled through interpolation or masking during model training. All-time series were aligned to a common index (month since CO2 start), allowing for a standardized forecasting horizon across fields. See examples of digitized DU data [1, 13, 14] in Fig. 1, while EV field production data, shown in Fig. 2, was a combination of digitized data and publicly sourced data [10-12].
Fig. 1Denver unit production and injection plot based on data digitized from public sources [1, 13, 14]
![Denver unit production and injection plot based on data digitized from public sources [1, 13, 14]](https://static-01.extrica.com/articles/25830/25830-img1.jpg)
Fig. 2EV production and injection plot based on data digitized from public sources [10-12]
![EV production and injection plot based on data digitized from public sources [10-12]](https://static-01.extrica.com/articles/25830/25830-img2.jpg)
2.3. Parsing incremental CO2 response and production
To isolate the oil production response attributable to CO2 injection, the waterflood performance prior to CO2 start was extrapolated using exponential decline curve analysis, following a common analytical practice for baseline estimation [21]. The deviation from this trend during the CO2 injection phase was attributed to incremental recovery from CO2. This method is particularly important in mature fields where the transition from waterflood to CO2 injection does not always exhibit a clean production breakpoint.
For SACROC, the start of the analysis window was aligned with the commencement of miscible CO2 injection to exclude prior immiscible or waterflood effects. The parsed EOR response was used as the target variable in the TFT forecasting model, ensuring that predictions represent CO2-specific incremental oil rather than total field production.
To isolate CO2 production response, the gas-oil-ratio (GOR) prior to CO2 injection was taken as a baseline and held constant throughout the CO2 production period to extrapolate hydrocarbon gas production which enabled parsing out CO2 production.
2.4. Derived metrics
To assess the performance of different WAG scenarios, several key operational metrics were computed:
1) CO2 Utilization (MCF/BBL): Total CO2 injected divided by incremental oil produced.
2) CO2 Retention (%): Defined as 100 × (CO2 injected − CO2 produced) / CO2 injected.
3) Gas-Water Ratio (GWR): Defined as MCFPD / BWIPD, used to characterize WAG regime.
4) Throughput: Calculated by converting volumetric injection rates using assumed formation volume factors.
5) Formation volume factors were assumed as follows:
– CO2 FVF = 0.5, based on typical values reported for reservoir conditions in Permian fields [14].
– Water FVF = 1.0, assuming negligible compressibility for brine under reservoir pressure.
These parameters enabled the computation of an efficiency score for each scenario, defined as the ratio of retention to utilization. This score provides a quantitative basis for selecting optimal WAG ratios that balance CO2 storage goals with oil recovery efficiency.
3. Methodology
This section describes the approach used to forecast short-term CO2 and oil production responses in CO2 EOR projects using the Temporal Fusion Transformer (TFT) model. The workflow consisted of five major stages: data preprocessing and normalization, parsing of CO2 incremental response, model training, WAG scenario creation, and post-processing for performance and efficiency analysis.
3.1. Forecasting model: temporal fusion transformer (TFT)
The Temporal Fusion Transformer (TFT) is a state-of-the-art deep learning model for interpretable multi-horizon time series forecasting. Originally proposed by Lim et al. (2021), TFT combines long- and short-term memory components through LSTM layers with attention mechanisms, allowing it to capture both temporal dependencies and variable importance across time and feature dimensions.
TFT is particularly well-suited for CO2 EOR forecasting due to its ability to incorporate static, time-varying known, and unknown covariates, its support for missing values and irregular time steps, and its scalability across multiple fields with differing temporal lengths.
Model implementation was done using the pytorch-forecasting library in Python with pytorch-lightning for training orchestration. All training was conducted on CPU to ensure reproducibility across environments.
3.2. Data preprocessing
For each of the six fields, time series data was standardized using the following preprocessing steps:
1) Time Re-indexing: All monthly data were aligned using a continuous time_idx variable starting from the onset of CO2 injection (or miscible injection in SACROC).
2) Scaling: The target variable (incremental EOR oil) was normalized using a StandardScaler, and scaled values were used during model training.
3) Covariate Encoding: Time-varying known variables included:
– BWIPD (barrels of water injected per day).
– MCFID (thousand cubic feet of CO2 injected per day).
– Month number.
These covariates informed the model of known injection conditions at each timestep. Each field was treated independently, and group normalization was applied to the target variable.
3.3. Parsing CO2 response
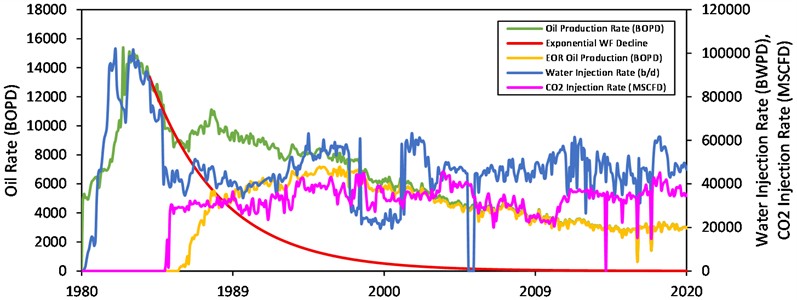
The total oil production includes contributions from both waterflood and CO2 injection. To isolate the incremental CO2 response, an exponential decline model was fit to the pre-CO2 waterflood period and extrapolated into the CO2 injection period. The difference between the extrapolated curve and actual production was taken as the net CO2-driven response. Figs. 3-4 show an example of parsing out the incremental oil from DU and EV fields, respectively, using Exponential decline. It should be noted that EV field did not have as much data to fit the decline curve.
Fig. 3Example of EOR production extrapolation using decline curve analysis for DU field
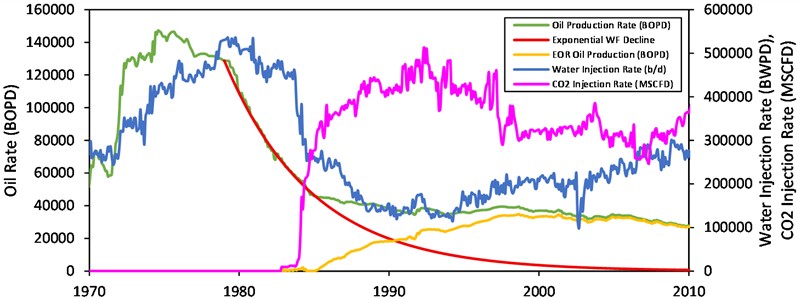
Fig. 4EOR production extrapolation using decline curve analysis for EV field
This approach is consistent with analytical best practices in field studies and ensures that the model focuses on forecasting CO2-responsive oil rather than general field behavior. This parsed CO2 EOR response became the model’s forecast target (target_scaled).
3.4. Hyperparameter optimization
To improve the performance of the Temporal Fusion Transformer (TFT) model, hyperparameter optimization was carried out to tune key parameters including max_encoder_length, hidden_size, attention_head_size, and learning_rate. A genetic algorithm-based search was used to explore the parameter space and minimize the validation root mean squared error (RMSE). This automated tuning process ensured better generalization and forecasting accuracy across all six CO2 EOR fields. The selected hyperparameters were applied consistently across scenarios to preserve comparability of results.
3.5. Model training and validation
Each field's data was split into:
1) Training set (80 %).
2) Validation set (10 %).
3) Test set (10 %).
A “TimeSeriesDataSet” object was created per field using:
1) max_encoder_length = 6 months.
2) max_prediction_length = 1 month (rolled iteratively for a 12-month horizon).
3) Training used the following configuration:
– Learning rate: 0.001.
– Hidden size: 64.
– Attention head size: 1.
– Dropout: 0.
– Loss function: RMSE.
– Early stopping: Patience of 200 epochs.
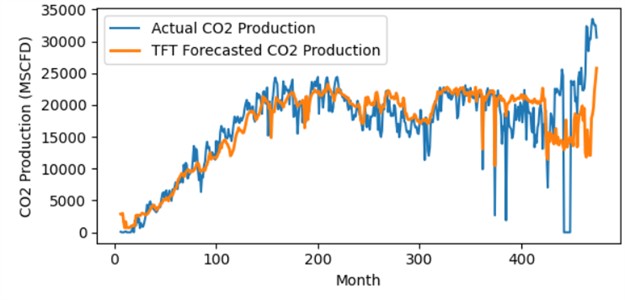
Performance was evaluated using RMSE, MAE, and . Results showed strong training accuracy, particularly for EOR oil production, with average values exceeding 0.87 across fields. For example, Figs. 5-6 show the comparison between actual and model predicted incremental oil production and CO2 production, respectively for DU field, while Figs. 7-8 show the oil and CO2 production for DU, respectively.
Fig. 5Actual vs predicted incremental oil production for DU
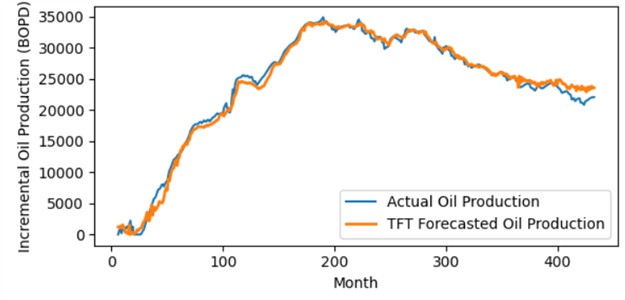
Fig. 6Actual vs predicted CO2 production for DU
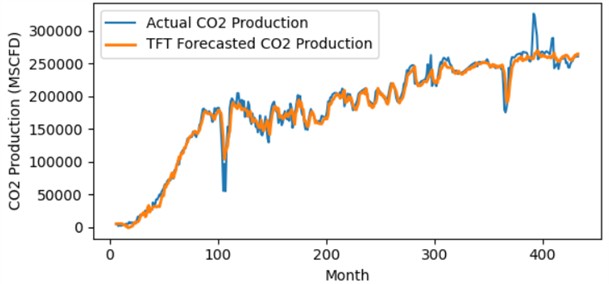
Fig. 7Actual vs predicted incremental oil production for EV
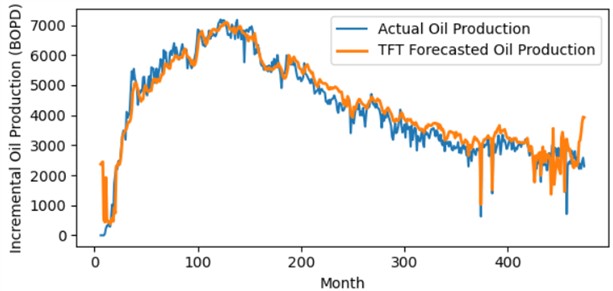
Fig. 8Actual vs predicted CO2 production for EV
3.6. WAG scenario design and forecasting
To simulate the effect of different gas-water ratios (GWR) in WAG operations, five scenarios were developed per field using the GWR multipliers of 1 (base), 2, 3, 0.5, 0.33.
For each scenario, water and CO2 injection rates were recomputed to maintain a constant injection volume and throughput while altering the gas/water ratio:
where and are the original CO2 and water injection rates, respectively. These modified rates were then input into the TFT model as future known covariates. Each scenario was forecasted for 12 months into the future, generating predictions for both CO2 production (MCFPD) and EOR oil production (BOPD).
Separate models were trained for each target. For each forecast, the predicted oil and gas responses were used to compute:
– Utilization (MCF injected per BBL of oil).
– Retention (%).
– Efficiency score = Retention / Utilization.
These metrics allowed quantitative ranking of WAG ratios.
4. Results and discussion
4.1. Model forecast accuracy
The Temporal Fusion Transformer demonstrated high accuracy in forecasting both CO2 and oil production across all six fields. Forecast quality was evaluated using Root Mean Squared Error (RMSE), Mean Absolute Error (MAE), and Coefficient of Determination ().
The model exhibited consistently strong performance in oil prediction, with values exceeding 0.87 in most fields and peaking at 0.95 in the Wasson San Andres (WSA) field. CO2 production forecasts also showed excellent alignment, achieving values above 0.91 in five out of six fields, except for East Vacuum (EV), which recorded lower accuracy (0.54), likely due to greater operational noise and limited waterflood production data to fit the exponential decline too. Summary of accuracy metrics for both Oil and CO2 production are shown in Table 1 and Table 2, respectively.
Table 1Forecast accuracy metrics for EOR oil production
Field | RMSE | MAE | Relative error (RMSE) | |
DU | 3243 | 2586 | 0.87 | 12 % |
EV | 505 | 389 | 0.90 | 16 % |
RWS | 729 | 516 | 0.89 | 8 % |
SACROC | 2205 | 1803 | 0.81 | 9 % |
SSAU | 2635 | 2193 | 0.89 | 14 % |
WSA | 2896 | 2085 | 0.95 | 7 % |
Table 2Forecast accuracy metrics for CO2 production
Field | RMSE | MAE | Relative error (RMSE) | |
DU | 21424 | 16011 | 0.91 | 9 % |
EV | 4739 | 3266 | 0.54 | 21 % |
RWS | 7081 | 5258 | 0.95 | 6 % |
SACROC | 77816 | 67168 | 0.87 | 12 % |
SSAU | 21523 | 16988 | 0.91 | 11 % |
WSA | 37088 | 29727 | 0.92 | 9 % |
These results validate the applicability of TFT for short-term forecasting of CO2 EOR responses, providing a robust alternative to full-physics simulation for annual planning.
4.2. Optimization of WAG ratios
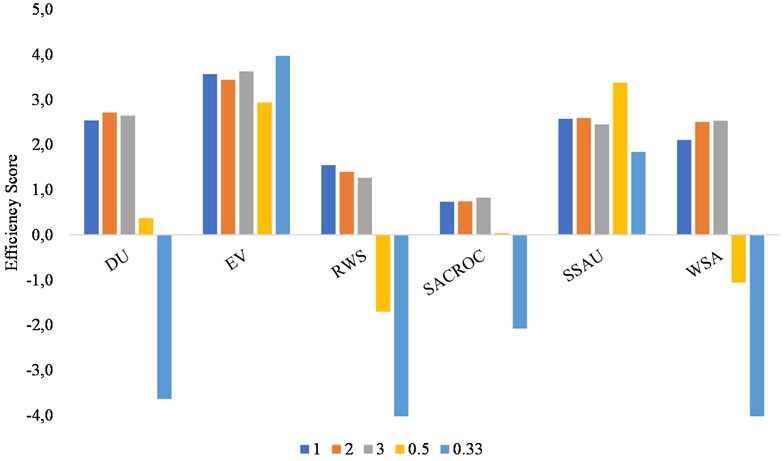
To evaluate the operational impact of varying WAG ratios, five injection scenarios were simulated per field, adjusting the CO2-to-water injection ratio (GWR) while holding total injection volume approximately constant. Key metrics defined earlier included utilization, retention and efficiency score. Fig. 9 shows the efficiency trends for all fields with the colors corresponding to the GWR multiplier “X”. It can be seen from the figure that there is room to optimize most of these fields since the base case (1) does not always exhibit the highest efficiency score. This data is also summarized in Table 3. A general pattern emerged: GWR = 2-3 produced the highest retention (up to 79 %) but diminishing oil gains, leading to moderate efficiency scores. GWR = 0.3-0.5 offered better oil rates but negative retention due continuation of production of pre-injected CO2. An intermediate GWR of ~1.0-1.5 often balanced both goals, achieving retention of 50-60 % with utilization rates between 13-21 MCF/BBL.
Table 3Summary of WAG optimization results
Field | GWR multiplier scenario | GWR | Utilization (MCF/BBL) | CO2 retention (%) | Efficiency score |
DU | 1 | 0.9 | 15.2 | 39 % | 2.5 |
2 | 1.7 | 21.1 | 57 % | 2.7 | |
3 | 2.6 | 23.7 | 63 % | 2.6 | |
0.5 | 0.4 | 10.6 | 4 % | 0.4 | |
0.33 | 0.3 | 8.5 | –31 % | –3.6 | |
EV | 1 | 0.7 | 14.3 | 51 % | 3.6 |
2 | 1.4 | 19.6 | 67 % | 3.4 | |
3 | 2.0 | 21.7 | 79 % | 3.6 | |
0.5 | 0.3 | 9.5 | 28 % | 2.9 | |
0.33 | 0.2 | 6.8 | 27 % | 4.0 | |
RWS | 1 | 0.4 | 19.3 | 30 % | 1.5 |
2 | 0.7 | 36.0 | 50 % | 1.4 | |
3 | 1.1 | 47.7 | 60 % | 1.3 | |
0.5 | 0.2 | 11.6 | –20 % | –1.7 | |
0.33 | 0.1 | 8.0 | –68 % | –8.5 | |
SACROC | 1 | 0.6 | 33.8 | 25 % | 0.7 |
2 | 1.3 | 50.1 | 37 % | 0.7 | |
3 | 1.9 | 58.8 | 49 % | 0.8 | |
0.5 | 0.3 | 21.8 | 1 % | 0.0 | |
0.33 | 0.2 | 19.0 | –39 % | –2.1 | |
SSAU | 1 | 0.9 | 20.5 | 53 % | 2.6 |
2 | 1.9 | 24.7 | 64 % | 2.6 | |
3 | 2.8 | 28.0 | 68 % | 2.4 | |
0.5 | 0.5 | 11.9 | 40 % | 3.4 | |
0.33 | 0.3 | 9.4 | 17 % | 1.8 | |
WSA | 1 | 1.1 | 13.8 | 29 % | 2.1 |
2 | 2.1 | 18.0 | 45 % | 2.5 | |
3 | 3.2 | 20.0 | 51 % | 2.5 | |
0.5 | 0.5 | 9.1 | –10 % | –1.1 | |
0.33 | 0.3 | 6.8 | –51 % | –7.6 |
Table 4 presents the recommended adjustments to the gas-water ratio (GWR) for each field based on short-term Temporal Fusion Transformer (TFT) forecasts. The goal was to maximize CO2 sequestration efficiency, defined here as the ratio of CO2 retention to utilization (MCF injected per barrel of oil produced). For most fields, adjusting the GWR yields measurable improvements in efficiency. In the Denver Unit (DU), increasing the GWR from 0.9 to 1.7 results in an 8 % gain in efficiency, with CO2 utilization improving by 38 % and retention by 48 %. SACROC shows a modest efficiency gain (+14 %) when increasing the GWR to 1.9, driven by significant improvements in retention (+96 %). Conversely, fields such as SSAU and EV benefit from reducing the GWR. In SSAU, decreasing the GWR from 0.9 to 0.5 leads to the largest relative improvement in efficiency (+31 %), despite reductions in both utilization and retention. For EV, reducing the GWR to 0.2 increases efficiency by 11 %, though model uncertainty (low R²) warrants cautious interpretation. Fields like RWS show minimal sensitivity to GWR changes within the tested range, suggesting that other operational levers may be more impactful. Meanwhile, WSA shows that pushing to higher GWR values (3.2) can yield a 19 % efficiency improvement, albeit with a notable increase in CO2 injection rate.
Fig. 9Efficiency scores for different fields at different WAG multiplier scenarios
These findings support field-specific, short-term WAG adjustments as a practical lever for improving CO2 management performance in mature EOR assets.
Table 4Optimization recommendations and simulated benefits of the study
Current | Recommended | Benefit | ||||||
Field | GWR | Efficiency score | GWR | Efficiency score | CO2 injection rate (MMCFPD) | efficiency (%) | utilization (%) | CO2 retention (%) |
DU | 0.9 | 2.5 | 1.7 | 2.7 | 150 | +8 % | +38 % | +48 % |
EV* | 0.7 | 3.6 | 0.2 | 4 | –25 | +11 % | -52 % | -47 % |
RWS | 0.4 | 1.5 | 0.4 | 1.5 | 0 | 0 % | 0 % | 0 % |
SACROC | 0.6 | 0.7 | 1.9 | 0.8 | 604 | +14 % | +74 % | +96 % |
SSAU | 0.9 | 2.6 | 0.5 | 3.4 | –135 | +31 % | -42 % | -24 % |
WSA | 1.1 | 2.1 | 3.2 | 2.5 | 265 | +19 % | +45 % | +75 % |
Note: *EV results should be interpreted with caution due to lower model accuracy (R² < 0.6) during training | ||||||||
4.3. Operational insights
From the modeling exercise, several operational insights emerged. Short-term optimizations (12-month horizon) can be meaningfully supported with machine learning tools that are data-driven and less dependent on static reservoir models. Additionally, the efficiency score proposed here enables simultaneous targeting of both climate (sequestration) and economic (oil recovery) KPIs. This study shows that deep learning forecasting tools, particularly TFT, can play a critical role in bridging production optimization and carbon management. The efficiency score developed here – linking CO2 retention and utilization – serves as a proxy for carbon abatement effectiveness. By embedding such models into operational workflows, operators can make evidence-based adjustments to WAG ratios, directly enhancing sequestration permanence while maintaining oil revenue streams. These insights are especially useful for compliance-driven projects targeting carbon credit monetization under programs such as 45Q and LCFS.
5. Conclusions
This study demonstrates the successful application of a Temporal Fusion Transformer (TFT) deep learning model to forecast CO2 and oil production performance across six legacy CO2 EOR fields under a range of Water-Alternating-Gas (WAG) ratios. By digitizing historical injection and production data and applying consistent forecasting and optimization workflow, we achieved several key outcomes:
The TFT model achieved high predictive accuracy across diverse field conditions, with values exceeding 0.87 for oil production and 0.91 for CO2 production in most cases. This confirms the model’s suitability for short-term operational forecasting without detailed reservoir models.
EV field showed a low fit likely due to poor quality of EOR oil extrapolation using exponential decline. This is due to the lack of extended period of waterflood decline oil production. This shows that a good exponential fit and extrapolation is essential in properly training the TFT model and accurately predicting future performance
A clear tradeoff emerged between CO2 utilization (MCF per barrel) and CO2 retention (%) as WAG ratio increased. While higher GWRs improved retention, they often led to diminishing returns in oil recovery. Conversely, low GWRs reduced CO2 storage effectiveness and, in some cases, resulted in negative retention.
Optimal WAG ratios varied by field, with the best-performing scenarios typically falling in the GWR range of 1.5-2.5, balancing both oil recovery and sequestration goals. The efficiency score proposed in this study (Retention / Utilization) provides a useful single-parameter screening tool to guide such optimization.
To the authors’ knowledge, this is the first published study applying the TFT architecture to multivariate CO2 EOR forecasting across multiple fields and using it to evaluate short-term WAG strategy optimization. Unlike traditional simulation approaches, this workflow enables rapid scenario testing using only field-level production data.
Adopting TFT-based forecasts can help reduce CO2 utilization by up to 42 % and increase retention by as much as 96 % (e.g., in SACROC), providing tangible gains in sequestration efficiency.
This study introduces three key innovations: (1) the first multi-field application of the Temporal Fusion Transformer for CO2 EOR forecasting, (2) a practical workflow that converts AI predictions into actionable WAG optimization through CO2 utilization and retention metrics, and (3) a new efficiency score that jointly captures economic and sequestration performance. Together, these contributions demonstrate how deep learning can transition from predictive analytics to operational CCUS decision support.
The proposed framework can be integrated into annual business planning and reservoir review cycles, providing low-latency forecasts and rapid screening of WAG scenarios. This supports timely decision-making in mature CO2 EOR operations.
While model accuracy was strong overall, future work should incorporate additional variables (e.g., injection pressures, well spacing, tracer data) to improve accuracy in more heterogeneous settings like East Vacuum.
A hybrid approach combining TFT-based forecasting with physics-based simulation could offer the best of both worlds: speed, interpretability, and physical rigor – especially for life-of-field strategy design and regulatory assessments.
The use of machine learning to improve short-term CO2 retention and reduce utilization rates can support net-zero and low-carbon targets, especially when coupled with carbon credit frameworks. This highlights the role of data science not just in EOR, but in CCUS strategy optimization more broadly.
The analyses and recommendations presented in this paper are intended solely for research and educational purposes. They are based on publicly available data, machine learning forecasts, and simplified operational assumptions. They are not intended to substitute for detailed reservoir studies or engineering judgment. Field implementation should be preceded by appropriate technical due diligence, risk assessment, and consultation with qualified professionals.
References
-
“A roadmap to at-scale deployment of carbon capture, use, and storage – enhanced oil recovery case studies,” National Petroleum Council, Dec. 2019.
-
M. A. Samba and M. O. Elsharafi, “Literature review of water alternation gas injection,” Journal of Earth Energy Engineering, Vol. 7, No. 2, pp. 33–45, Oct. 2018, https://doi.org/10.25299/jeee.2018.vol7(2).2117
-
“Demand forecasting with the temporal fusion transformer – Pytorch-Forecasting documentation.” Pytorch-Forecasting. https://pytorch-forecasting.readthedocs.io/en/stable/tutorials/stallion.html
-
J. Asante, W. Ampomah, J. Tu, and M. Cather, “Data-driven modeling for forecasting oil recovery: a timeseries neural network approach for tertiary CO2 WAG EOR,” Geoenergy Science and Engineering, Vol. 233, p. 212555, Feb. 2024, https://doi.org/10.1016/j.geoen.2023.212555
-
X. Du, S. Salasakar, and G. Thakur, “A comprehensive summary of the application of machine learning techniques for CO2-enhanced oil recovery projects,” Machine Learning and Knowledge Extraction, Vol. 6, No. 2, pp. 917–943, Apr. 2024, https://doi.org/10.3390/make6020043
-
M. Gao et al., “Machine-learning-based approach to optimize CO2-WAG flooding in low permeability oil reservoirs,” Energies, Vol. 16, No. 17, p. 6149, Aug. 2023, https://doi.org/10.3390/en16176149
-
H. Li, C. Gong, S. Liu, J. Xu, and G. Imani, “Machine learning-assisted prediction of oil production and CO2 storage effect in CO2-water-alternating-gas injection (CO2-WAG),” Applied Sciences, Vol. 12, No. 21, p. 10958, Oct. 2022, https://doi.org/10.3390/app122110958
-
Z. Xiao, B. Shen, J. Yang, K. Yang, Y. Zhang, and S. Yang, “Deep learning framework for accurate static and dynamic prediction of CO2 enhanced oil recovery and storage capacity,” Processes, Vol. 12, No. 8, p. 1693, Aug. 2024, https://doi.org/10.3390/pr12081693
-
J. You, W. Ampomah, A. Morgan, Q. Sun, and X. Huang, “A comprehensive techno-eco-assessment of CO2 enhanced oil recovery projects using a machine-learning assisted workflow,” International Journal of Greenhouse Gas Control, Vol. 111, p. 103480, Oct. 2021, https://doi.org/10.1016/j.ijggc.2021.103480
-
K. J. Harpole and L. D. Hallenbeck, “East Vacuum Grayburg San Andres Unit CO2 flood ten year performance review: evolution of a reservoir management strategy and results of WAG optimization,” in Annual Technical Conference and Exhibition, Jan. 1996, https://doi.org/10.2118/36710-ms
-
P. Moffitt, D. Pecore, M. Trees, and G. Salts, “East Vacuum Grayburg San Andres Unit, 30 years of CO2 flooding: accomplishments, challenges and opportunities,” in Annual Technical Conference and Exhibition, Sep. 2015, https://doi.org/10.2118/175000-ms
-
Go-Tech, https://gotech.nmt.edu/gotech/ (accessed 2025).
-
“Oxy Denver unit CO2 subpart RR monitoring, reporting and verification (MRV) plan,” US Environmental Protection Agency, Dec. 2015.
-
“Technical review of Subpart RR MRV plan for Denver Unit,” US Environmental Protection Agency, Aug. 2023.
-
“Oxy Seminole San Andres unit subpart RR monitoring, reporting and verification (MRV) plan,” US Environmental Protection Agency, Jul. 2023.
-
R. B. Ghahfarokhi, S. Pennell, M. Matson, and M. Linroth, “Overview of CO2 injection and WAG sensitivity in SACROC,” in Improved Oil Recovery Conference, Mar. 2016, https://doi.org/10.2118/179569-ms
-
“Carbon Dioxide (CO2) operations | Kinder Morgan.” Kinder Morgan, 2021, www.kindermorgan.com/operations/co2/index.
-
J. Cooper, “Rangely weber sand unit WAG management optimization,” in CO2 Midland Conference, Dec. 2016.
-
L. O. Masoner and R. K. Wackowski, “Rangely weber sand unit CO2 project update,” SPE Reservoir Engineering, Vol. 10, No. 3, pp. 203–207, Aug. 1995, https://doi.org/10.2118/27755-pa
-
“AI assisted data extraction from charts using WebPlotDigitizer.” Automeris, https://automeris.io/
-
D. W. Hampton and A. Wagia-Alla, “Analytical method for forecasting ROZ production in a commingled MOC and ROZ CO2 flood,” in Improved Oil Recovery Conference, Apr. 2022, https://doi.org/10.2118/209365-ms
About this article

The authors have not disclosed any funding.
The datasets generated during and/or analyzed during the current study are available from the corresponding author on reasonable request.
Ahmed Wagia-Alla: writing conceptualization, analysis, results and discussion. Mohamed Alghazal: data analysis, methodology and reviewing. Turki Alzahrani: data analysis, methodology and reviewing.
The authors declare that they have no conflict of interest.

