Abstract
Traditional photovoltaic models are difficult to accurately characterize the relationship between maximum power and environmental and electrical parameters due to their strong nonlinearity and complex solutions. This study, based on a single-diode model and combined with standard data, proposes a multi-parameter dynamic coupling model that integrates irradiance, temperature, and shunt resistance. The accuracy of the model has been significantly improved, with current error less than ±0.4 % and power error less than ±1 %. It effectively clarifies the impact of multiple factors on maximum power and provides support for the optimized design of large-scale photovoltaic systems.
1. Introduction
The performance of monocrystalline silicon solar cells is significantly affected by light and temperature: light determines efficiency, and temperature affects electrical characteristics, which together cause deviations between theory and practice, restricting system optimization and efficiency. Therefore, building a high-precision model to accurately describe the environment-related output characteristics is an urgent need in the photovoltaic field [1]. Some literature analyzes changes in battery output characteristics by dynamically adjusting light and temperature [2-3]. The engineering practical model in reference [4] is easy to calculate, but the error is large in non-standard environments; reference [5] uses the prediction results of a single diode five-parameter model to confirm its applicability in complex environments. Reference [6] conducted a comparative study on the peak wind load estimation methods for buildings, constructed a rigorous model comparison and analysis framework, and emphasized the identification and quantitative analysis of error sources. It can provide a standardized research approach for the comparison of parameter identification methods, error estimation and model verification in photovoltaic modeling. Reference [7] explored the statistical characteristics of the peak wind pressure factor of hyperbolic paraboloid roof and its dependence on the structural shape. It integrated the statistical law of peak response into performance modeling. Its rigorous extreme value statistics and modeling integration approach has important reference significance for the response analysis and error assessment of photovoltaic models under extreme working conditions and fluctuation conditions. Reference [8] systematically compared various solar cell parameter extraction methods and error indices based on experimental and simulation data, established a model performance evaluation benchmark, and provided a direct reference for the selection of photovoltaic parameter identification methods and accuracy evaluation. Reference [9] evaluated the accuracy of photovoltaic models under variable environments such as irradiance and temperature, and used refined error quantification methods to analyze the robustness and practicality of the models, further improving the reliability evaluation system of photovoltaic modeling in actual working conditions.
The existing models have achieved remarkable results, but the impact of environmental parameters has not been fully quantified, resulting in measurement deviations. In addition, parameter identification is difficult and the calculation cost is high, which hinders engineering application. Based on a single-diode model, a high-precision parameterized model incorporating multiple environmental factors was constructed to effectively simulate multi-factor coupled operating conditions, balancing simplicity with accuracy. Series and parallel resistances were determined through sensitivity analysis to ensure accuracy and reduce computational complexity.
2. Corrected model of single crystal silicon solar cells
Fig. 1 shows the equivalent circuit model of a single diode. is the ideal photocurrent source, VD is the diode, and are the parallel and series equivalent resistances inside the battery respectively, is the output current, and is the output voltage.
Fig. 1Single diode equivalent circuit of a monocrystalline silicon solar cell
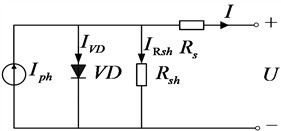
According to the KCL law, the output current of the solar cell can be written as:
Within a certain temperature range, the photocurrent can be approximately expressed as a linear function of light intensity:
where is the short-circuit current under standard test conditions ( 1000 W/m2, 25 ℃), is the temperature coefficient of the short-circuit current, is the light intensity, and is the temperature.
The diode current obeys the modified Shockley equation:
The reverse saturation current increases exponentially with temperature and material, electron charge q (1.602×10⁻19 C), ideality factor n (reflecting the quality of the PN junction), Boltzmann constant k (1.38×10⁻23 J/K), and thermodynamic temperature (K).
Two exponential terms are introduced to describe the current characteristics under different composite mechanisms. The model expression is:
Increasing the number of parameters improves the model’s ability to describe complex physical processes, but also increases the difficulty of parameter extraction. Define the change of with temperature as:
where is the series resistance at 25 °C; is the linear coefficient (approximately 0.002/°C for single-crystal silicon; resistance increases at high temperatures); is the quadratic coefficient (approximately 0.00001/(°C)2, used for nonlinear compensation). Photocurrent exhibits nonlinearity under high illumination and is corrected to:
where is the short-circuit current temperature coefficient; is the nonlinear effect (the correction coefficient increases as increases, resulting in higher light intensity composite loss).
The corrected model can be obtained:
3. Model comparison and contrast
In order to verify the accuracy of the single-crystal silicon solar cell model, a simulation comparison experiment was carried out. Table 1 is a comparison table of the two model data.
Table 1Comparison of data between the two models when T= 25 ℃ and S= 1000 W/m2
Reference data | Test data | Data comparison | ||||
/ V | / A | / W | / A | / W | % | % |
4.00 | 3.81 | 15.22 | 3.80 | 15.20 | 0.16 % | 0.13 % |
10.00 | 3.80 | 38.00 | 3.80 | 38.00 | 0.00 % | 0.00 % |
14.69 | 3.75 | 55.09 | 3.77 | 55.38 | –0.53 % | –0.53 % |
16.63 | 3.60 | 59.87 | 3.62 | 60.17 | –0.56 % | –0.50 % |
17.53 | 3.40 | 59.60 | 3.43 | 59.95 | –0.88 % | –0.59 % |
18.40 | 3.05 | 56.12 | 3.04 | 55.91 | 0.33 % | 0.37 % |
18.76 | 2.85 | 53.47 | 2.78 | 52.25 | 2.46 % | 2.28 % |
19.33 | 2.40 | 46.39 | 2.36 | 45.60 | 1.67 % | 1.70 % |
20.34 | 1.20 | 24.41 | 1.19 | 24.16 | 0.83 % | 1.02 % |
Table 1 compares the test data of the proposed optical model with the experimental reference test data. In Table 1, the current and power of the experimental reference test data are and , respectively, while the current and power of the proposed optical model are and , respectively. % and % represent the relative errors of the voltage at the maximum power point and the maximum power, respectively.
The relative error is defined as Eq. (8):
where , .
The average error is defined as Eq. (9):
where , ; 9.
Performance is excellent in the core operating range (voltage ≤ 18.40 V), with average error of power and average error of current accuracies reaching 0.43 % and 0.39 %, respectively. Current error is corrected to +0.92 % at 25 °C, and the maximum power point accurately corresponds to 17.5 V. Output is stable in the medium-voltage range with minimal deviation.
4. Parameter test characteristics of monocrystalline silicon solar cells
Based on MATLAB simulation and experiments, the effects of light intensity, temperature and resistance on battery performance are analyzed, revealing the laws of synergistic changes.
4.1. Effect of light intensity () on single crystal silicon solar cells
Set 25 ℃, 1.2, 0.015 Ω to test the variable light intensity output characteristics of the model. Fig. 2 and Fig. 3 show that the I-V curve rises in parallel as a whole; the P-V curve rises as a whole with the increase of light intensity, the power at the maximum power point increases linearly, the voltage increases and the current increases significantly.
In Table 2, the short-circuit current is proportional to the light intensity. When 500 W/m2, the maximum power point voltage is stable between 16.20-16.30 V. Under low-light conditions, the battery’s performance degrades, and the maximum power changes in sync with light intensity.
Fig. 2Effect of S on I-U curve
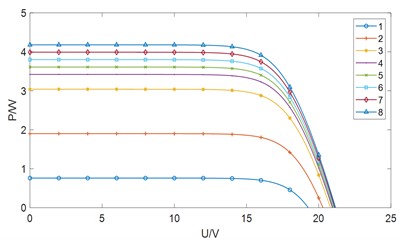
Fig. 3Effect of S on P-U curve
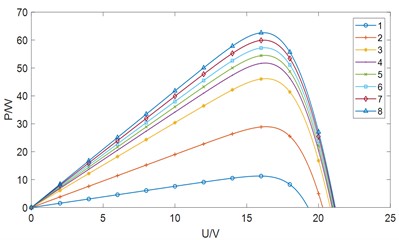
Table 2Variable S parameter data of monocrystalline silicon solar cells
Situation | / W/m2 | / W | / A | / V | / V | / A |
1 | 200 | 11.27 | 0.71 | 15.90 | 19.30 | 0.76 |
2 | 500 | 28.95 | 1.78 | 16.30 | 20.30 | 1.90 |
3 | 800 | 46.18 | 2.83 | 16.30 | 20.80 | 3.04 |
4 | 900 | 51.76 | 3.18 | 16.30 | 20.90 | 3.42 |
5 | 950 | 54.51 | 3.34 | 16.30 | 21.00 | 3.61 |
6 | 1000 | 57.25 | 3.53 | 16.20 | 21.10 | 3.80 |
7 | 1050 | 59.96 | 3.70 | 16.20 | 21.10 | 3.99 |
8 | 1100 | 62.64 | 3.87 | 16.20 | 21.20 | 4.18 |
4.2. Effect of operating temperature () on single crystal silicon solar cells
In Fig. 4 and Fig. 5, the model’s variable temperature output characteristics are tested under conditions of 1000 W/m2, 1.2, and 0.015 Ω. decreases linearly with increasing temperature, increases steadily, and decays linearly. At high temperatures, the I-V curve shifts leftward and flattens, while the P-V curve peak shifts leftward and decreases.
In Table 3, temperature affects photovoltaic performance: open-circuit voltage has a negative temperature characteristic, decreasing rapidly at high temperatures. Maximum power point temperature drift provides a basis for MPPT compensation. Maximum power per unit value decreases, while short-circuit current per unit value increases, in stark contrast to voltage.
Fig. 4Effect of T on I-U curve
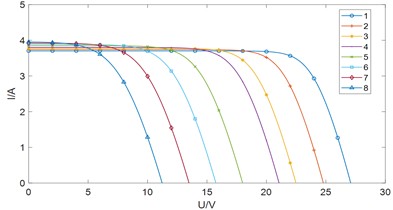
Fig. 5Effect of T on P-U curve
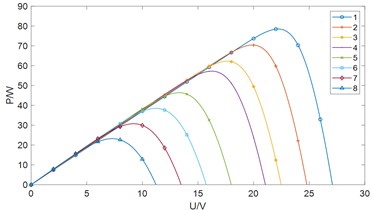
Table 3Variable T parameter data of monocrystalline silicon solar cells
Situation | / ℃ | / W | / A | / V | / V | / A |
1 | –15.5 | 78.51 | 3.54 | 22.20 | 27.10 | 3.70 |
2 | 0.0 | 70.43 | 3.54 | 19.90 | 24.80 | 3.74 |
3 | 15.5 | 62.27 | 3.54 | 17.60 | 22.50 | 3.78 |
4 | 25.0 | 57.25 | 3.53 | 16.20 | 21.10 | 3.80 |
5 | 45.5 | 46.39 | 3.49 | 13.30 | 18.00 | 3.85 |
6 | 60.5 | 38.50 | 3.44 | 11.20 | 15.70 | 3.89 |
7 | 75.5 | 30.74 | 3.34 | 9.20 | 13.50 | 3.92 |
8 | 90.5 | 23.23 | 3.18 | 7.30 | 11.20 | 3.95 |
4.3. Impact of shunt resistance () on monocrystalline silicon solar cells
Tests under conditions of 1000 W/m2, 1.2, and 25 °C. Fig. 6 and Fig. 7 show that low shunt resistance causes the I-V knee to shift forward, significantly reducing and potentially causing localized overheating. The - relationship provides a basis for component grouping, with the impact diminishing when 0.03 Ω.
Fig. 6Effect of Rsh on I-U curve
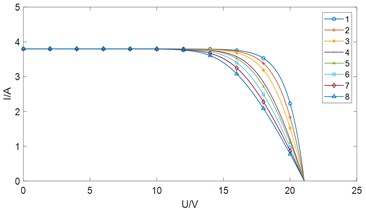
Fig. 7Effect of Rsh on P-U curve
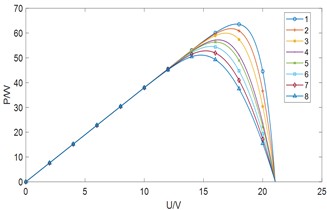
Table 4Rsh parameter data of monocrystalline silicon solar cells
Situation | / Ω | / W | / A | / V | / V | / A |
1 | 0.001 | 63.61 | 3.57 | 17.80 | 21.10 | 3.80 |
2 | 0.005 | 61.77 | 3.57 | 17.30 | 21.10 | 3.80 |
3 | 0.009 | 59.95 | 3.55 | 16.90 | 21.10 | 3.80 |
4 | 0.015 | 57.25 | 3.53 | 16.20 | 21.10 | 3.80 |
5 | 0.017 | 56.35 | 3.52 | 16.00 | 21.10 | 3.80 |
6 | 0.021 | 54.58 | 3.50 | 15.60 | 21.10 | 3.80 |
7 | 0.025 | 52.83 | 3.48 | 15.20 | 21.10 | 3.80 |
8 | 0.029 | 51.10 | 3.45 | 14.80 | 21.10 | 3.80 |
In Table 4, when the bypass resistance decreases within the range of 0.001-0.029 Ω, the maximum power point voltage per unit decreases, the power increases abnormally, and the current increases nonlinearly. This pattern provides a basis for module performance optimization and quality control.
5. Conclusions
A MATLAB-based multi-parameter coupling model overcomes the limitations of single-factor analysis, achieving current and power errors of less than ±0.4 % and ±1 %, respectively. Under strong sunlight, the maximum power point voltage fluctuation is less than 0.6 %. Under low-temperature and weak light conditions, abnormal power gain occurs when 0.015 Ω, while 0.02 Ω is considered a safety threshold. This model effectively supports MPPT compensation and safety assessment.
References
-
C. Y. Chen, “Research on measurement method for electrical performance of photovoltaic cells with indoor light conditions (in Chinese),” (in Chinese), Metrology and Measurement Technique, Vol. 51, No. 3, pp. 32–35, 2024, https://doi.org/10.15988/j.cnki.1004-6941.2024.3.009
-
H. P. Wang et al., “Modeling and simulation of photovoltaic cells based on MATLAB/Simulink (in Chinese),” (in Chinese), Modern Industrial Economy and Informatization, Vol. 14, No. 3, pp. 91–93, 2024, https://doi.org/10.16525/j.cnki.14-1362/n.2024.03.030
-
N. Yahyaoui, S. Mansouri, A. G. Al-Sehemi, A. Dere, A. Al-Ghamdi, and F. Yakuphanoglu, “Electrical characterization of silicon PV – cell: modeling,” Applied Physics A, Vol. 130, No. 6, p. 379, May 2024, https://doi.org/10.1007/s00339-024-07523-6
-
M. D. Wang and R. J. Zhao, “Practicable approaches to predicting PV array model parameters and I-U characteristics based on datasheet (in Chinese),” (in Chinese), Renewable Energy Resources, Vol. 30, No. 3, pp. 102–107, 2012, https://doi.org/10.13941/j.cnki.21-1469/tk.2012.03.027
-
R. Q. Nafil, H. T. Khamees, and M. S. Majeed, “Identification the internal parameters for mono-crystalline solar module using Matlab-simulation and experimental ascertainment,” TELKOMNIKA (Telecommunication Computing Electronics and Control), Vol. 19, No. 3, p. 716, Jun. 2021, https://doi.org/10.12928/telkomnika.v19i3.16239
-
X. Peng, L. Yang, E. Gavanski, K. Gurley, and D. Prevatt, “A comparison of methods to estimate peak wind loads on buildings,” Journal of Wind Engineering and Industrial Aerodynamics, Vol. 126, pp. 1–23, Mar. 2014, https://doi.org/10.1016/j.jweia.2013.12.013
-
F. Rizzo, M. Barbato, and V. Sepe, “Shape dependence of wind pressure peak factor statistics in hyperbolic paraboloid roofs,” Journal of Building Engineering, Vol. 44, p. 103203, Dec. 2021, https://doi.org/10.1016/j.jobe.2021.103203
-
A. Hasan, “Comparative analysis of solar cell parameter extraction methods using experimental and simulated data,” Renewable Energy, Vol. 189, pp. 436–449, 2022.
-
J. Liu and X. Wu, “Evaluation of photovoltaic model accuracy under variable environmental conditions,” Solar Energy, Vol. 240, pp. 446–458, 2023.
About this article

This work is partially supported by 2025 Special Project on University-Enterprise Collaboration for “Industrial Empowerment” under the Regional Collaborative Innovation Plan of Weinan Normal University (2025QY-CY-YY02). Weinan Normal University’s 2025 University-level College Student Innovation Training Program (25XK044). Shaanxi Provincial Sports Bureau Project (20250081; 20250104). 2025 Shaanxi Province College Student Innovation Project (S202510723035). 2025 Higher Education Reform Research Project of Weinan Normal University (GJ202503); 2025 Think Tank Consultancy Special Project of Regional Collaborative Innovation Program of Weinan Normal University (2025QY-ZZ-ZD01).
The datasets generated during and/or analyzed during the current study are available from the corresponding author on reasonable request.
The authors declare that they have no conflict of interest.
