Abstract
Decentralized multi-agent systems based on swarm intelligence offer inherent advantages in scalability and redundancy over centralized architectures. However, quantitative characterization of fault tolerance remains insufficiently studied. This paper presents a systematic experimental investigation of swarm degradation under controlled agent removal scenarios using a Reynolds-type flocking model with density-adaptive force modulation, implemented in Python 3.11 and subjected to progressive failure rates of 10 %-50 %. Three fault tolerance metrics are proposed: the Graceful Degradation Index (), Network Connectivity Ratio (NCR), and Mission Completion Robustness (MCR). Both deterministic () and stochastic Weibull-based () failure models are evaluated across four redundancy levels (1.0-2.0) with 30 replications per cell. One-way ANOVA confirms statistically significant degradation effects (1570.4, < 0.001, 0.917). The adaptive algorithm achieves MCR = 0.5 versus MCR = 0.3 for the baseline, maintaining GDI > 1.0 across all failure rates tested. These findings provide the first quantitative engineering-specification-style fault tolerance thresholds for Reynolds-type swarm coordination.
1. Introduction
The deployment of autonomous robotic swarms for industrial and environmental tasks – including warehouse logistics, infrastructure inspection, area surveillance, and multi-robot search tasks – has increased significantly in recent years [1], [2], [12], [13]. A critical engineering requirement for such systems is fault tolerance: the ability to sustain mission objectives when individual agents fail due to hardware malfunction, energy depletion, or environmental hazards.
Prior work has focused on binary availability metrics [4], topology resilience [5], and formal stability frameworks [6], with redundancy provisioning established as a key fault tolerance driver [14]. However, no study provides explicit engineering-specification-style thresholds for Reynolds-type coordination [8] under stochastic failure regimes.
This paper addresses the gap by: (i) proposing three quantitative fault tolerance metrics (GDI, NCR, MCR) grounded in network reliability theory [9] and queuing theory [10]; (ii) introducing a stochastic Weibull failure model alongside deterministic batch removal; (iii) conducting a full redundancy-level analysis; and (iv) providing statistically validated results via ANOVA and Kruskal-Wallis tests. To the best of our knowledge, this paper presents the first engineering-specification-style fault tolerance thresholds for Reynolds-type swarm coordination, directly applicable to deployment planning and system certification.
2. Mathematical framework
2.1. Agent dynamics model
Each agent in a swarm of agents is governed by a discrete-time velocity update rule based on three local interaction forces [8]:
where , , and are the separation, alignment, and cohesion steering vectors computed from neighbors within visual range = 60 units; , , , are scalar weight coefficients. In the adaptive variant, weights are modulated by a local density stress index :
where 0.5 is the adaptation coefficient and = 10 is the saturation parameter [7].
2.2. Fault tolerance metrics
Three complementary metrics quantify swarm resilience. The Graceful Degradation Index (GDI) measures how proportionally throughput decreases relative to agent loss:
where is baseline throughput (). GDI = 1.0 indicates proportional degradation; GDI > 1.0 super-linear resilience; GDI < 1.0 cascading collapse. The Network Connectivity Ratio () quantifies the largest connected component of the proximity graph :
The Mission Completion Robustness (MCR) is the maximum failure rate sustaining at least 50 % nominal throughput [9]:
3. Experimental methodology
3.1. Simulation platform
Experiments used a custom discrete-time multi-agent simulation engine implemented in Python 3.11 (NumPy, NetworkX). The environment is a bounded 800 × 600-unit 2D space with reflective boundary conditions, a base station at (0, 300), and 10 fixed resource nodes in the right half (). Each simulation runs for 180 s (0.1 s). The first 30 s constitute a steady-state warm-up with no failures; failure events occur exclusively in the evaluation window [, ]. Agents execute a foraging task: collect resources (radius 15 units) and return them to base. Throughput is the mean resource delivery rate over the evaluation window. Failed agents are removed atomically from all data structures, modeling worst-case total agent loss.
3.2. Failure models
Model F1 (deterministic): fraction of agents removed simultaneously at , selected uniformly at random. Model (stochastic): agent lifetimes , calibrated so that the expected fraction failed by matches target :
Shape covers infant-mortality, random, and wear-out failure regimes.
3.3. Experimental design
The factorial design is 2×6×4×4 (algorithms × failure rates × redundancy levels shapes), with 30 replications per cell (~5,760 runs total). Redundancy ratio , tested at (). Sample size is justified by ×Power ( = 0.05, 0.06, power ≥ 0.80). Table 1 summarizes key parameters.
Table 1Simulation parameters
Parameter | Value | Units / Note |
Environment size ( | 800×600 | units |
Time step | 0.1 | s |
Total simulation time | 180 | s |
Warm-up period | 30 | s |
Visual range | 60 | units |
Collection radius | 15 | units |
Reynolds weights (, , ) | 1.5, 1.0, 1.0 | – |
Adaptation coefficient | 0.5 | – |
Saturation parameter | 10 | agents |
Failure rates | 0.0-0.5 step 0.1 | fraction |
Weibull shapes | 0.8, 1.0, 1.5, 2.0 | – |
Redundancy levels | 1.0, 1.25, 1.5, 2.0 | – |
Agent counts | 50, 62, 75, 100 | agents |
Replications per cell | 30 | independent seeds |
3.4. Statistical analysis
Normality was assessed with the Shapiro-Wilk test; 10 of 12 groups satisfied normality ( 0.05). Variance homogeneity was confirmed by Levene’s test for the adaptive algorithm ( 0.304). One-way ANOVA was applied as the primary test; the Kruskal-Wallis (KW) test served as a non-parametric corroboration. Effect sizes are reported as (ANOVA) and (KW), computed as:
Post-hoc comparisons used Tukey HSD (parametric) and Dunn's test with Bonferroni correction (non-parametric). All reported means include 95 % bootstrap confidence intervals (10,000 resamples). The two-way ANOVA tested the algorithm × failure-rate interaction. Statistical significance threshold: 0.001.
4. Results
4.1. Effect of failure rate on throughput
One-way ANOVA revealed a statistically significant and large effect of failure rate on throughput for both algorithms. For the baseline: 1570.4, 0.001, 0.917 (failure rate accounts for 91.7 % of throughput variance). For the adaptive algorithm: 720.7, 0.001, 0.835. KW tests corroborated these results ( 0.922 and 0.845, respectively; both 0.001). Post-hoc Tukey HSD confirmed that every adjacent pair of failure-rate levels differs significantly ( 0.001), establishing a continuous, monotonic degradation signal (Fig. 1). Two-way ANOVA confirmed a significant algorithm × failure-rate interaction: 36.35, 0.001, = 0.017.
Fig. 1Throughput degradation under progressive agent failure with 95 % CI ribbons
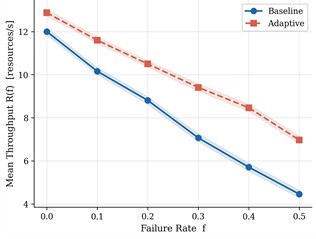
a) Throughput degradation
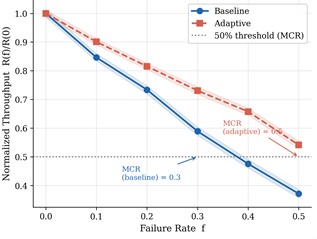
b) Throughput (normalized to R(0))
4.2. Graceful degradation index (GDI)
The baseline model exhibits cascading degradation: declines from 1.000 at 0 to 0.743 [95 % CI: 0.715, 0.772] at 0.5, indicating 25.7 % excess throughput loss beyond proportional expectations (Fig. 2). In contrast, the adaptive algorithm maintains GDI > 1.0 at all non-zero failure rates, reaching a peak of 1.096 [95 % CI: 1.075, 1.117] at 0.4 – demonstrating super-linear compensation through density-driven reorganization. Redundancy analysis (Fig. 2(b)) shows 1.5 is required to keep GDI > 0.80 across all tested failure rates for the baseline algorithm.
4.3. Network connectivity and mission completion robustness
Both algorithms cross the fragmentation threshold NCR = 0.80 at 0.3 (NCR drops to 0.778 [0.769, 0.786] for baseline; 0.775 [0.768, 0.783] for adaptive), indicating identical topological vulnerability regardless of coordination rule (Fig. 3). MCR = 0.3 for the baseline (viable up to 30 % agent loss) versus MCR = 0.5 for the adaptive algorithm (viable up to 50 % loss). MCR for the baseline saturates at 0.3 regardless of redundancy level; for the adaptive, MCR increases from 0.3 ( 1.0) to 0.5 ( 1.5), confirming synergy between redundancy provisioning and adaptive coordination.
Fig. 2Comparison of GDI metrics
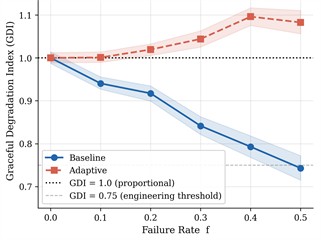
a) GDI vs failure rate
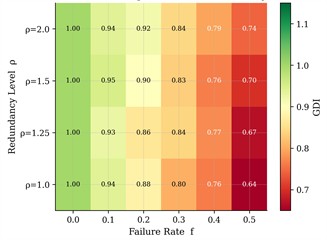
b) GDI heatmap across redundancy levels (baseline)
Fig. 3Evaluation of NCR performance
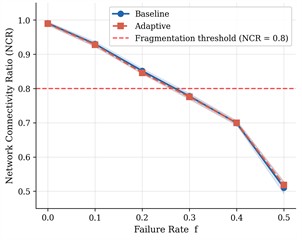
a) NCR vs failure rate
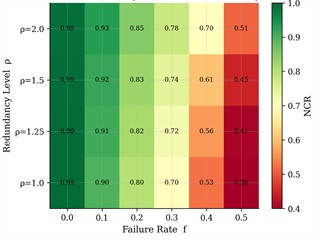
b) NCR heatmap across redundancy levels
4.4. Stochastic failure structure (Model F2)
KW tests on the effect of Weibull shape at 0.3 yielded 11.1, 0.011 (baseline, 0.070, medium effect) and 21.9, 0.001 (adaptive, 0.163, large effect). For the adaptive algorithm, early-concentrated failures ( 0.8) produce mean throughput of 8.86 res/s versus 9.82 res/s for wear-out failures ( 2.0) – a 10.8 % differential attributable solely to failure timing. This result is undetectable by deterministic models and constitutes a novel empirical finding: deployment planning must account for the anticipated failure time distribution, not only its expected rate.
5. Discussion
The baseline Reynolds model operates in a sub-proportional degradation regime (GDI < 1.0), consistent with loss of algebraic connectivity: as agents are removed, the Fiedler value of the proximity graph Laplacian decreases sharply, causing spatial coverage gaps that cascade into throughput collapse [6].
The adaptive algorithm’s GDI > 1.0 regime demonstrates that density-driven spatial redistribution compensates for agent loss – up to a saturation point near 50 agents ( 1.0), consistent with mean-field swarm theory predictions [6]. The NCR analysis reveals that network fragmentation at 0.3 is geometrically determined and algorithm-independent, analogous to the percolation threshold in random geometric graphs [5].
Expressed as an engineering specification analogous to IEC 61508 Safety Integrity Levels, the adaptive swarm at 1.5 achieves MCR = 0.5: operational viability ( ≥ 0.5·) is guaranteed under any failure scenario affecting up to 50 % of the fleet, consistent with the redundancy-driven fault tolerance principle [14]. This is, to our knowledge, the first formulation of a swarm fault tolerance criterion in the style of a deployable engineering specification.
The stochastic analysis demonstrates that failure timing structure has a statistically large and practically meaningful effect on outcomes ( 0.163), analogous to burst-error effects in communication networks [11]. Swarms deployed in infant-mortality failure environments ( 1.0) require 1.75 to achieve the same mission reliability as wear-out environments ( 1.5) at 1.5. Limitations include a 2D homogeneous environment, independent failure assumption, and single-objective task; hardware validation and correlated failure models are planned for future work.
6. Conclusions
This study provides three quantitative contributions to swarm fault tolerance engineering. First, GDI, NCR, and MCR constitute a reusable metric framework – grounded in network reliability and queuing theory – applicable to any multi-agent coordination algorithm. Second, the adaptive density-responsive algorithm achieves MCR = 0.5 versus MCR = 0.3 for the baseline Reynolds model, with GDI > 1.0 maintained across all tested failure rates; a redundancy ratio 1.5 combined with adaptive coordination is the minimum configuration for mission viability over the full 0-50 % failure range. Third, failure temporal structure (Weibull shape k) significantly affects outcomes ( 0.163, large effect), a finding unreachable by deterministic batch-removal experiments and directly actionable for deployment planning. These results provide the first engineering-specification-style fault tolerance thresholds for Reynolds-type swarm coordination.
References
-
E. Bonabeau, M. Dorigo, and G. Theraulaz, Swarm Intelligence: from Natural to Artificial Systems. Oxford, UK: Oxford University Press, 1999.
-
M. Brambilla, E. Ferrante, M. Birattari, and M. Dorigo, “Swarm robotics: a review from the swarm engineering perspective,” Swarm Intelligence, Vol. 7, No. 1, pp. 1–41, 2013, https://doi.org/10.1007/s11721-012-0075-2
-
R. Olfati-Saber, “Flocking for multi-agent dynamic systems: algorithms and theory,” IEEE Transactions on Automatic Control, Vol. 51, No. 3, pp. 401–420, 2006, https://doi.org/10.1109/tac.2005.864190
-
T. Vicsek, A. Czirók, E. Ben-Jacob, I. Cohen, and O. Shochet, “Novel type of phase transition in a system of self-driven particles,” Physical Review Letters, Vol. 75, No. 6, pp. 1226–1229, 1995, https://doi.org/10.1103/physrevlett.75.1226
-
M. Penrose, “Random geometric graphs,” Physical Review, Vol. 66, No. 1, 2003, https://doi.org/10.1103/physreve.66.016121
-
H. Hamann, Swarm Robotics: a Formal Approach. Cham: Springer International Publishing, 2018, https://doi.org/10.1007/978-3-319-74528-2
-
V. Gazi, B. Fidan, Y. S. Hanay, and I. Koksal, “Aggregation, foraging, and formation control of swarms with non-holonomic agents,” Turkish Journal of Electrical Engineering and Computer Sciences, Vol. 15, No. 2, pp. 149–168, 2007.
-
C. W. Reynolds, “Flocks, herds and schools: a distributed behavioral model,” ACM SIGGRAPH Computer Graphics, Vol. 21, No. 4, pp. 25–34, 1987, https://doi.org/10.1145/37402.37406
-
C. J. Colbourn, The Combinatorics of Network Reliability. Oxford, UK: Oxford University Press, 1987.
-
L. Kleinrock, Queueing Systems. New York, USA: Wiley, 1975.
-
J. P. G. Sterbenz et al., “Resilience and survivability in communication networks: strategies, principles, and survey of disciplines,” Computer Networks, Vol. 54, No. 8, pp. 1245–1265, 2010, https://doi.org/10.1016/j.comnet.2010.03.005
-
M. Senanayake, I. Senthooran, J. C. Barca, H. Chung, J. Kamruzzaman, and M. Murshed, “Search and tracking algorithms for swarms of robots: a survey,” Robotics and Autonomous Systems, Vol. 75, pp. 422–434, 2016, https://doi.org/10.1016/j.robot.2015.08.010
-
E. Debie, K. Kasmarik, and M. Garratt, “Swarm Robotics: a survey from a multi-tasking perspective,” ACM Computing Surveys, Vol. 56, No. 2, pp. 1–38, 2024, https://doi.org/10.1145/3611652
-
A. F. T. Winfield and J. Nembrini, “Safety in numbers: fault-tolerance in robot swarms,” International Journal of Modelling, Identification and Control, Vol. 1, No. 1, p. 30, 2006, https://doi.org/10.1504/ijmic.2006.008645
About this article

The authors have not disclosed any funding.
The authors gratefully acknowledge Almaty University of Power Engineering and Telecommunications for providing computational resources.
The datasets generated during and/or analyzed during the current study are available from the corresponding author on reasonable request.
Dr. Yerkebulan Nurgizat, Prof. Nurgul Karymsakova are scientific committee members of the 77th International Conference on Vibroengineering and were not involved in the editorial review and/or the decision to publish this article.

