Abstract
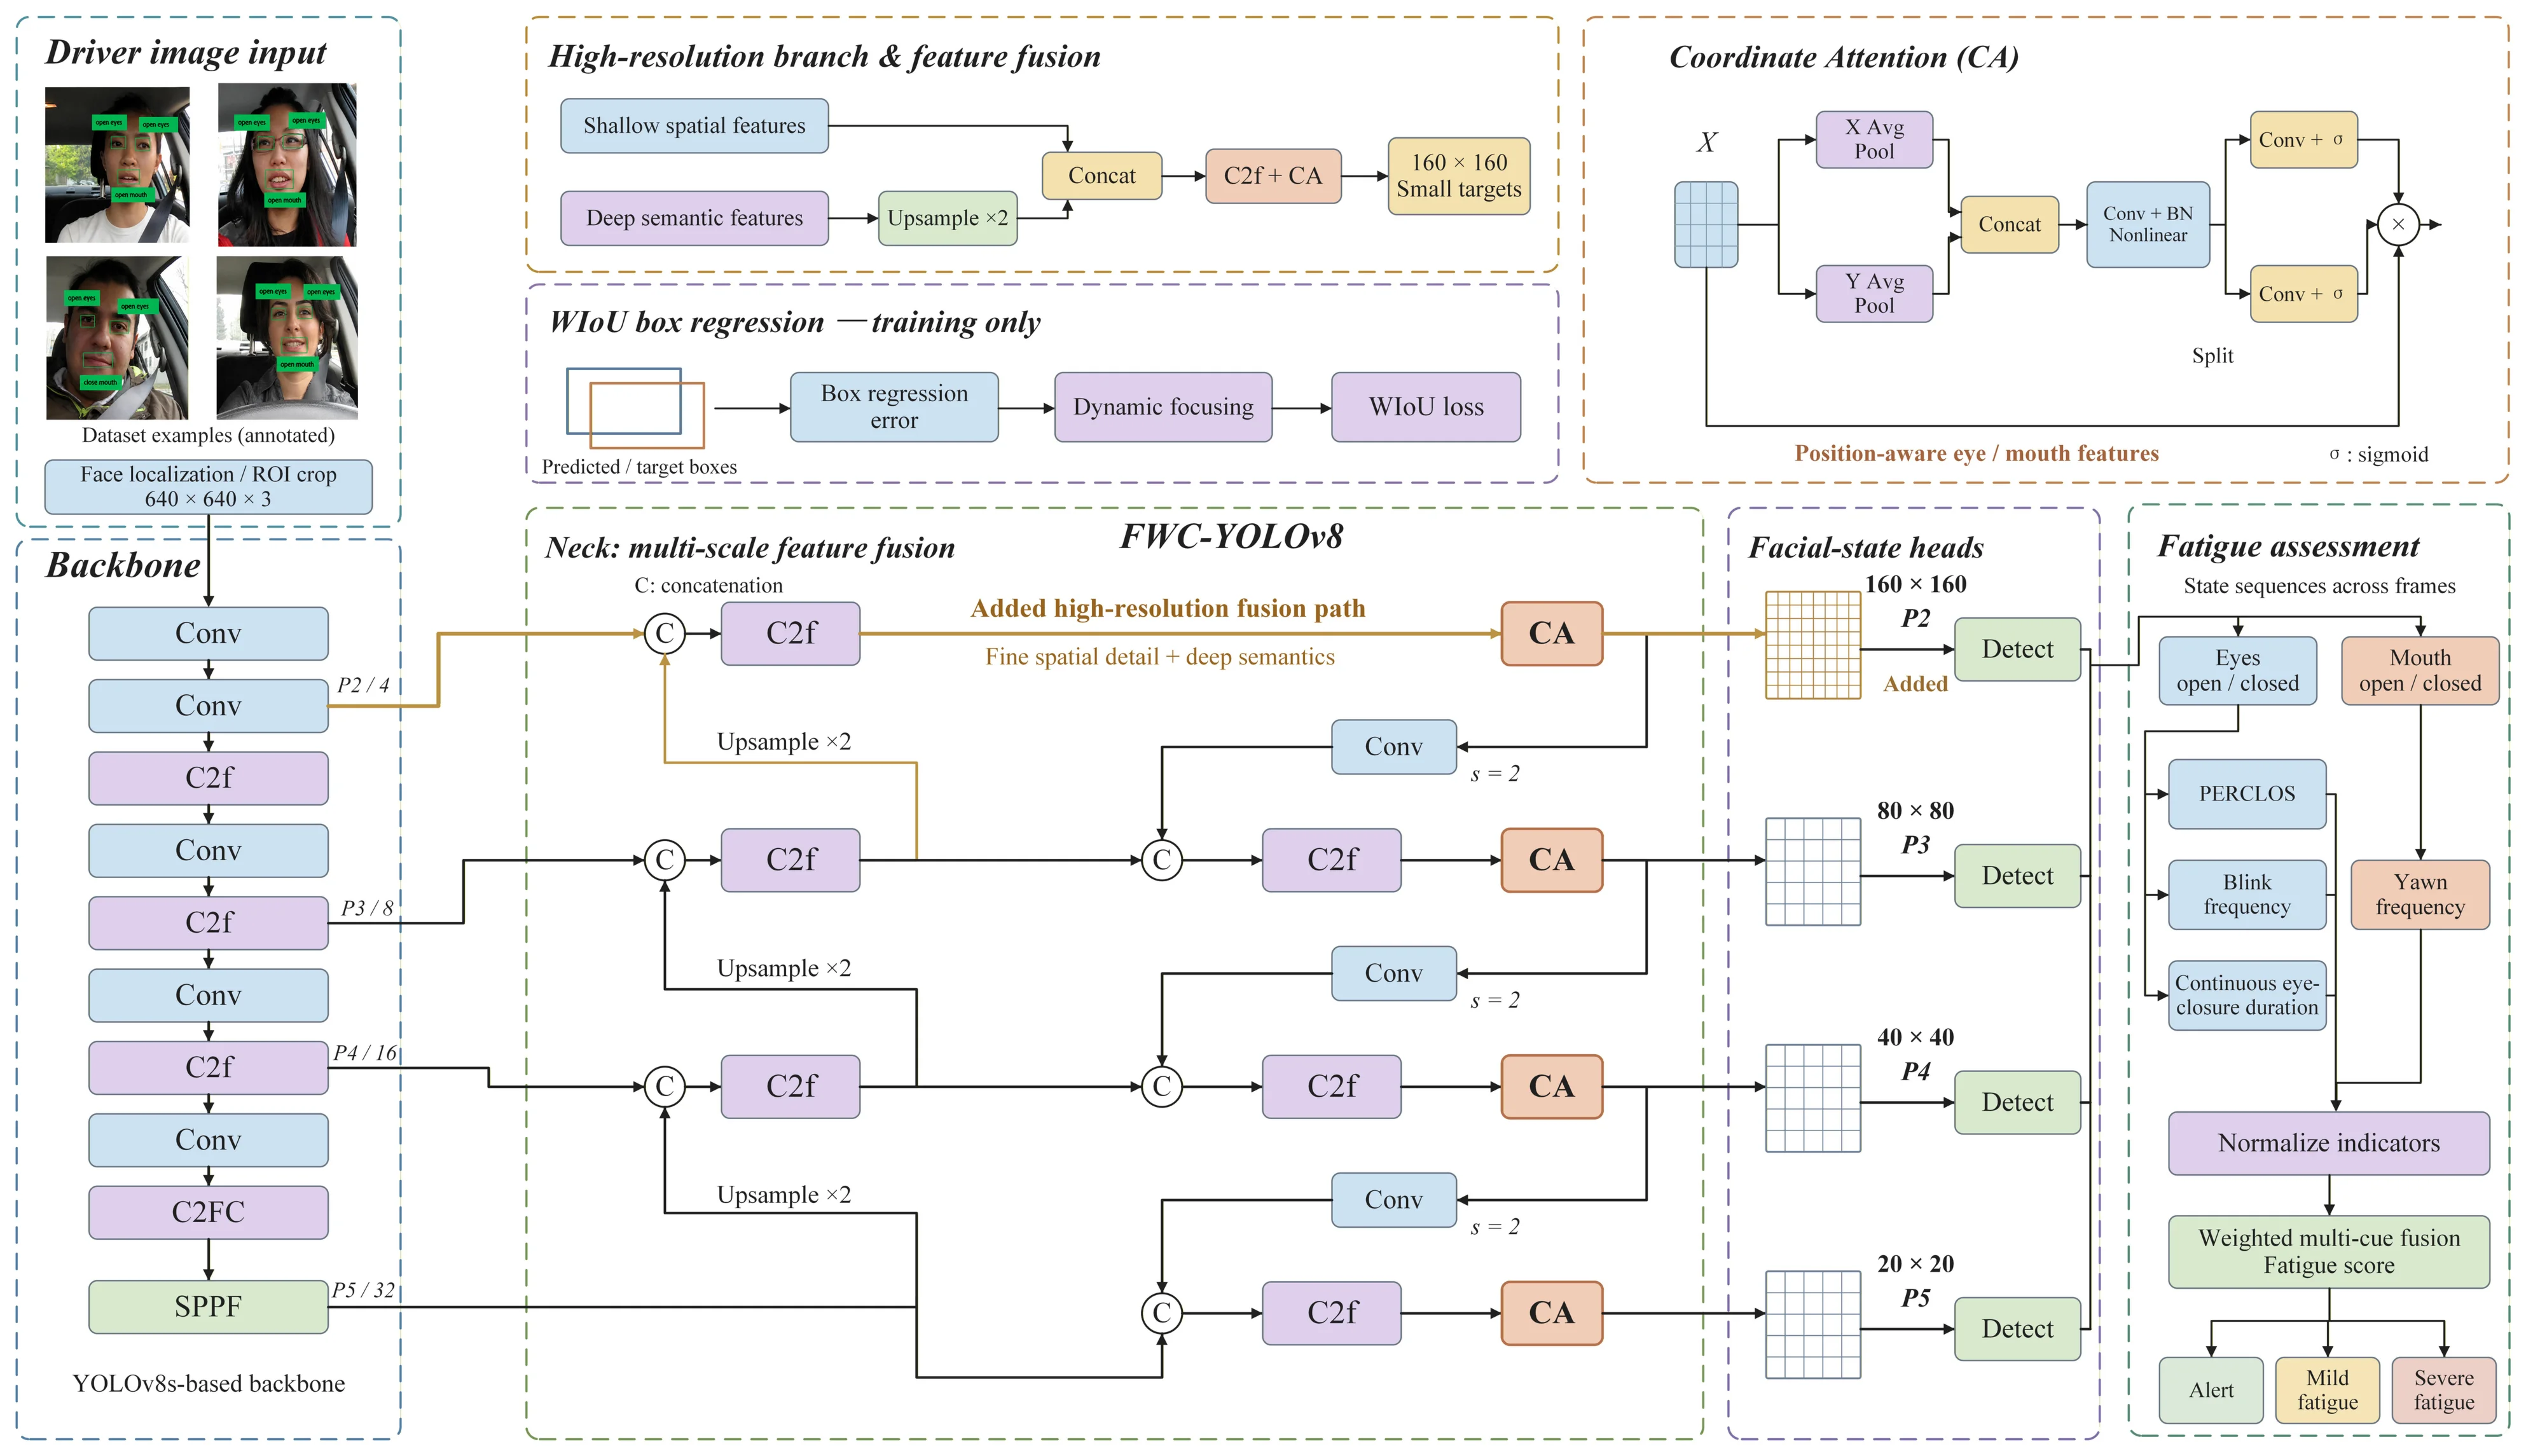
Fatigue-driving detection based on facial cues is challenging because the key fatigue-related regions, especially the eyes and mouth, are small, easily affected by illumination and occlusion, and must be detected in real time. To address insufficient small-target feature extraction and the trade-off between detection accuracy and model complexity, this paper proposes FWC-YOLOv8, an improved fatigue-driving detection framework built on YOLOv8s. First, an additional 160×160 detection head is introduced to preserve high-resolution spatial information and improve localization of small eye and mouth regions. Second, a Coordinate Attention (CA) module is embedded in the backbone to enhance position-aware feature representation. Third, the feature-fusion structure is refined to strengthen the interaction between shallow spatial details and deep semantic information. Finally, Wise-IoU, which uses a dynamic focusing mechanism, is adopted as the bounding-box regression loss to reduce the influence of low-quality samples and improve convergence. Experiments on the GX_FatigueDriving2020 dataset show that FWC-YOLOv8 achieves an mAP@0.50:0.95 of 0.640, corresponding to a 4.2 % improvement over the original YOLOv8s baseline. The model contains 17.0 M parameters and requires 35.5 GFLOPs, indicating a favorable balance between accuracy and computational cost. In addition, detected eye and mouth states are further converted into four fatigue indicators, namely PERCLOS, blink frequency, continuous eye-closure duration, and yawn frequency, and fused through a weighted multi-index assessment strategy to classify driver fatigue into alert, mild-fatigue, and severe-fatigue states. The framework combines task-specific facial-state detection with interpretable fatigue-level assessment.
Highlights
- FWC-YOLOv8 introduces a 160 × 160 detection branch that fuses shallow spatial details with deep semantic features for small eye and mouth targets.
- Coordinate attention and Wise-IoU refine position-aware feature extraction and bounding-box regression for facial-state detection.
- On GX_FatigueDriving2020, FWC-YOLOv8 achieves an mAP@0.50:0.95 of 0.640, representing a 7.02% relative improvement over YOLOv8s.
- Weighted fusion of PERCLOS, blink frequency, continuous eye-closure duration, and yawn frequency classifies driver states as alert, mildly fatigued, or severely fatigued.
1. Introduction
1.1. Research background and significance
With rapid socioeconomic development and continued growth in vehicle ownership and driver populations, road traffic safety faces increasingly severe challenges. Traffic accidents have not only increased in number but also become more complex and diverse, making them a major global public-safety concern. The World Health Organization has emphasized the substantial health burden caused by road traffic injuries, highlighting the urgent need to strengthen traffic-safety management and accident-prevention technologies.
Among the many factors that affect road safety, driver-related factors are dominant because a driver’s physiological state and behavior directly influence vehicle-control decisions. Fatigue driving is one of the most important risk factors. It threatens not only the driver’s safety but also the lives and property of other road users. Therefore, accurate fatigue-driving detection and early warning are essential for improving traffic safety and reducing crash risk.
1.2. Research status
Existing driver-fatigue detection methods can be broadly classified into three categories: physiological-signal-based methods, vehicle-behavior-based methods, and facial-feature-recognition methods.
1.2.1. Physiological-signal-based fatigue detection
Physiological-signal-based methods identify fatigue by monitoring variations in electroencephalogram (EEG), electrocardiogram (ECG), electromyogram (EMG), and other physiological signals under fatigued conditions. Wang et al. evaluated EEG-based fatigue classification in a real driving environment using a wavelet scattering network [2]. Lees et al. investigated psychophysiological responses during monotonous driving and analyzed fatigue and sleepiness in train and non-professional drivers, providing driver-safety implications [3].
With the development of wearable sensing devices, increasing attention has been paid to combining physiological signals, such as electroencephalogram (EEG), electrooculogram (EOG), electrodermal activity (EDA), EMG, and ECG, with machine-learning algorithms. Shi and Wang investigated fatigue driving detection using time-space-frequency features from multimodal signals [4]. Li et al. developed a hybrid ensemble CNN framework for driver-fatigue recognition from EEG data [5]. Zhou et al. studied EEG fatigue-driving detection using functional brain-network features and machine-learning classifiers [6]. Gong et al. integrated pulse-wave and skin-conductance signals and established a fatigue-state database to achieve efficient fatigue detection [7].
Although physiological-signal-based methods can achieve high recognition accuracy, they usually require wearable sensors. This requirement increases user discomfort, introduces individual-dependence problems, and limits their feasibility for long-term in-vehicle deployment.
1.2.2. Vehicle-behavior-based fatigue detection
When a driver becomes fatigued, vehicle-control behaviors, including steering-wheel operation, grip, pedal input, and speed regulation, may change. Li et al. assessed fatigue from steering-wheel grip force [8]. Satti et al. developed an EMG-based system using steering-wheel grip for drowsiness detection [9]. Babusiak et al. proposed a smart steering wheel for unobtrusive health and drowsiness monitoring [10]. Houshmand et al. combined EEG signals with vehicle-dynamics data to identify moderate drowsiness [11]. Li et al. further used an LSTM network to extract fatigue-related features from steering-angle sequences, thereby improving detection accuracy [12].
Vehicle-behavior-based methods are non-intrusive and low cost. However, their performance is sensitive to road conditions, vehicle dynamics, and individual driving styles, which can reduce recognition stability under complex driving conditions.
1.2.3. Facial-feature-recognition-based fatigue detection
Facial behaviors associated with fatigue, such as blinking and yawning, provide intuitive visual cues and have become an active research direction. Bai et al. developed a two-stream spatial-temporal graph convolutional network that uses facial landmarks for driver-drowsiness detection [13]. Albadawi et al. used visual eye, mouth, and head-pose features for real-time driver-drowsiness detection [14]. Majeed et al. proposed a deep convolutional neural-network model that uses facial cues, including mouth behavior, for driver-drowsiness detection [15].
Deep-learning methods have recently been widely applied to this task. Florez et al. developed a real-time embedded system that combines convolutional neural networks with eye and mouth analysis [16]. Nomura et al. investigated the use of FaceMesh landmarks to reduce the effect of face orientation in drowsiness estimation [17]. Adhinata et al. integrated deep learning with traditional machine-learning methods to improve detection speed and robustness [18].
Facial-feature-recognition methods are non-contact and suitable for integration into intelligent driving systems. Nevertheless, their accuracy is easily affected by illumination variation, facial occlusion, camera viewpoint, and image quality. These challenges are especially prominent for small facial targets such as the eyes and mouth, where missed detections and false detections remain common. Consequently, fatigue-detection models require stronger small-target representation, robustness, and real-time inference capability.
1.2.4. Summary
In summary, current fatigue-driving detection technologies mainly follow three technical routes: physiological-signal analysis, vehicle-behavior analysis, and facial-feature recognition. Physiological-signal methods infer fatigue from EEG, ECG, EMG, and related signals. Although they can provide high recognition accuracy, their reliance on additional sensors may interfere with the driver and restrict practical deployment. Vehicle-behavior methods infer fatigue from steering-wheel angle, vehicle speed, pedal operation, lane deviation, and other dynamic indicators. These methods are non-contact and inexpensive, but their stability and generalization are limited by road conditions, vehicle type, and driving style. In contrast, facial-feature-recognition methods have attracted increasing attention because they are non-intrusive, efficient, and suitable for real-time monitoring. However, their practical performance is still constrained by lighting changes, occlusion, head-pose variation, and the difficulty of detecting small targets such as the eyes and mouth. A comparison of the principal characteristics of these three approaches is provided in Table 1.
Table 1Comparison of fatigue-detection methods
Detection method | Detection principle or characteristic variable | Advantages | Limitations |
Physiological-signal-based method | Electroencephalogram (EEG), Electrocardiogram (ECG), Electromyogram (EMG), Electrodermal Activity, etc. signals | High detection accuracy and clear physiological changes | Requires sensors, is inconvenient for long-term use, and is highly dependent on individual differences |
Vehicle-behavior-based method | Steering-wheel angle, vehicle speed, accelerator/brake operation, lane deviation, etc. | Non-contact, low cost, and does not interfere with driving | Strongly affected by road and vehicle conditions; stability and robustness are limited |
Facial-feature-recognition method | Blink frequency, yawning, eye closure, head pose, mouth opening/closure, etc. | Non-contact, easy to integrate into in-vehicle systems, and flexible in application | Sensitive to occlusion, illumination, and camera viewpoint; generalization still needs improvement |
The YOLO (You Only Look Once) series provides a lightweight one-stage detection framework with high inference speed and competitive accuracy [19]. Recent research has shown that YOLOv8 provides a practical baseline for image- and video-based object detection when trained on task-specific data [20]. Contemporary work has further developed scalable multi-scale real-time detectors, while recent reviews document the evolution and application of YOLO-based models [21, 22].
On this basis, this paper proposes FWC-YOLOv8 for driver fatigue detection. The method is not a simple stacking of existing modules; rather, it redesigns the detection scale, attention-enhanced feature extraction, multi-scale feature fusion, and bounding-box regression loss around the small facial targets that are most relevant to fatigue. These improvements are then coupled with a weighted multi-feature fatigue-assessment strategy to convert detected eye and mouth states into interpretable fatigue levels.
The main contributions of this work are as follows: (1) a four-scale detection structure is designed for fatigue-related small targets by adding a 160×160 detection head; (2) CA is introduced into the backbone to improve position-aware representation of the eyes and mouth; (3) WIoU is adopted to reduce the influence of low-quality bounding boxes and improve regression quality; and (4) a weighted multi-feature fatigue-assessment strategy is developed to fuse PERCLOS, blink frequency, continuous eye-closure duration, and yawn frequency for interpretable fatigue-level classification.
Specifically, the proposed feature-fusion optimization introduces an additional 160×160 detection branch into the multi-scale pathway, in which high-resolution spatial cues are integrated with semantically enriched features obtained through upsampling prior to small-target prediction. By preserving fine-grained spatial information while enhancing semantic discrimination, this modification improves the representation of small facial targets.
2. Principle and improvement of the YOLOv8-based facial-feature detection algorithm for fatigue driving
The preceding review shows that facial-feature-recognition-based fatigue detection has become a major research direction because it is non-contact and efficient. However, the eyes and mouth occupy only a small proportion of driver images and are easily affected by occlusion, illumination changes, and head-pose variation in complex driving environments. Accurate real-time detection of these fine-grained regions is therefore challenging. To meet the dual requirements of accuracy and real-time performance, this paper uses YOLOv8s as the baseline and improves its network structure and loss function for fatigue-related small-target detection.
2.1. Principle of YOLOv8 algorithm
YOLOv8 is a recent implementation in the YOLO family that follows a single-stage, end-to-end detection framework and has been used for task-specific object detection [20]. It includes multiple model scales, namely YOLOv8n, YOLOv8s, YOLOv8m, YOLOv8l, and YOLOv8x, to support different computational budgets and application scenarios. This study adopts YOLOv8s because it offers an appropriate balance between model size and detection accuracy for vehicle-mounted fatigue-detection tasks.
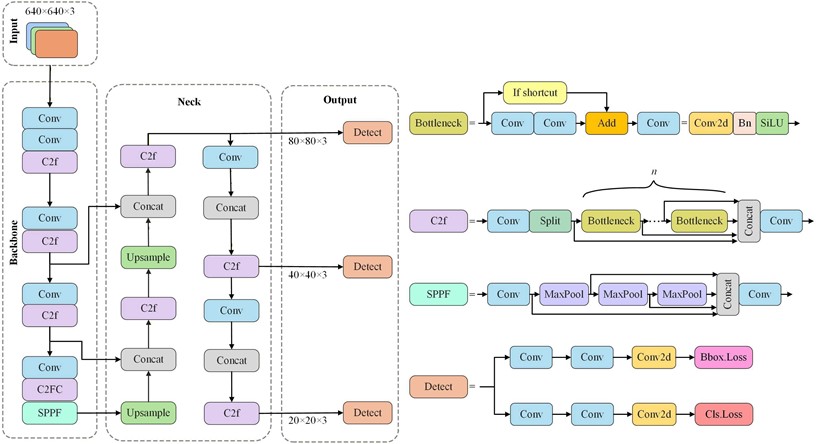
YOLOv8 consists of four main components: the input module, backbone network, feature-fusion neck, and detection head. Its architecture is shown in Fig. 1.
1) Input module.
The input module standardizes images, resizes them, and applies data augmentation. Augmentation strategies such as Mosaic, MixUp, and HSV color perturbation improve robustness under diverse driving scenarios [20]. YOLOv8 is also compatible with mainstream datasets and annotation formats such as COCO and VOC, which facilitates model training and deployment.
2) Backbone network.
The backbone network extracts hierarchical image features from low-level textures to high-level semantic representations and is central to detection performance. YOLOv8 adopts the efficient C2f module, which improves gradient flow while controlling the number of parameters and enhancing feature representation and convergence [20].
3) Feature-fusion neck.
The neck combines a Feature Pyramid Network (FPN) and a Path Aggregation Network (PAN) to fuse multi-scale features through top-down and bottom-up information propagation. This design integrates high-level semantic information with low-level spatial details, which is particularly important for small-target detection. YOLOv8 also adopts the C2f structure in the neck to improve overall efficiency.
4) Detection head.
YOLOv8 uses a decoupled detection head that separates classification and regression tasks, allowing each task to learn more focused representations. Its anchor-free mechanism predicts object centers and bounding-box boundaries adaptively from image content, improving prediction flexibility and simplifying training.
Fig. 1Architecture of the YOLOv8 network
2.2. Improvement strategies for FWC-YOLOv8
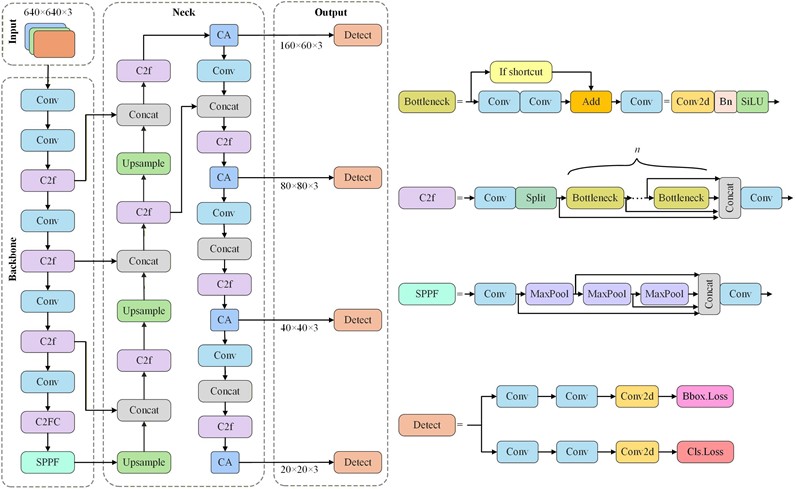
To improve YOLOv8s in small facial-feature detection for fatigue driving, this study constructs FWC-YOLOv8 through four targeted modifications, as shown in Fig. 2. The improvements focus on small-object detection, attention-guided feature extraction, multi-scale feature fusion, and regression-loss optimization.
1) Detection-head optimization.
The original YOLOv8s uses three detection heads corresponding to different feature-map scales. Because fatigue-related targets such as the eyes and mouth are small, an additional 160×160 detection head is introduced. The resulting four-scale detection structure (160×160, 80×80, 40×40, and 20×20) improves coverage of small targets and enhances localization accuracy.
2) Coordinate attention mechanism.
To strengthen spatial-position modeling, the CA module is embedded in the backbone network. CA encodes inter-channel relationships and long-range spatial dependencies simultaneously, enabling the network to focus more effectively on fatigue-related regions such as the eyes and mouth. This improves target localization and feature representation for small facial cues [23].
3) Regression-loss optimization.
The bounding-box regression loss is replaced with Wise-IoU (WIoU), which uses a dynamic focusing strategy intended to reduce the influence of low-quality samples and improve regression quality in object detection; its integration with YOLOv8 has been examined in recent journal work [24]. In the classification branch, class-balanced weighting is used to mitigate imbalance among fatigue-feature categories and improve overall detection performance.
Fig. 2Architecture of the improved YOLOv8s network
2.3. Algorithm improvement design
Based on YOLOv8s, FWC-YOLOv8 optimizes the detection head, introduces the CA module, refines feature fusion, and replaces the original regression loss with WIoU. The input image size is 640 x 640, and the four detection heads operate at 160×160, 80×80, 40×40, and 20×20. The additional high-resolution detection head preserves fine spatial details for small eye and mouth regions, while CA enhances position-aware feature extraction. The optimized feature-fusion structure then integrates information from more feature layers, allowing shallow spatial details and deep semantic features to contribute jointly to fatigue-cue detection.
2.3.1. Model structure optimization
In fatigue-driving detection, the eyes and mouth occupy a small proportion of the image, so the network must retain sufficient spatial detail to locate and classify these regions accurately. Adding a 160×160 detection head allows the model to preserve higher-resolution features and improves its ability to detect small targets. Compared with the three-head structure of the original YOLOv8s, the four-head structure provides broader multi-scale coverage. A comparative experiment was conducted using the same training and validation protocol as the YOLOv8s baseline. As shown in Table 2, the added small-object detection layer increases mAP@0.50 by 2.1 % and mAP@0.50:0.95 by 2.4 %. Although GFLOPs increase, the number of parameters decreases slightly, indicating that the added head improves small-target accuracy while maintaining an acceptable accuracy-complexity trade-off.
Table 2Effect of adding the small-object detection head
Model | GFLOPs | mAP@0.50 | mAP@0.50-0.95 | Parameters (M) |
YOLOv8s | 26.6 | 0.957 | 0.598 | 17.5 |
YOLOv8s+4P | 35.4 | 0.978 | 0.622 | 16.9 |
2.3.2. Coordinate attention module
Attention mechanisms are widely used to improve model accuracy because they help the network emphasize informative regions and suppress irrelevant background responses. Recent comparative work has examined SE and CBAM as channel-oriented and joint channel-spatial attention mechanisms, respectively [25]. Attention-based feature learning has also been applied to driver-fatigue detection [26]. Although these attention mechanisms can improve feature extraction, they do not necessarily preserve spatial coordinate information explicitly. In fatigue detection, subtle movements of the eyes and mouth, such as blinking and yawning, are critical for determining fatigue level. Therefore, target position, shape, and orientation contain important information. This study introduces CA to address the limited spatial-coordinate modeling of conventional attention mechanisms in fatigue-driving detection.
CA explicitly encodes coordinate information through horizontal and vertical pooling operations on the feature map. This design helps the model learn the shape and orientation patterns of the eyes and mouth more effectively. By capturing long-range dependencies while preserving positional information, CA enhances the spatial representation capability of the network and improves the detection of small fatigue-related facial targets.
Fig. 3Comparison of the SE, CBAM, and CA attention mechanisms
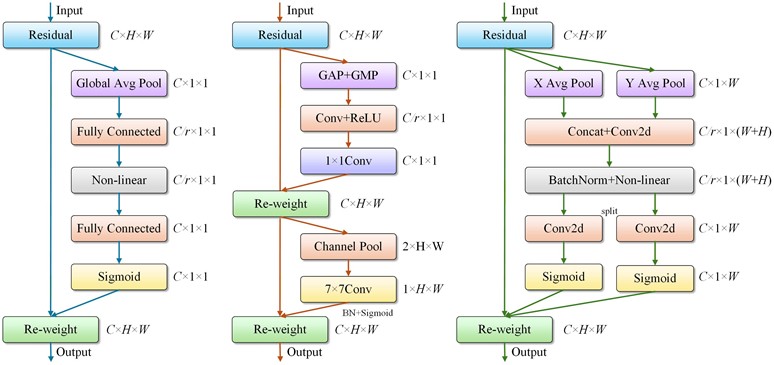
In Fig. 3 show the SE, CBAM, and CA structures, respectively.
First, the feature map in is used as the input, where denotes the number of channels and and denote the height and width of the feature map, respectively. Coordinate information is encoded through horizontal and vertical average-pooling operations.
Horizontal pooling:
Vertical Pooling:
where and denote the feature maps encoded in the horizontal and vertical directions, respectively.
The encoded coordinate information is then recalibrated through two parallel 1×1 convolution layers to learn channel dependencies.
Horizontal feature re-calibration:
Vertical feature re-calibration:
where the corresponding term denotes the activation function.
The recalibrated horizontal and vertical features are then fused through concatenation and a softmax operation.
Feature merging:
Softmax operation:
where the generated terms denote the attention weights.
Finally, the attention weights are multiplied by the input feature map to obtain the CA-enhanced output feature map :
The CA mechanism integrates spatial coordinate information and improves the spatial representation of feature maps. This advantage is particularly useful for small facial regions such as the eyes and mouth, where subtle changes in eye opening and mouth shape determine fatigue cues. After adding CA, the model size increases only slightly, while detection accuracy improves by 2.1 %.
2.3.3. Improvement of loss function
The loss function guides learning and optimization in object-detection models. In YOLOv8s, classification loss is calculated using binary cross-entropy (BCE), while bounding-box regression is optimized using Distribution Focal Loss (DFL) and CIoU loss. CIoU evaluates the overlap between predicted and ground-truth boxes while considering aspect ratio and center-point distance. However, CIoU can be less effective under large scale variation, rotated target appearance, and abnormal low-quality labels. These limitations may reduce regression quality in complex driving scenes. Therefore, this paper introduces Wise-IoU (WIoU) as the bounding-box regression loss.
First, the IoU between the ground-truth box and the predicted box is calculated as follows:
where and denote the predicted and ground-truth bounding boxes, respectively. The intersection area is their overlap, and the union area is the total area covered by both boxes.
The distance between the center of the ground-truth box and the center of the predicted box is then calculated as follows:
where denotes the center of the predicted box, and denotes the center of the ground-truth box. and are the width and height of the smallest enclosing rectangle containing both boxes.
The double-layer attention term is then calculated from the base IoU attention and the distance attention :
where the monotonic focusing coefficient is introduced to reduce the contribution of easily identifiable samples:
where is the exponential moving average of the loss, and gamma controls the focusing strength.
Finally, a dynamic non-monotonic focusing hyperparameter is introduced to reduce the influence of abnormal low-quality bounding boxes:
where is dynamically adjusted according to the anomaly degree beta of the predicted box, as follows:
The anomaly degree beta is calculated as follows:
where and are focusing-control hyperparameters and are usually set to 1.9 and 3.0, respectively.
WIoU is more complex than CIoU because it introduces additional weighting and focusing terms, and its hyperparameters require experimental adjustment. However, on the same dataset, WIoU avoids calculating aspect ratios for a large number of bounding boxes. The ablation results in Table 3 show an improvement in mAP@0.50:0.95 after CIoU is replaced with WIoU.
3. Experimental results and analysis
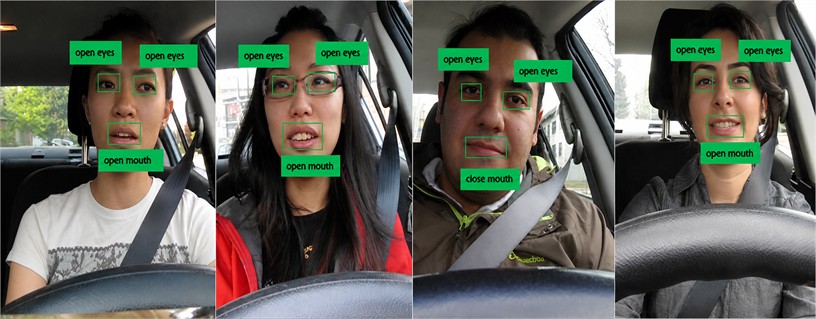
All experiments were conducted on the GX_FatigueDriving2020 dataset. The dataset was divided into a training set of 6,000 images and a validation set of 700 images. It comprises images collected from public online sources, most of which were captured by in-vehicle cameras positioned near the driver’s seat (Fig. 4). The dataset also contains challenging samples, including drivers wearing sunglasses or ordinary glasses. The annotated categories are open_eyes, close_eyes, open_mouth, and close_mouth.
The experimental software environment was Python 3.8.10, PyTorch 2.0.1, and CUDA 11.6. The hardware platform included an NVIDIA GeForce RTX 2080 Ti GPU and an Intel Xeon E5-2678 v3 CPU at 2.50 GHz. To ensure fair comparison, all model variants were trained and evaluated under the same experimental settings, and the initial learning rate was set to 0.01.
The evaluation metrics were mAP@0.50:0.95, GFLOPs, and model parameters. mAP@0.50:0.95 represents the mean average precision averaged over IoU thresholds from 0.50 to 0.95. GFLOPs measures computational complexity, and model parameters indicate model size.
Ablation experiments were performed to evaluate the contribution of the small-object detection layer, CA module, and WIoU loss to eye and mouth detection. The reported quantitative evaluation focuses on the ablation experiments for the proposed components. Qualitative inference results on the same image were used to visualize the differences among model variants.
Fig. 4Examples from the GX_FatigueDriving2020 dataset
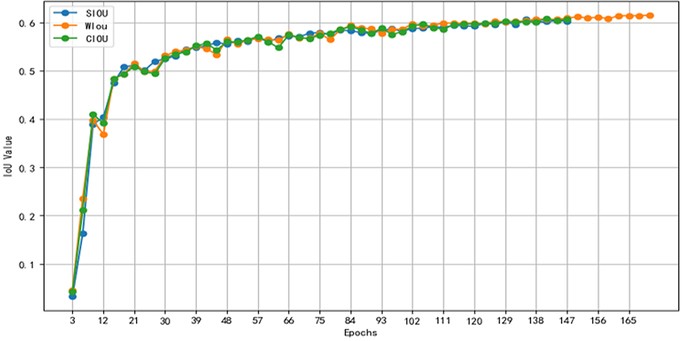
To verify the contribution of each optimization module, ablation experiments were conducted against the original YOLOv8s baseline, and the results are shown in Table 3. Adding CA produces YOLOv8s+CA and improves mAP@0.50:0.95 by 2.1 %, with only a 0.5 % increase in parameters and no increase in GFLOPs. Adding the small-object detection head produces YOLOv8s+4P and improves mAP@0.50:0.95 by 2.4 %, although GFLOPs increase because of the additional high-resolution detection branch. Replacing CIoU with WIoU increases mAP@0.50:0.95 by 1.6 percentage points because WIoU reduces the influence of low-quality samples. Fig. 5 shows the IoU convergence curves of CIoU, SIoU, and WIoU. The final mAP@0.50:0.95 values of CIoU, SIoU, and WIoU are reported in Table 3 as 0.598, 0.606, and 0.614, respectively. The complete FWC-YOLOv8 model achieves the best overall result, with an mAP@0.50:0.95 of 0.640, 17.0 M parameters, and 35.5 GFLOPs.
Fig. 5IoU convergence comparison of different regression loss functions
4. Multi-feature fatigue-driving detection and application algorithm design
The improved YOLOv8s-based network extracts four driver facial-state categories: open eyes, closed eyes, open mouth, and closed mouth. These detected states are then converted into fatigue indicators according to fatigue-state theory and fused to determine the final driver-fatigue level.
Table 3Ablation results for the proposed FWC-YOLOv8 components
Model | mAP@0.50-0.95 | Parameter(M) | GFLOPs |
YOLOv8s | 0.598 | 17.5 | 26.6 |
YOLOv8s+WIoU | 0.614 | 17.5 | 26.6 |
YOLOv8s+SIOU | 0.606 | 17.5 | 26.6 |
YOLOv8s+CA | 0.619 | 17.6 | 26.6 |
YOLOv8s+4P | 0.622 | 16.9 | 35.4 |
Proposed Method | 0.640 | 17.0 | 35.5 |
4.1. Eye state characteristics
Eye-state characteristics are among the most intuitive indicators of driver fatigue. After the facial-state detection model outputs the open or closed state of the eyes, fatigue features are quantified using PERCLOS, blink frequency, and continuous eye-closure duration within a unit time . To update these features in real time, the algorithm defines a fixed-length queue to store eye states within . The length of equals the total number of frames in the unit time window. Open eyes are recorded as 0, and closed eyes are recorded as 1.
4.1.1. PERCLOS
PERCLOS is a widely used indicator for evaluating driving fatigue. It is defined as the proportion of time during which the eyes remain closed within a specified time interval. A recent evidence review describes PERCLOS as an established technology for drowsiness detection and notes its relevance to fatigue monitoring [27].
The proposed algorithm calculates PERCLOS as the ratio of closed-eye frames to total frames within a 25-s interval:
where denotes the unit time window of 25 s, and fps denotes the video frame rate.
4.1.2. Blinking frequency
Blinking is a normal physiological behavior, and the blink pattern of an alert driver generally remains relatively stable. Under fatigue, however, changes in ocular dryness and alertness may alter blinking behavior. Contemporary vision-based driver-monitoring systems therefore use closed-eye and blink events as fatigue-related cues [28]. In the state sequence (), one complete blink is represented by a transition from ‘0’ to ‘1’ and then back to ‘0’. By counting the number of complete blink transitions within a given time interval, the blink frequency can be calculated as follows:
where Blink denotes blink frequency, and denotes the number of blinks within the unit time .
4.1.3. Duration of continuous eye closure
When a driver is fatigued, the duration of eye closure increases significantly. Under normal driving conditions, drivers instinctively avoid long eye-closure events for safety reasons; therefore, continuous eye closure indicates a high-risk driving state, regardless of whether other fatigue cues are present [29]. The algorithm defines as the duration for which the eyes remain continuously closed:
where denotes the frame at which the eye state in queue changes from open to closed, and ne denotes the frame at which it changes from closed to open.
Studies show that alert drivers typically blink 20-30 times per minute, and each eye-closure event usually lasts 0.2-0.3 s. Based on these physiological characteristics, the fatigue-determination rules are defined in Table 4.
Table 4Rules for determining driver fatigue status
Fatigue level | PERCLOS | Blink | |
Sober | ≤ 0.21 | ≤ 0.45 | ≤ 1 |
Mild fatigue | > 0.21 and ≤ 0.45 | > 0.45 and ≤ 0.8 | > 1 and ≤ 2 |
Severe fatigue | > 0.45 | > 0.8 | > 2 |
4.2. Lip state characteristics
Yawning is another important fatigue-related behavior. It increases oxygen intake through deep inhalation and is often associated with reduced alertness. Contemporary visual drowsiness systems commonly incorporate yawn frequency together with eye-closure information [30]. Therefore, yawn frequency is included in the fatigue-evaluation index system. Under normal conditions, the mouth is usually closed. Although speaking or smiling may also open the mouth, the opening degree is generally smaller than that during yawning. To simplify calculation, non-yawning mouth movements are classified as the closed-mouth state in this algorithm. A yawn is defined as a continuous mouth-open event lasting more than 2 s. Similar to blink-frequency calculation, a fixed-length queue is used to track mouth states. The yawn frequency within a unit time is calculated as follows:
where denotes the number of yawns within a unit time, and denotes yawn frequency per unit time.
The fatigue-determination rule for yawn frequency within the unit time is as follows:
4.3. Fusion of fatigue characteristics
Fatigue driving is reflected by multiple behavioral cues, including prolonged eye closure and increased yawning frequency. Although eye-state indicators are strongly associated with fatigue [31], their reliability may be affected by sunglasses, camera vibration, illumination variation, and individual differences. A single indicator is therefore insufficient for robust fatigue assessment. To improve accuracy and robustness, this algorithm adopts a multi-feature fusion strategy that integrates complementary fatigue cues.
All fatigue indicators are normalized to the range [0, 1] to ensure a consistent measurement scale. Each indicator is then assigned a weight according to its correlation with fatigue severity. PERCLOS is assigned a weight of 1.00 because it is widely recognized as a core fatigue indicator. Blink frequency is assigned a weight of 0.35 because it is easily affected by external factors and individual differences. Continuous eye closure is assigned a weight of 0.85 because long eye-closure events are highly dangerous during driving. Yawn frequency is assigned a weight of 0.65 because it is more visually indicative of fatigue than ordinary blinking. The weights are shown in Table 5.
Table 5Weights assigned to fatigue indicators
Feature weight | PERCLOS | Blink frequency | Continuous eye closure | Yawn frequency |
Weight | 1.00 | 0.35 | 0.85 | 0.65 |
The weighted fatigue value is calculated as follows:
where denotes the weighted fatigue value obtained by integrating multiple indicators, denotes a fatigue indicator, and denotes the corresponding feature weight. Based on , the driver state is classified into three levels: alert, mild fatigue, and severe fatigue. The alert state is defined as < 0.35, mild fatigue as 0.35 ≤ ≤ 0.85, and severe fatigue as > 0.85.
4.4. Fatigue detection algorithm flow
The fatigue-detection process is shown in Fig. 6.
Fig. 6Flowchart of the fatigue-detection algorithm
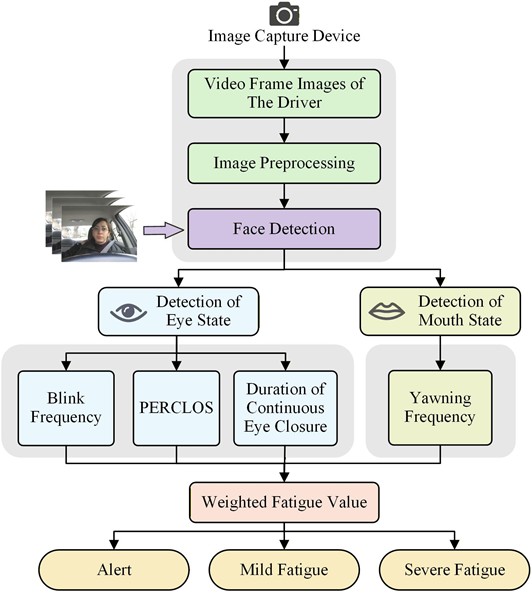
First, driver video frames are collected using an in-vehicle camera and preprocessed. To reduce false detections caused by directly detecting small targets such as the eyes and mouth in the full image, an improved face-detection model is used to locate the driver’s face. The cropped face region is then input into FWC-YOLOv8 to detect eye and mouth states. Four fatigue indicators are extracted from these states and fused using the weighted-average strategy. Finally, the weighted fatigue value is used to classify the driver state into alert, mild fatigue, or severe fatigue, and different warning measures are triggered according to the fatigue level.
5. Conclusions
This paper proposes FWC-YOLOv8, a task-oriented redesign of YOLOv8s for fatigue-driving detection. The main work of this study is not simply to combine several existing modules, but to reconstruct the YOLOv8s detection process according to the specific characteristics of fatigue-related small facial targets. Compared with the original YOLOv8s, FWC-YOLOv8 improves the detection scale, enhances position-aware feature extraction, refines multi-scale feature fusion, and replaces CIoU with WIoU for more robust bounding-box regression. The improved network accurately extracts eye and mouth states, including open eyes, closed eyes, open mouth, and closed mouth, which provide the basis for identifying key fatigue behaviors.
In the backbone, the CA module captures spatial positional information and channel dependencies more effectively, thereby improving feature representation for fatigue-related facial targets. The optimized feature-fusion structure introduces more feature layers into the fusion process, enhancing the complementarity between shallow spatial details and deep semantic information.
In the detection head, an additional high-resolution branch is added to improve detection of small eye and mouth targets. With an input size of 640×640, the four output scales are 160×160, 80×80, 40×40, and 20×20, enabling the network to detect targets at different scales more effectively.
For bounding-box regression, WIoU introduces a dynamic focusing mechanism that reduces the influence of low-quality samples. Although WIoU is structurally more complex than CIoU and requires hyperparameter adjustment, the ablation results in Table 3 show that it improves mAP@0.50:0.95 relative to CIoU.
The ablation experiments further verify that each redesign contributes to performance improvement. The additional small-target detection head improves the representation of fine-grained eye and mouth regions; the CA module strengthens spatially aware feature extraction; WIoU improves regression robustness by reducing the influence of low-quality samples; and the optimized feature-fusion structure improves the use of shallow and deep features. With these task-specific changes, FWC-YOLOv8 increases mAP@0.50:0.95 to 0.640 while maintaining an acceptable model size and computational cost.
Beyond the detector itself, this study designs a multi-feature fatigue-assessment strategy that integrates PERCLOS, blink frequency, continuous eye-closure duration, and yawn frequency. By normalizing these indicators and assigning feature weights, the algorithm converts frame-level eye and mouth detections into driver-state categories, namely alert, mild fatigue, and severe fatigue. This detector-plus-assessment design clarifies the practical contribution of the work: FWC-YOLOv8 is used not only to detect facial states but also to support interpretable real-time fatigue warning under individual differences and external interference.
This study focuses on algorithmic detection performance and multi-feature fusion, but several limitations remain because of dataset availability. Future work will be carried out in two directions. First, scenarios involving facial occlusion, such as sunglasses and masks, will be further analyzed to improve model generalization. Second, multimodal fusion will be expanded by incorporating driving-behavior data, such as steering-wheel operation and lane deviation, as well as physiological data, to achieve more comprehensive fatigue-behavior detection.
References
-
Z. M. Wang et al., “A review of fatigue driving detection based on EEG signals,” (in Chinese), Journal of Xi’an University of Posts and Telecommunications, Vol. 27, No. 6, pp. 52–66, 2022, https://doi.org/10.13682/j.issn.2095-6533.2022.06.008
-
F. Wang, D. Chen, W. Yao, and R. Fu, “Real driving environment EEG-based detection of driving fatigue using the wavelet scattering network,” Journal of Neuroscience Methods, Vol. 400, p. 109983, Oct. 2023, https://doi.org/10.1016/j.jneumeth.2023.109983
-
T. Lees, T. Chalmers, D. Burton, E. Zilberg, T. Penzel, and S. Lal, “Psychophysiology of monotonous driving, fatigue and sleepiness in train and non-professional drivers: Driver safety implications,” Behavioral Sciences, Vol. 13, No. 10, p. 788, Sep. 2023, https://doi.org/10.3390/bs13100788
-
J. Shi and K. Wang, “Fatigue driving detection method based on time-space-frequency features of multimodal signals,” Biomedical Signal Processing and Control, Vol. 84, p. 104744, Mar. 2023, https://doi.org/10.1016/j.bspc.2023.104744
-
R. Li, R. Gao, and P. N. Suganthan, “A decomposition-based hybrid ensemble CNN framework for driver fatigue recognition,” Information Sciences, Vol. 624, pp. 833–848, Jan. 2023, https://doi.org/10.1016/j.ins.2022.12.088
-
Y. Zhou, C. Zeng, and Z. Mu, “Optimal feature-algorithm combination research for EEG fatigue driving detection based on functional brain network,” IET Biometrics, Vol. 12, No. 2, pp. 65–76, 2023, https://doi.org/10.1049/bme2.12108
-
S. J. Gong, Y. X. Zhao, and D. M. Huang, “Research on fatigue driving detection based on multi-physiological signal fusion,” (in Chinese), Journal of Safety and Environment, Vol. 23, No. 11, pp. 4002–4012, 2023, https://doi.org/10.13637/j.issn.1009-6094.2022.1792
-
R. Li, Y. V. Chen, and L. Zhang, “A method for fatigue detection based on driver’s steering wheel grip,” International Journal of Industrial Ergonomics, Vol. 82, p. 103083, 2021, https://doi.org/10.1016/j.ergon.2021.103083
-
A. T. Satti, J. Kim, E. Yi, H.-Y. Cho, and S. Cho, “Microneedle array electrode-based wearable EMG system for detection of driver drowsiness through steering wheel grip,” Sensors, Vol. 21, No. 15, p. 5091, Jul. 2021, https://doi.org/10.3390/s21155091
-
B. Babusiak, A. Hajducik, S. Medvecky, M. Lukac, and J. Klarak, “Design of smart steering wheel for unobtrusive health and drowsiness monitoring,” Sensors, Vol. 21, No. 16, p. 5285, Aug. 2021, https://doi.org/10.3390/s21165285
-
S. Houshmand, R. Kazemi, and H. Salmanzadeh, “An efficient approach for driver drowsiness detection at moderate drowsiness level based on electroencephalography signal and vehicle dynamics data,” Journal of Medical Signals and Sensors, Vol. 12, No. 4, pp. 294–305, 2023, https://doi.org/10.4103/jmss.jmss_124_21
-
Z. Li, L. Chen, L. Nie, and S. X. Yang, “A novel learning model of driver fatigue features representation for steering wheel angle,” IEEE Transactions on Vehicular Technology, Vol. 71, No. 1, pp. 269–281, Nov. 2021, https://doi.org/10.1109/tvt.2021.3130152
-
J. Bai et al., “Two-stream spatial-temporal graph convolutional networks for driver drowsiness detection,” IEEE Transactions on Cybernetics, Vol. 52, No. 12, pp. 13821–13833, 2021, https://doi.org/10.1109/tcyb.2021.3110813
-
Y. Albadawi, A. Alredhaei, and M. Takruri, “Real-time machine learning-based driver drowsiness detection using visual features,” Journal of Imaging, Vol. 9, No. 5, p. 91, Apr. 2023, https://doi.org/10.3390/jimaging9050091
-
F. Majeed, U. Shafique, M. Safran, S. Alfarhood, and I. Ashraf, “Detection of drowsiness among drivers using novel deep convolutional neural network model,” Sensors, Vol. 23, No. 21, p. 8741, Oct. 2023, https://doi.org/10.3390/s23218741
-
R. Florez, F. Palomino-Quispe, A. B. Alvarez, R. J. Coaquira-Castillo, and J. C. Herrera-Levano, “A real-time embedded system for driver drowsiness detection based on visual analysis of the eyes and mouth using convolutional neural network and mouth aspect ratio,” Sensors, Vol. 24, No. 19, p. 6261, Sep. 2024, https://doi.org/10.3390/s24196261
-
A. Nomura, A. Yoshida, K. Nagumo, and A. Nozawa, “Reducing the effect of face orientation using FaceMesh landmarks in drowsiness estimation based on facial thermal images,” Artificial Life and Robotics, Vol. 30, No. 2, pp. 317–324, Jan. 2025, https://doi.org/10.1007/s10015-024-01001-1
-
F. D. Adhinata, D. P. Rakhmadani, and D. Wijayanto, “Fatigue detection on face image using FaceNet algorithm and K-nearest neighbor classifier,” Journal of Information Systems Engineering and Business Intelligence, Vol. 7, No. 1, p. 22, Apr. 2021, https://doi.org/10.20473/jisebi.7.1.22-30
-
Z. Li et al., “Development and challenges of object detection: A survey,” Neurocomputing, Vol. 598, p. 128102, Jun. 2024, https://doi.org/10.1016/j.neucom.2024.128102
-
F. Hermens, “Automatic object detection for behavioural research using YOLOv8,” Behavior Research Methods, Vol. 56, No. 7, pp. 7307–7330, May 2024, https://doi.org/10.3758/s13428-024-02420-5
-
A. Vijayakumar and S. Vairavasundaram, “YOLO-based object detection models: A review and its applications,” Multimedia Tools and Applications, Vol. 83, No. 35, pp. 83535–83574, Mar. 2024, https://doi.org/10.1007/s11042-024-18872-y
-
C.-Y. Wang, A. Bochkovskiy, and H.-Y. M. Liao, “Scaled-YOLOv4: scaling cross stage partial network,” in 2021 IEEE/CVF Conference on Computer Vision and Pattern Recognition (CVPR), pp. 13024–13033, 2021, https://doi.org/10.1109/cvpr46437.2021.01283
-
Q. Hou, D. Zhou, and J. Feng, “Coordinate attention for efficient mobile network design,” in 2021 IEEE/CVF Conference on Computer Vision and Pattern Recognition (CVPR), pp. 13708–13717, 2021, https://doi.org/10.1109/cvpr46437.2021.01350
-
C. Xiong, T. Zayed, and E. M. Abdelkader, “A novel YOLOv8-GAM-Wise-IoU model for automated detection of bridge surface cracks,” Construction and Building Materials, Vol. 414, p. 135025, Jan. 2024, https://doi.org/10.1016/j.conbuildmat.2024.135025
-
W. Ye, R. Tan, Y. Liu, and C.-C. Chang, “The comparison of attention mechanisms with different embedding modes for performance improvement of fine-grained classification,” IEICE Transactions on Information and Systems, Vol. E106.D, No. 5, pp. 590–600, May 2023, https://doi.org/10.1587/transinf.2022dlp0006
-
S. Fa, X. Yang, S. Han, Z. Feng, and Y. Chen, “Multi-scale spatial-temporal attention graph convolutional networks for driver fatigue detection,” Journal of Visual Communication and Image Representation, Vol. 93, p. 103826, 2023, https://doi.org/10.1016/j.jvcir.2023.103826
-
T. Abe, “PERCLOS-based technologies for detecting drowsiness: Current evidence and future directions,” SLEEP Advances, Vol. 4, No. 1, Jan. 2023, https://doi.org/10.1093/sleepadvances/zpad006
-
M. Irsan, R. Hassan, A. H. Ibrahim, M. K. Hasan, M. C. Lam, and W. M. H. W. Hussain, “A framework for driver drowsiness monitoring using a convolutional neural network and the Internet of Things,” Intelligent Automation and Soft Computing, Vol. 39, No. 2, pp. 157–174, 2024, https://doi.org/10.32604/iasc.2024.042193
-
N. N. Pandey and N. B. Muppalaneni, “A novel algorithmic approach of open eye analysis for drowsiness detection,” International Journal of Information Technology, Vol. 13, No. 6, pp. 2199–2208, Oct. 2021, https://doi.org/10.1007/s41870-021-00811-x
-
A. Turki, O. Kahouli, S. Albadran, M. Ksantini, A. Aloui, and M. B. Amara, “A sophisticated drowsiness detection system via deep transfer learning for real-time scenarios,” AIMS Mathematics, Vol. 9, No. 2, pp. 3211–3234, 2024, https://doi.org/10.3934/math.2024156
-
T. Cui, S. Chen, Y. Ma, and X. Dong, “Investigating the impact of fatigue level on visual attention of heavy-duty truck driver: An eye tracking study,” Journal of Transportation Safety and Security, Vol. 17, No. 2, pp. 208–226, 2024, https://doi.org/10.1080/19439962.2024.2387846
About this article

This research was supported by the following grants: the Science and Technology Program of the Public Security Department of Guangxi Zhuang Autonomous Region (Grant No. GXGAKJJHXM2026002) on “Key Technologies and Application Demonstration for Intelligent Risk Assessment and Control of Key Vehicles Based on Multi-source Data Fusion”; the Guangxi Science and Technology Plan Project (Key Research and Development Program) (Grant No. Guike AB24010143) on “Development and Application of a New Command and Dispatch System Based on AR Live-action Command and Digital Twin Technology”; and the 2025 Annual Research Project of the China-ASEAN (Guangxi) Police Studies Institute (Project No. DMJXZD202501) on “Research on Key Technologies of UAV Visual Perception and Intelligent Handling for China-ASEAN Border Control in Complex Terrain”.
The GX_FatigueDriving2020 dataset is a non-public, author-curated dataset. It comprises images collected from public online sources, most of which were captured by in-vehicle cameras positioned near the driver’s seat. The authors collected, annotated, and curated these images for the present study. The applicable source permissions were reviewed before use, and the use of these images in this study does not involve unresolved personal, institutional, or commercial rights issues. The author portraits were supplied by the respective authors, who authorized their use in this publication. This study did not recruit or directly involve human participants. The remaining data are not publicly available because of confidentiality obligations, third-party restrictions, and/or institutional policies, but may be made available from the corresponding author upon reasonable request and subject to approval.
Hanqing Jian: conceptualization, investigation, writing-original draft preparation, and project administration; Chengzhi Fang: conceptualization, methodology, supervision, writing-review and editing; Yixue Luo: methodology, software, and validation; Heng Li: data curation, formal analysis, and visualization; Lian Wang: conceptualization, supervision, writing-review and editing; Enyong Xu: resources and validation. All authors have read and approved the final manuscript.
The authors declare that they have no conflict of interest.

