Abstract
To investigate the key parameters affecting narrow steel box girders, a Midas FEA model of a 40+60+40 m composite girder bridge was established, analyzing the effects of girder height, plate thickness, U-ribs, diaphragms, and stiffeners on deformation, stress, and buckling. Girder height dominates stiffness, reducing vertical displacement by 25.2 % from 1800 to 2600 mm. Diaphragms mainly improve buckling stability (+234.8 %); combining diaphragms, bottom stiffeners, and web stiffeners raises the critical load factor from 1.92 to 30.20. Buckling failure shifts from web to bottom plate to diaphragm with added reinforcements, suggesting a rational reinforcement sequence.
1. Introduction
Steel box girders are widely used for their light weight, high load-carrying capacity, and large spanning ability. Narrow steel box girders are increasingly adopted in urban bridges for their compact structure and aesthetics, but their special cross-section makes them prone to lateral deformation and local stress concentration, where stability is key to structural safety and economy.
Existing studies have shown: Di et al. [1] revealed the influence of U-rib stiffener thickness on ultimate bearing capacity; Rahbar-Ranji [2] verified numerical methods in predicting natural vibration; Misiak and Stachura [3] analyzed the effect of stiffeners on stability. Kambal et al. [4] validated numerical solutions for modal analysis of box girders; Chen and Miao [5] evaluated fatigue of welded details in orthotropic steel decks; Liu et al. [6] investigated design parameters such as section dimensions and girder height. Others studied the retrofitting of steel structures [7, 8], distortional behavior and diaphragm spacing of box girders [9], and structural optimization of composite girders [10]. However, parametric studies quantifying the coupled effects of multiple reinforcement measures on narrow steel box girders remain limited.
Despite these advances, systematic analysis of the coupled effects of key parameters (plate thickness, stiffeners, width-to-depth ratio) for narrow steel box girders is still insufficient. This paper therefore establishes a Midas FEA model to analyze the above parameters. Unlike existing studies, it quantifies the coupled effects of multiple reinforcement measures, identifies the buckling failure-mode migration (web → bottom plate → diaphragm) and the resulting reinforcement sequence, and distinguishes the roles of diaphragms (buckling resistance) and bottom plate stiffeners (deformation/stress control).
2. Numerical simulation method
2.1. Establishment of the Midas FEA model
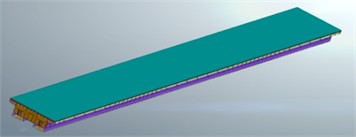
Based on the “Zhuyong Expressway Reconstruction and Expansion Project”, a constant-section narrow steel box composite girder bridge (40+60+40 m) was modeled in Midas FEA. The single steel box girder has a height of 2200 mm, bottom plate width of 2000 mm, plate thicknesses of 16/14/20 mm (top/web/bottom), and longitudinal stiffeners of 12/14/18 mm (Fig. 1). Q345qD steel was modeled as linear elastic ( 206 GPa, 7850 kg/m3, 0.3) using shell elements (SHELL4). The structured mesh (aspect ratio ≤ 1:3, max size 200 mm) contains 366,170 elements and 409,630 nodes (Fig. 2).
Fig. 1Schematic diagram of the narrow steel box girder structure
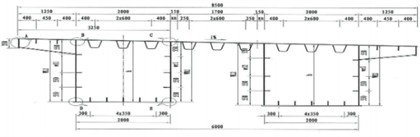
Fig. 2Schematic diagram of the overall model of the narrow steel box girder
2.2. Boundary conditions and load case setup
At the main pier, all translations are constrained ( 0) with rotations released; at the side piers, only vertical translation is constrained ( 0) with rotations free. Loads include self-weight, secondary dead loads (bridge deck), Highway-Grade I vehicle load, and wind load.
Parameter variations are shown in Table 1. The basic model has girder height 2200 mm, bottom plate width 2000 mm, plate thicknesses of 16/14/20 mm (top/web/bottom), 6 U-ribs, and 7 diaphragms spaced at 20 m.
Table 1Load case configuration
Parameter type | Baseline value | Variation value | Remarks |
Girder height / mm | 2200 | 1800, 2600 | – |
Top plate thickness / mm | 16 | 12, 20 | |
Web plate thickness / mm | 14 | 10, 18 | – |
Bottom plate thickness / mm | 20 | 16, 24 | – |
Number of U-ribs | 6 | 3, 9 | longitudinal U-ribs |
Number of diaphragms | 7 (spaced at 20 m) | 0,14 (spaced at 10 m) | |
Number of bottom plate stiffeners | 0 | 3, 5 | Longitudinal stiffeners |
Number of web stiffeners | 0 | 3 | Longitudinal stiffeners |
2.3. Model validation
To validate the shell-element model, the analytical solution for a three-span continuous beam was employed. With 0.4425 m2, 0.3606 m4 and 60.5 kN/m, the three-moment equation gives 16288 kN·m, and the mid-span deflection is = 38.8 mm. The FEA model predicted 38.2 mm (deviation 1.5 %), confirming the model's reliability in capturing global flexural behavior.
3. Data analysis
3.1. Influence of structural parameters on deformation and stress
3.1.1. Girder height and plate thickness
In the basic model, under the most unfavorable combination of dead load, vehicle load and wind load, the deformation and stress contours are shown in Fig. 3. The maximum horizontal and vertical displacements both occur at the mid-span top plate, while the maximum compressive stress occurs at the support bottom plate.
Fig. 3Deformation and stress distribution of the bridge
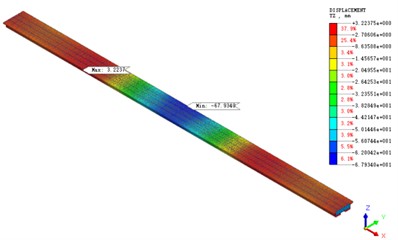
a) Vertical displacement under dead load + vehicle load combination in the typical case
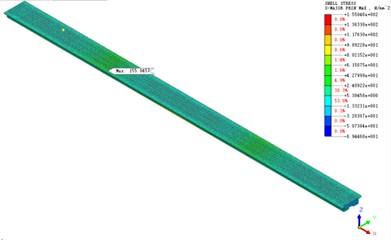
b) Stress under dead load + vehicle load combination in the typical case
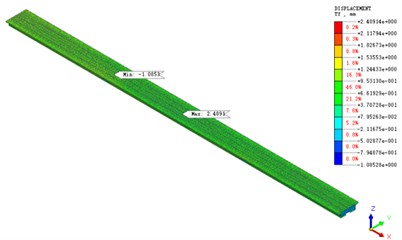
c) Horizontal displacement under wind load in the typical case
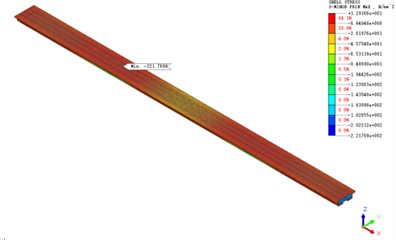
d) Stress distribution under wind load in the typical case
Table 2Influence of girder height and plate thickness on structural deformation and stress
Case group | Maximum vertical displacement /mm | Maximum horizontal displacement /mm | Maximum tensile stress/MPa | Maximum compressive stress/MPa | |
Girder height / mm | 2600 | –60.52 | 3.24 | 163.28 | –228.06 |
2200 | –67.39 | 2.38 | 155.04 | –221.77 | |
1800 | –80.88 | 2.27 | 246.55 | –264.54 | |
Top plate thickness / mm | 20 | –65.68 | 2.35 | 150.08 | 214.86 |
16 | –67.39 | 2.38 | 155.04 | 221.77 | |
12 | –67.67 | 2.39 | 160.05 | 228.70 | |
Web plate thickness / mm | 18 | –67.23 | 1.87 | 150.08 | 214.86 |
14 | –67.39 | 2.38 | 155.04 | 221.77 | |
10 | –67.62 | 2.57 | 160.05 | 228.70 | |
Bottom plate thickness / mm | 24 | –66.73 | 2.38 | 150.08 | 214.86 |
20 | –67.39 | 2.38 | 155.04 | 221.77 | |
16 | –72.28 | 2.38 | 160.05 | 228.70 | |
Table 2 shows the effects of girder height and plate thickness. Increasing the girder height from 1800 to 2600 mm reduces mid-span vertical displacement by 25.2 % (80.88 to 60.52 mm), but raises horizontal displacement from 2.27 to 3.24 mm. Support compressive stress varies non-monotonically, peaking at 1800 mm (264.54 MPa), decreasing to 221.77 MPa at 2200 mm, then rising slightly to 228.06 MPa at 2600 mm.
Variations in top plate and web thickness within ±4 mm change vertical displacement by less than 3 %, while reducing the bottom plate thickness from 20 to 16 mm increases it by 7.3 %. Increasing the web thickness reduces horizontal displacement by 21.4 %, showing the web provides lateral restraint.
3.1.2. Stiffeners and diaphragms
Table 3 summarizes the effects of stiffeners and diaphragms. Varying U-ribs or web stiffeners has negligible effect on vertical displacement, while adding 5 bottom plate stiffeners reduces it by 20.2 % and web stiffeners reduce horizontal displacement by 13.9 %. Increasing the diaphragms from 0 to 14 (spaced at 10 m) changes vertical and horizontal displacement by only –2.7 % and –2.9 %, as the stiffening benefit is largely offset by added self-weight.
For stress control, bottom plate stiffeners are the most effective: 5 stiffeners reduce the maximum compressive stress by 16.5 %. Diaphragms also matter: adding 7 (spaced at 20 m) reduces tensile stress by 11.3 %, and 14 (spaced at 10 m) by 42.4 %.
Table 3Influence of stiffeners and diaphragms on structural deformation and stress
Case group | Maximum vertical displacement /mm | Maximum horizontal displacement / mm | Maximum tensile stress / MPa | Maximum compressive stress / MPa | |
Number of U-ribs | 0 | –67.39 | 2.38 | 155.04 | 221.77 |
3 | –67.39 | 2.38 | 159.79 | 228.28 | |
6 | –67.39 | 2.38 | 163.93 | 236.09 | |
9 | –67.39 | 2.38 | 162.70 | 232.40 | |
Number of diaphragms | 0 | –67.93 | 2.41 | 174.89 | –241.90 |
7 | –67.39 | 2.38 | 155.04 | –221.77 | |
14 | –66.08 | 2.34 | 100.65 | –219.04 | |
Number of bottom plate stiffeners | 0 | –67.39 | 2.38 | 155.04 | 221.77 |
3 | –60.51 | 2.38 | 148.43 | 198.63 | |
5 | –53.76 | 2.35 | 121.01 | 185.27 | |
Number of web stiffeners | 0 | –67.39 | 2.38 | 155.04 | 221.77 |
3 | –63.46 | 2.05 | 154.02 | 219.56 | |
3.2. Structural buckling analysis
The critical load factors were obtained from linear eigenvalue buckling analysis (LBA) in Midas FEA, which solves , where is the critical load factor and [], [] are the elastic and geometric stiffness matrices. The first buckling mode – web panel buckling near the support – agrees with classical plate buckling theory. The basic model gave a critical load factor of 1.92. Among the single measures (Table 4), diaphragms are the most effective (1.92→6.43, +234.8 %), whereas increasing the top plate thickness slightly reduces the factor due to added self-weight.
Combined measures show varied effects: individual factors for diaphragms, web stiffeners, and bottom stiffeners are 6.43, 3.85, and 2.70. Combining diaphragms with bottom stiffeners raises the factor to 12.67, but with web stiffeners gives only 6.96 (+7.6 %); bottom + web stiffeners yield only 4.21. Thus, selecting the right combination is key.
Combining three measures (diaphragms, bottom plate stiffeners, and web stiffeners) raises the critical load factor from 12.67 to 30.20, an increase of 138.6 %. As a linear analysis, LBA ignores initial imperfections and material nonlinearity; the results should be treated as upper-bound estimates.
An efficiency index (stability gain per added steel volume) shows the diaphragm-only scheme as the most efficient (+234.8 % in ), while the three-factor combination ( 30.20) achieves the highest stability at the greatest material cost.
Table 4Critical load factors under different combination conditions
Combination | Critical load factor | Remarks |
Basic model | 1.92 | |
① Diaphragms | 6.43 | Spaced at 10 m |
② Web plate thickness | 2.78 | Thickness increased by 4 mm |
①+② | 6.65 | |
③ Top plate thickness | 1.86 | Thickness increased by 4 mm |
①+③ | 6.24 | |
④ Bottom plate thickness | 2.21 | Thickness increased by 4 mm |
①+④ | 6.56 | |
⑤ Web stiffeners | 3.85 | 3 stiffeners |
①+⑤ | 6.96 | |
⑥ Bottom plate stiffeners | 2.70 | 5 stiffeners |
①+⑥ | 12.67 | |
⑤+⑥ | 4.21 | |
⑦Top plate U-ribs | 1.69 | 9 U-ribs |
①+⑦ | 6.26 | |
①+⑤+⑥ | 30.20 | |
①+⑥+⑦ | 15.57 | |
①+⑤+⑥+⑦ | 36.59 | |
Note: indicates that both a and b are modified simultaneously in the basic model | ||
3.3. Analysis of structural reinforcement sequence
Fig. 4 summarizes the buckling failure modes under the most effective single-, two-, and three-factor reinforcements. In the basic model, buckling occurs at the web near the support, so diaphragms or web stiffeners help. After adding diaphragms, the failure location shifts from the web to the bottom plate near the support, making further web strengthening less effective but bottom plate strengthening highly effective. After strengthening both, the failure location shifts to the diaphragm above the support. The recommended reinforcement sequence is therefore web → bottom plate → diaphragm. No buckling occurs at the top plate or U-ribs because the concrete deck suppresses top plate buckling.
Fig. 4First-order buckling failure under the influence of different reinforcement measures
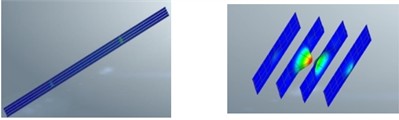
a) Basic model
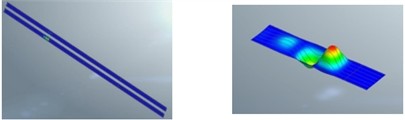
b) After adding diaphragms
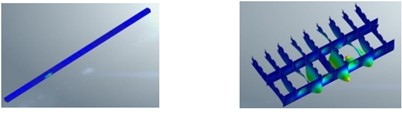
c) After adding diaphragms + bottom plate stiffeners
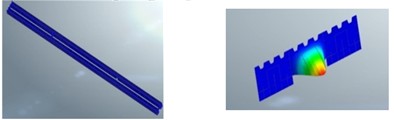
d) After adding diaphragms + bottom plate stiffeners + web stiffeners
4. Conclusions
The following conclusions are based on the analyzed 40+60+40 m continuous bridge and its cross-section.
1) Girder height dominates the overall structural stiffness, reducing vertical displacement but increasing lateral displacement. Variations in top plate and web thickness within ±4 mm change vertical displacement by less than 3 %, whereas reducing the bottom plate thickness from 20 to 16 mm increases it by 7.3 %.
2) Bottom plate stiffeners are effective for deformation and stress control, with 5 stiffeners reducing vertical displacement by 20.2 % and compressive stress by 16.5 %. Diaphragms are indispensable for buckling stability; under service loads they barely affect displacement (–2.7 % vertical, –2.9 % horizontal) but reduce tensile stress significantly (–42.4 %).
3) A rational combination of reinforcement measures greatly enhances stability. Among single measures, diaphragms are the most significant; combining diaphragms with bottom plate and web stiffeners raises the critical load factor from 1.92 to 30.20. The buckling failure location shifts successively from web to bottom plate to diaphragm.
4) This study has limitations: boundary conditions are idealized, initial imperfections and experimental validation are absent, and the material model is simplified. As only one span arrangement and one cross-section were analyzed, the conclusions require further verification for other bridges.
References
-
J. Di, X. H. Zhou, and Z. D. N. Lyu, “Experiment on ultimate bearing capacity of U-stiffened plate of orthotropic steel box girder,” (in Chinese), China Journal of Highway and Transport, Vol. 22, No. 2, pp. 59–64, 2009, https://doi.org/10.19721/j.cnki.1001-7372.2009.02.011
-
A. Rahbar-Ranji, “Modal analysis of a box-shaped girder by numerical method,” Odes’kyi Politechnichnyi Universytet. Pratsi, No. 2, pp. 21–25, 2016, https://doi.org/10.15276/opu.2.49.2016.06
-
J. Misiak and S. Stachura, “The influence of transverse and longitudinal stiffeners on stability of steel plate girder,” Journal of KONES. Powertrain and Transport, Vol. 22, No. 4, pp. 201–210, 2015, https://doi.org/10.5604/12314005.1168473
-
M. E. Mahgoub Kambal, M. Awad, and M. Mohammed Ali, “Nonlinear finite element modelling and parametric study of prestressed steel box girder,” Journal of Karary University for Engineering and Science, Nov. 2021, https://doi.org/10.54388/jkues.v1i1.123
-
R. Chen and C. Miao, “Fatigue performance evaluation for welded details in orthotropic steel deck bridges using multi-scale finite element method,” Structural Durability and Health Monitoring, Vol. 14, No. 3, pp. 205–228, 2020, https://doi.org/10.32604/sdhm.2020.08997
-
J. Liu, G. Xiong, T. Xu, F. Chen, Y. Xiong, and F. Huang, “Intelligent FE modelling and optimization of steel-concrete composite continuous beam bridge,” Engineering Structures, Vol. 337, p. 120568, May 2025, https://doi.org/10.1016/j.engstruct.2025.120568
-
L. Bai, R. Shen, L. Wang, Y. Wang, and R. Miao, “Experimental and numerical study on buckling behavior of a rigidly stiffened plate with tee ribs,” International Journal of Steel Structures, Vol. 18, No. 2, pp. 582–595, Apr. 2018, https://doi.org/10.1007/s13296-018-0013-2
-
F. Kong, R. Bai, J. He, M. Li, and Z. Wang, “Experimental and numerical investigation on mechanical behavior of corrugated steel-concrete composite bridge decks,” Buildings, Vol. 16, No. 2, p. 330, Jan. 2026, https://doi.org/10.3390/buildings16020330
-
J. Lee, H. Kim, K. Lee, and Y.-J. Kang, “Effect of load combinations on distortional behaviors of simple-span steel box girder bridges,” Metals, Vol. 11, No. 8, p. 1238, Aug. 2021, https://doi.org/10.3390/met11081238
-
M. G. Kalibhat and A. Upadhyay, “Optimal design trends for steel-concrete composite girders using genetic algorithms,” Innovative Infrastructure Solutions, Vol. 10, No. 5, p. 192, 2025, https://doi.org/10.1007/s41062-025-01991-2
About this article

The authors have not disclosed any funding.
The datasets generated during and/or analyzed during the current study are available from the corresponding author on reasonable request.
The authors declare that they have no conflict of interest.

