Abstract
Firstly, this paper established a finite element model of the steel bridge and applied movable vehicle loads measured by experiments into the finite element model so that stress and strain distribution characteristics in detail structures of bridges were computed. The change process in the direction of detailed element of diaphragm plate after the shear residual stress was taken into account. Results showed that the direction of its principal tension stress was vertical to the actual crack direction of cracks. To analyze the inner relationship between the internal force of diaphragm plate and local stress amplitude, vehicle loads moved horizontally to record the change trend of principal stress at the arc hole and shear force and bending moment in the cross section. Through making a comparison, this paper found that stress amplitude at the arc hole was mainly affected by shear force and local wheel pressure. Stress amplitude at the arc hole close to diaphragm plate was larger than that at the arc hole close to the middle line, which was easier to crack and consistent with actual damage. Finally, the fatigue life of bridges which took into account the shear residual stress was estimated according to stress and strain to compare with the result which did not take into account the shear stress. Comparison results showed that the shear residual stress had an obvious effect on fatigue life of the steel bridge, so it cannot be neglected during numerical computation.
1. Introduction
Manufacture and assembly of the steel bridge required a lot of technological processing including forging, flame cutting and welding, and the residual stress will be caused in these parts [1-4]. The residual stress was in structures with a balanced status. In general, it was caused by uneven deformation, thermal stress and chemical changes. The residual stress didn’t cause obvious effects on structural strength in general, but it had complex effects on the structural fatigue. Positions with concentrated stress [5-8] often coincided with high residual stress positions. The residual stress will change average stress under loads. When stress from loads has the same direction with residual stress, the stress concentration position will become plastic more quickly and strain can increase rapidly. When they have opposite directions, stress concentration can be relieved.
At present, researches on the impact of residual stress on bridge fatigue life have obtained a lot of achievements. Wang [9] has adopted Gauss heat source model and element with birth and death to dynamically simulate the welding residual stress of thick plates of bridges. The numerically computational results were consistent with the experimental results. However, he has only studied the welding residual stress of bridges, and the impact of the welding residual stress on the fatigue life was neglected. Kuang [10] has conducted humdrum static load experiment and fatigue experiment on two groups of beams which were reinforced by carbon fiber, and results showed that the carbon fiber can improve the fatigue life of bridges effectively. However, the studied process was completed only using experiments. Compared with the numerical simulation, the studied cost of experiments will be high, and the computational efficiency will be also reduced. Ye [11] has conducted a statistical analysis of stress spectra for fatigue life assessment of steel bridges with structural health monitoring data, and a standard daily stress spectrum is derived by statistically analyzing the stress spectra accounting for highway traffic, railway traffic, and typhoon effects. The optimal number of daily strain data for derivation of the standard daily stress spectrum is determined by examining the predominant factors which affect the prediction of fatigue life, but he only used experimental test to study the bridge, which will reduce the efficiency and improve the cost. Aygül [12] has built a finite element model of orthotropic bridge deck to conduct fatigue life assessment. The finite element method is most frequently associated with the application of the structural hot spot stress approach or the effective notch stress approach, rather than the traditional nominal stress approach. The results of the finite element analyses revealed that the structural hot spot stresses obtained from the shell element models were unrealistically high when the welds were omitted. Kwon [13] has used probability density functions of equivalent stress range based on field monitoring data to assess bridge fatigue life.
The reported researches mainly considered the impact of the welding residual stress on fatigue life of bridges, and experiments were the main method which had a high cost and low efficiency. However, a bridge steel structure may have the shear residual stress during manufacture, which should be also taken into account. The paper mainly analyzed effects of the shear residual stress on fatigue life of the deck slab of an orthotropic steel bridge. The shear residual stress was a kind of thermal stress which was caused by uneven heating and cooling during cutting. Specific distribution of the shear residual stress was influenced by many factors including thermo-physical performance, dynamic performance of materials, heat source and energy density. The shear residual stress was brought into a diaphragm plate sub-model. Influence of the initial residual stress on average stress was taken into account, and fatigue life at a hole of the diaphragm plate was re-computed.
2. Dynamic stress analysis on the bridge structure
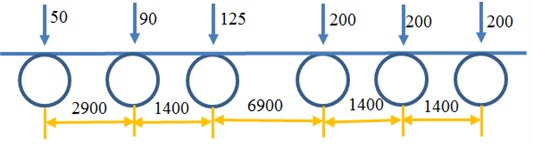
A steel box girder section with 3 diaphragm plates (3×3.2 m) was taken as a computational model. ABAQUS was used to build its finite element model, as shown in Fig. 1. The paper mainly analyzed dynamic stress responses of a middle diaphragm plate under No. 1 Lane. Boundary condition was as follows: two ends of the steel box girder were fixed. Uniformly distribution loads from wheels were adopted. Area of the front wheel was 0.3 m×0.2 m, area of the middle and rear wheels was 0.6 m×0.2 m. A DLOAD module in the software was used to realize continuous motion of vehicle loads along the longitudinal symmetry direction of bridges [14-17], as shown in Fig. 2. In an actual situation, vehicles didn’t move completely along the middle line of a lane [18-21]. Such factor was not considered during loading. Horizontal positions of wheel loads were kept unchanged. Based on the tested middle line, the distance between center lines of left wheel and right wheel was 1.8 m. As shown in Fig. 3, the motion vehicle loads were measured by experiments, and then loads shared by each wheel were applied to corresponding positions of the finite element model.
Fig. 1Finite element model for computation of steel box girder section
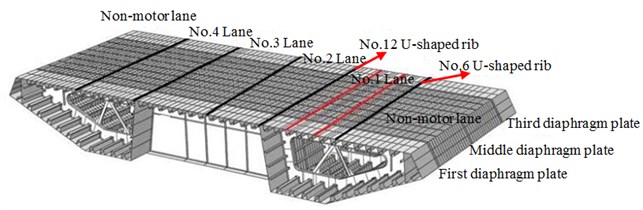
Fig. 2Loads of motion vehicles
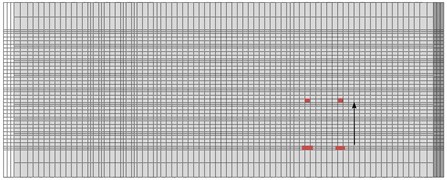
Fig. 3Experimental test of motion vehicle loads

2.1. Principal stress analysis on detail structures with considering shear residual stress
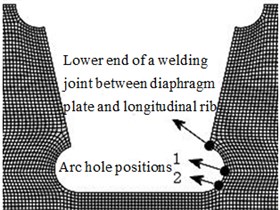
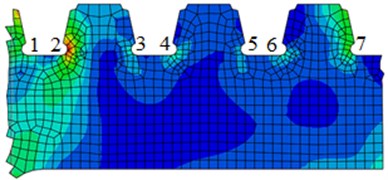
Through computing stress amplitudes at detailed positions, crack initiation life can be estimated. Its cracking direction is also an important research direction. According to maximum tension stress principle of linear elasticity fracture mechanics, cracks will be spread along the direction perpendicular to the principal tension stress. Therefore, the paper mainly researched direction changes of principal stress at the lower end of a welding joint between diaphragm plate and longitudinal rib as well as arc hole positions of the diaphragm plate, as shown in Fig. 4.
Fig. 4Researched positions on bridges
2.1.1. Principal stress at lower end of welding joint between diaphragm plate and longitudinal rib
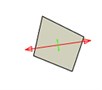
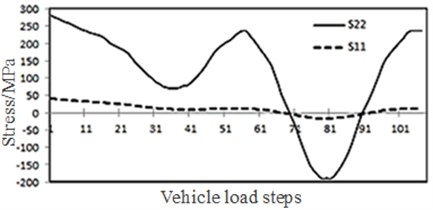
Considering the shear residual stress, changes with vehicle load steps, in maximum principal stress, minimum principal stress, S11 (horizontal stress), and S22 (vertical stress) of a lower end element of welding joint between diaphragm plate and longitudinal rib in the bridge model were extracted, as shown in Fig. 5. Changes of principal stress direction were shown in Fig. 6. The shear residual stress was brought into the computational model, so the maximum initial principal stress was the horizontal tension stress, while the minimum initial stress was the vertical pressing stress. When the front wheel of vehicles got close to the middle diaphragm plate, the maximum principal stress (tension stress) increased, and the minimum principal stress (pressing stress) decreased. When the front wheel of vehicles went far away from the diaphragm plate, the principal stress was recovered. When the rear wheel of vehicles reached the middle diaphragm plate, the maximum principal stress reached its peak; the minimum principal stress was changed into tension stress. When the rear wheel of vehicles went far away from the diaphragm plate, the principal stress was recovered. The principal stress direction was observed. With the motion of vehicle loads, the stress caused by vehicle loads increased firstly and decreased then. After overlaying with the initial stress, the stress state continued changing, while the principal stress direction also kept on changing. Nevertheless, the principal tension stress direction approached the horizontal direction and was perpendicular to the common crack direction at this position, as shown in Fig. 7.
Fig. 5Changes of stress with vehicle load steps
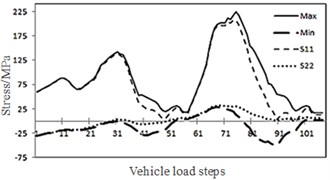
Fig. 6Changes of principal stress direction at the lower end of a welding joint
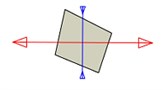
a) 1st step
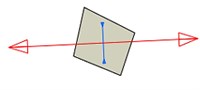
b) 20th step
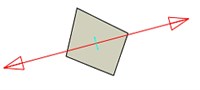
c) 31st step
d) 50th step

e) 70th step
f) 106th step
Fig. 7Cracking of the diaphragm plate at welding position
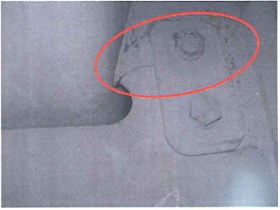
Fig. 8Changes of stress in S11 and S22 directions with vehicle load steps
2.1.2. Changes of principal stress at arc holes of the diaphragm plate
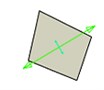
The element with most obvious changes in stress amplitude at the arc hole was analyzed. The principal stress direction was changed within a small scope with the vehicle load step, but it was nearly consistent with S22 (vertical direction) and S11 (horizontal direction). Approximate analysis was conducted for S22 and S11. Stress values and direction of S22 and S11 were shown in Fig. 8 and Fig. 9. Due to the shear residual stress, the element at arc hole was pulled from two directions at the initial stage. When the front wheel of vehicles got close to the diaphragm plate, the element was pressed. After overlaying with the initial state, the tension stress in S22 and S11 directions decreased. When the front wheel of vehicles went far away from the diaphragm plate, the tension stress of element was recovered. When the rear wheel of vehicles got close to the diaphragm plate, stress values of S11 and S22 of the element became negative, namely the stress became pressing stress. When the rear wheel of vehicles passed the diaphragm plate and went away, the stress of element became a positive value again, namely the stress became tension stress. During the cyclic process, the principal tension stress direction was vertical and perpendicular to the common cracking direction at this position, as shown in Fig. 10.
Fig. 9Changes of principal stress direction at arc hole 1
a) 1st step

b) 35th step
c) 55th step

d) 70th step
e) 81st step

f) 90th step
g) 101st step
Fig. 10Cracking on the diaphragm plate
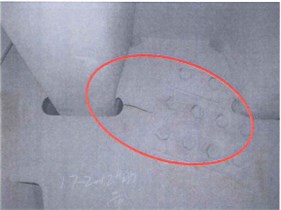
Fig. 11Changes of principal stress value at arc hole 2
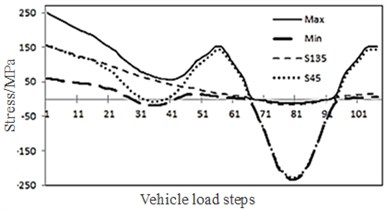
Fig. 12Changes of principal stress direction at arc hole 2
a) 1st step

b) 30th step

c) 55th step
d) 81st step

e) 100th step
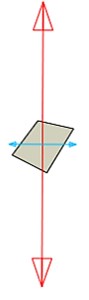
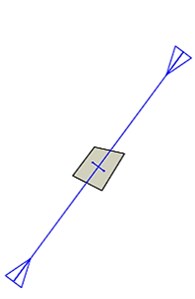
With considering the shear residual stress, principal stress changes at the arc hole 2 were analyzed. Changes with the load steps, in maximum principal stress, minimum principal stress, S45 (stress at horizontally forward-anticlockwise rotation angle of 45 DEG; large pressing stress at 81st step in Fig. 11) and S135 (stress at horizontally forward-anticlockwise rotation angle of 135 DEG; large pressing stress at 81st step in Fig. 12) of the lower end element of welding joint between diaphragm plate and longitudinal rib) were analyzed, as shown in Fig. 11. Changes of principal stress direction were shown in Fig. 12. Principal stress changes at this position were similar with those at arc hole 1. The principal tension stress direction was nearly tangent to the arc and nearly perpendicular to the actual crack direction.
2.2. Analysis on the internal force in the diaphragm plate
2.2.1. Action direction of the internal force
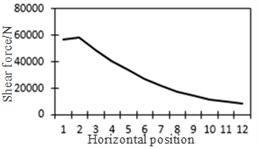
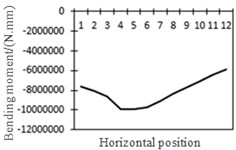
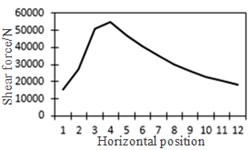
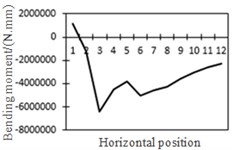
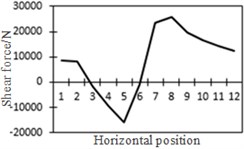
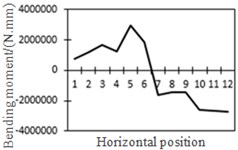
The researched girder section of middle diaphragm plate was extracted, as shown in Fig. 13(a). Arc hole positions of the researched U-shaped rib were numbered as No. 1-No. 7 from left to right. Vehicle loads directly acted on the middle diaphragm plate. Horizontal action positions were shown in Fig. 13(b). Vehicle loads of left wheels acted above No. 1 and No. 2 positions, and vehicle loads of right wheels acted above No. 7 position. A shear force diagram was extracted after computation and analysis, and a bending moment diagram was shown in Fig. 14. It was shown in Fig. 14(a) that the shear force in the left end was positive and also the maximum value, where its direction was nearly vertically downward. Under vehicle loads of left wheels, the shear force decreased; the shear force at girder sections without loads was kept unchanged, while the value was positive. Under vehicle loads of right wheels, it decreased to a negative value with the opposite and upward direction. It was shown in Fig. 14(b) that the bending moment in the left end was negative, while its direction was perpendicular to the diaphragm plate and faced the principal plane; the bending moment in the right end was positive, while its direction was perpendicular to the diaphragm plate and turned its back to the principal plane.
Fig. 13Researched girder section and vehicle loads
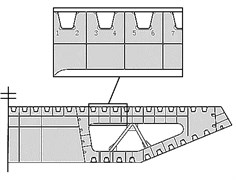
a) Researched girder section
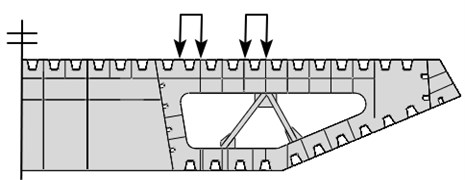
b) Vehicle loads
Fig. 14Internal forces of the researched girder section
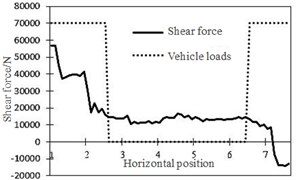
a) Shear force
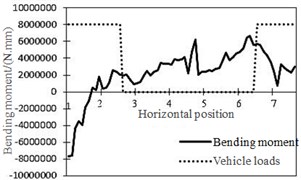
b) Bending moment
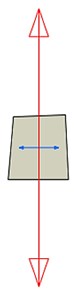
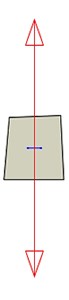
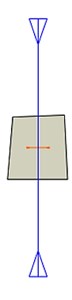
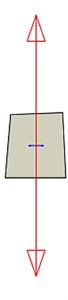
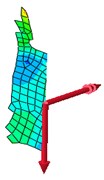
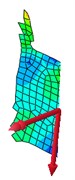
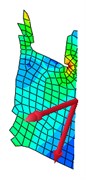
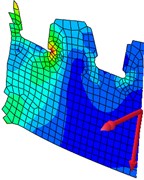
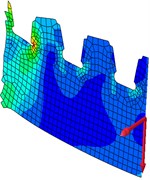
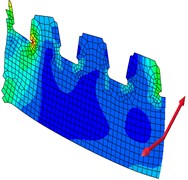
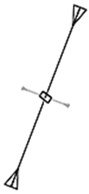
Stress contour, resultant force and resultant bending moment of each cross section were shown in Fig. 15. In the diagram, the single arrow was resultant force, while the double arrow was resultant bending moment. It was shown in Fig. 15(a) that the maximum stress presented at No. 2 position. It was shown in Fig. 14 that shear force values at No. 1-No. 7 positions were positive with the downward direction. At positions of No. 2-No. 7, the bending moment was positive, while its direction was perpendicular to the diaphragm plate and turned its back to the principal plane. Principal stress directions at 7 researched positions were shown in Fig. 16. Positions No. 1, No. 3 and No. 5 were most unfavorable for principal tension stress; positions No. 2, No. 4, No. 6 and No. 7 were most unfavorable for principal press stress.
Fig. 15Stress contour, resultant force and resultant bending moment of each cross section
a) Stress contour
b)
c)
d)
e)
f)
g)
Under the action of positive shear force, positions No. 1, No. 3 and No. 5 were tensioned while positions No. 2, No. 4 and No. 6 were pressed. Under the action of positive bending moment, positions No. 1 to No. 6 are pressed. Under the action of local pressure of vehicle loads, all positions were pressed. The principal stress direction was consistent with the action of shear force. The arc hole of diaphragm plate, namely positions No. 2, No. 4 and No. 6 were pressed under shear force, bending moment and local wheel pressure. Stress amplitude was the sum of three kinds of forces. The arc hole of diaphragm plate, namely positions No. 1, No. 3, No. 5 and No. 7 were tensioned under the action of shear force and pressed under the action of bending moment and local wheel pressure. Stress amplitude was the difference between the action of shear force, the action of bending moment and local wheel pressure. Therefore, stress amplitude at the arc hole close to diaphragm plate was larger than that at the arc hole close to the middle line, which was easier to crack and consistent with actual damage.
Fig. 16Principal stress direction of 7 researched positions

a) No. 1
b) No. 2

c) No. 3

d) No. 4

e) No. 5

f) No. 6

g) No. 7
2.2.2. Correlation between internal force and principal stress at the arc hole
Wheel loads of vehicles horizontally moved 12 steps to the right. Every load step moved 300 mm. The stress distribution of researched girder section was computed in each movement. As U rib was 600 mm wide, wheel loads of vehicles advanced one U rib distance to the right in every two steps. In the 1st step, vehicle loads in left wheel were right above positions No. 1 and No. 2. In the 2nd step, vehicle loads in left wheel were right above positions No. 2 and No. 3. In the same way, vehicle loads in left wheel were right above positions No. 6 and No. 7 in the 6th step. Mises stress values at positions No. 1 to No. 7 were recorded in the 1st to the 6th step, as shown in Table 1.
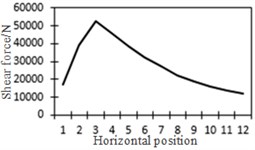
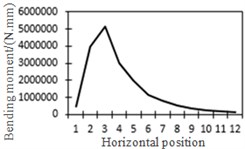
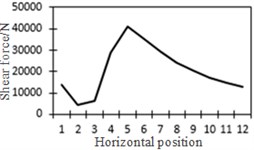
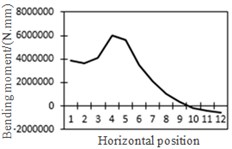
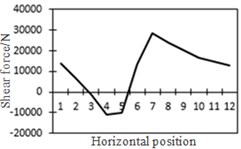
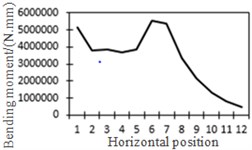
Researched positions will be pressed under the action of local wheel pressure. Through analyzing the data in Table 1, maximum stresses presented at the positions of pressing and stress was always the largest when wheel pressure loads reached the researched point, which indicated that the action of local loads had a great influence on the stress value of researched points. The change of shear force and bending moment with loads at positions of each researched point was recorded, as shown in Fig. 17.
Fig. 17Shear force and bending moment at each researched position
a) Shear force at position No. 1
b) Bending moment at position No. 1
c) Shear force at position No. 2
d) Bending moment at position No. 2
e) Shear force at position No. 3
f) Bending moment at position No. 3
g) Shear force at position No. 4
h) Bending moment at position No. 4
i) Shear force at position No. 5
j) Bending moment at position No. 5
k) Shear force at position No. 6
l) Bending moment at position No. 6
m) Shear force at position No. 7
n) Bending moment at position No. 7
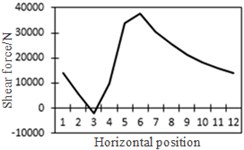
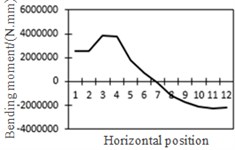
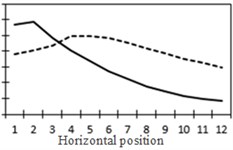
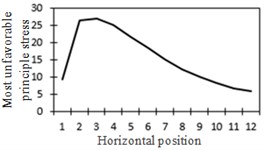
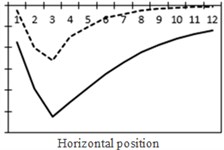
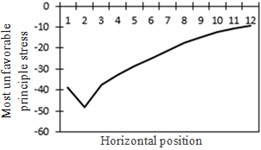
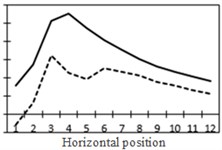
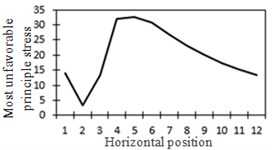
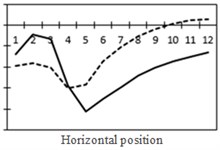
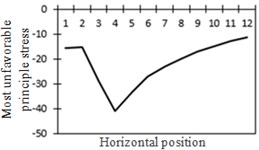
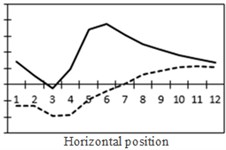
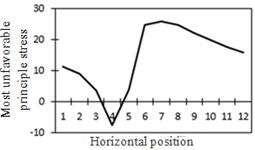
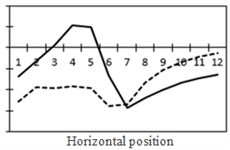
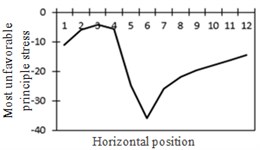
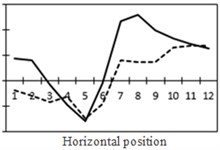
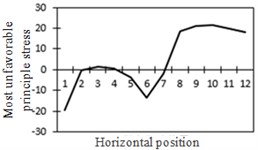
To study the influence of bending moment and shear force on the most unfavorable principal stress at researched positions, curves of shear force and bending moment were drawn in one figure and compared with the most unfavorable principal stress at researched positions, as shown in Fig. 18. Shear force was represented by a solid line while bending moment was represented by a dotted line. Researched positions No. 1, No. 3, No. 5 and No. 7 were tensioned under the action of positive shear force and pressed under the action of positive bending moment. With the increase of bending moment, principal stress will decrease. Therefore, the reversed bending moment curve and shear force curve were drawn in the same figure. Positions No. 2, No. 4 and No. 6 were pressed under the action of positive shear force and bending moment.
Fig. 18Shear force, bending moment and the most unfavorable principal stress at each position (The solid line stands for changes in shear force while the dotted line stands for changes in bending moment)
a) Shear force and bending moment at No. 1
b) Most unfavorable principle stress at No. 1
c) Shear force and bending moment at No. 2
d) Most unfavorable principle stress at No. 2
e) Shear force and bending moment at No. 3
f) Most unfavorable principle stress at No. 3
g) Shear force and bending moment at No. 4
h) Most unfavorable principle stress at No. 4
i) Shear force and bending moment at No. 5
j) Most unfavorable principle stress at No. 5
k) Shear force and bending moment at No. 6
l) Most unfavorable principle stress at No. 6
m) Shear force and bending moment at No. 7
n) Most unfavorable principle stress at No. 7
Table 1Mises stress of loads at every position
Load position | 1 (tension / MPa) | 2 (press / MPa) | 3 (tension / MPa) | 4 (press / MPa) | 5 (tension / MPa) | 6 (press / MPa) | 7 (press / MPa) |
1-2 | 15 | 41 | 14 | 14 | 11 | 11 | 20 |
2-3 | 23 | 47 | 4 | 16 | 9 | 6 | 0 |
3-4 | 24 | 36 | 12 | 37 | 5 | 5 | 3 |
4-5 | 22 | 32 | 30 | 46 | 9 | 6 | 2 |
5-6 | 19 | 28 | 30 | 34 | 6 | 27 | 4 |
6-7 | 16 | 25 | 28 | 29 | 23 | 35 | 13 |
From the comparison in Fig. 18, the change trend of the most unfavorable principal stress at each researched position was closer to that of shear force. When wheel loads of vehicles horizontally moved the 1st step, vehicle loads in the left wheel were above No. 1 and No. 2. Vehicle loads in the left wheel played a role in pressing. Therefore, changes in the most unfavorable principal stress at No. 1 and No. 2 in the 1st step were slightly lower than those in shear force. When wheel loads of vehicles horizontally moved the 2st step, vehicle loads in the left wheel were above No. 2 and No. 3. Changes in the most unfavorable principal stress at No. 2 and No. 3 in the 1st step were slightly lower than those in shear force. A similar regulation can be found at other positions. Position No. 7 was very special because vehicle loads in the right wheel were above position No. 7 in the 1st step. Therefore, changes in the most unfavorable principal stress at positions No. 7 in the 1st step were slightly lower than those in shear force. Based on the analysis, the fatigue stress amplitude at the arc hole of bridges was greatly affected by shear force and local wheel pressure.
3. Fatigue life estimation of bridges with considering the shear residual stress
A local model of diaphragm plate of bridges was established in ABAQUS to simulate the cutting process, compute and obtain the residual stress contour of diaphragm plate, as shown in Fig. 19(a). The edge of arc holes was tensioned. Initial stress was introduced into the sub-model of diaphragm plate of bridges through editing the keyword initial stress. Simplified vehicle load spectrum was loaded to bridge model. The strain and stress history at arc holes can be obtained through computation. As the residual stress was tension stress initially, the left side at the arc hole position of diaphragm plate was tensioned repeatedly and the stress value was the largest when rear wheels of vehicles passed above the diaphragm plate, as shown in Fig. 19(b). However, stress amplitude was the smallest in the left side at the arc hole of diaphragm plate. The right side at the arc hole of diaphragm plate was pressed under the action of loads and stress amplitude was the largest. It was a hazardous position of fatigue. The initial stress of the arc hole was 280 MPa. When the front wheel passed, the position was pressed. Tension stress decreased after superposition. When the rear wheel passed, the stress at the position became pressure stress after superposition. Stress history, strain history and stress-strain relationship at the arc hole of bridges under the action of vehicles were shown in Fig. 20.
Fig. 19Stress contour on the diaphragm plate
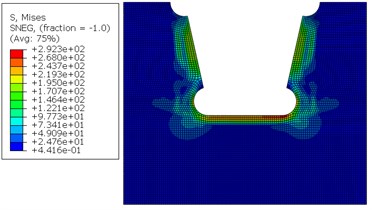
a) Initial cutting residual stress
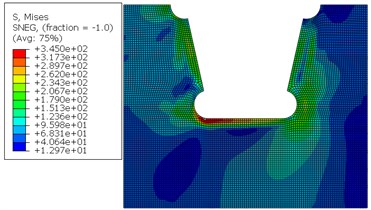
b) Stress after the passing of rear wheels
Fig. 20Relationship between stress and strain at the arc hole position of bridges
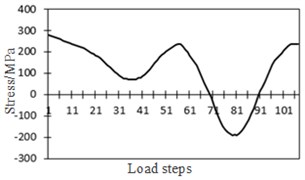
a) Stress history
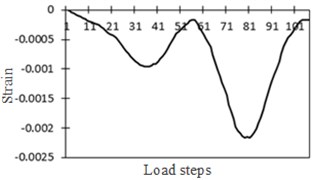
b) Strain history
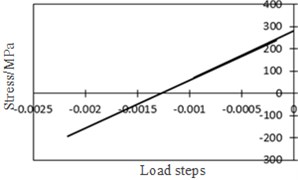
c) Stress-strain relationship
Expression of the strain-life curve was as follows [22]:
where: was a fatigue intensity coefficient; was an elastic modulus; was a fatigue life; was a fatigue continuity coefficient; was a fatigue intensity index; was a fatigue continuity index.
The experimental Q345 fatigue results in Reference [22] were substituted into Eq. (1). The obtained fatigue life was as follows:
The actual stress history of fatigue was not symmetrical strain cycle in general. When Eq. (2) is applied, it was supposed to make correction according to experimental data and consider the impact of average stress. Correction may be made according to the following equation without experimental data:
According to Eq. (2) and (3), average stress was considered to make correction and obtain Eq. (4):
In this equation, was average stress, was the limit cycles.
The computational stress and strain were put into Eq. (4) to estimate the fatigue life of bridge structure which took into account the shear stress and make a comparison with the result which did not take into account the shear stress, as shown in Table 2. If the equivalent computation of fatigue life considered the strain amplitude caused by the whole kinds of vehicles, the equivalent number in hole and plate positions was 295. If the equivalent computation of fatigue life only considered the strain amplitude caused by the rear wheel of trucks, the equivalent number was 29. It can be seen from Table 2 that the cutting residual stress has an obvious influence on the fatigue life of bridges. When the cutting residual stress is not considered and the equivalent times is 295, the fatigue life of the bridge is 650 years because this status is an ideal situation and the bridge has also some struts to improve the fatigue life.
Table 2Fatigue life estimation of bridges
Equivalent number | Equivalent strain amplitude (%) | Limit cycles / | Frequency | Fatigue life / years | |
Without cutting residual stress | 295 (Considering all vehicles) | 0.098 | 1.2E+9 | 0.059 | 650 |
With cutting residual stress | 295 (Considering all vehicles) | 0.097 | 1.4E+9 | 0.059 | 74 |
Without cutting residual stress | 29 (Considering rear wheels) | 0.178 | 7.4 E+6 | 0.0058 | 40 |
With cutting residual stress | 29 (Considering rear wheels) | 0.177 | 3.6 E+6 | 0.0058 | 20 |
4. Conclusions
This paper established a finite element model of the steel bridge and applied movable vehicle loads measured by experiments into the finite element model so that stress and strain distribution characteristics in detail structures of bridges were computed. The change process in the direction of detailed element of diaphragm plate after the shear residual stress was taken into account. Results showed that the direction of its principal tension stress was vertical to the actual crack direction of cracks. To analyze the inner relationship between the internal force of diaphragm plate and local stress amplitude, vehicle loads moved horizontally to record the change trend of principal stress at the arc hole and shear force and bending moment in the cross section. Through making a comparison, this paper found that stress amplitude at the arc hole was mainly affected by shear force and local wheel pressure. The fatigue life of bridges which took into account the shear residual stress was estimated according to stress and strain to compare with the result which did not take into account the shear stress. Comparison results showed that the shear residual stress had an obvious effect on fatigue life of the steel bridge, so it cannot be neglected during numerical computation.
References
-
Jackson R., Chusoipin I., Green I. A finite element study of the residual stress and deformation in hemispherical contacts. Journal of Tribology, Vol. 127, Issue 3, 2005, p. 484-493.
-
Amirat A., Mohamed Chateauneuf A., Chaoui K. Reliability assessment of underground pipelines under the combined effect of active corrosion and residual stress. International Journal of Pressure Vessels and Piping, Vol. 83, Issue 2, 2006, p. 107-117.
-
Moon J. H., Weiss J. Estimating residual stress in the restrained ring test under circumferential drying. Cement and Concrete Composites, Vol. 28, Issue 5, 2006, p. 486-496.
-
Kong F., Ma J., Kovacevic R. Numerical and experimental study of thermally induced residual stress in the hybrid laser–GMA welding process. Journal of Materials Processing Technology, Vol. 211, Issue 6, 2011, p. 1102-1111.
-
Magalhães A. G., De Moura M., Gonçalves J. P. M. Evaluation of stress concentration effects in single-lap bonded joints of laminate composite materials. International Journal of Adhesion and Adhesives, Vol. 25, Issue 4, 2005, p. 313-319.
-
Van Miegroet L., Duysinx P. Stress concentration minimization of 2D filets using X-FEM and level set description. Structural and Multidisciplinary Optimization, Vol. 33, Issues 4-5, 2007, p. 425-438.
-
Yang Z., Kim C. B., Cho C., et al. The concentration of stress and strain in finite thickness elastic plate containing a circular hole. International Journal of Solids and Structures, Vol. 45, Issue 3, 2008, p. 713-731.
-
Pfeil M. S., Battista R. C., Mergulhão A. J. R. Stress concentration in steel bridge orthotropic decks. Journal of Constructional Steel Research, Vol. 61, Issue 8, 2005, p. 1172-1184.
-
Wang L., Zhang J. P., Wang Y. B., Liu X. W. Welding stress dynamic simulation analysis on extra-thick plates in steel bridge. Journal of Chongqing Jiaotong University (Natural Science), Vol. 27, Issue 3, 2008, p. 345-349.
-
Kuang Z. P., Yang Q. H. Fatigue performance experimental research of pre-stress CFRP reinforcing bridge structure. Journal of Tongji University (Natural Science), Vol. 36, Issue 10, 2008, p. 1349-1354.
-
Ye X. W., Ni Y. Q., Wong K. Y., et al. Statistical analysis of stress spectra for fatigue life assessment of steel bridges with structural health monitoring data. Engineering Structures, Vol. 45, 2012, p. 166-176.
-
Aygül M., Al-Emrani M., Urushadze S. Modelling and fatigue life assessment of orthotropic bridge deck details using FEM. International Journal of Fatigue, Vol. 40, 2012, p. 129-142.
-
Kwon K., Frangopol D. M. Bridge fatigue reliability assessment using probability density functions of equivalent stress range based on field monitoring data. International Journal of Fatigue, Vol. 32, Issue 8, 2010, p. 1221-1232.
-
Wen X. Z., Shao L., Xue Y., et al. A rapid learning algorithm for vehicle classification. Information Sciences, Vol. 295, 2015, p. 395-406.
-
Gu B., Sheng V. S., Tay K. Y., et al. Incremental support vector learning for ordinal regression. IEEE Transactions on Neural Networks and Learning Systems, Vol. 26, Issue 7, 2015, p. 1403-1416.
-
Pan Z. Q., Zhang Y., Kwong S. Efficient motion and disparity estimation optimization for low complexity multiview video coding. IEEE Transactions on Broadcasting, Vol. 61, Issue 2, 2015, p. 166-176.
-
Fu Z. J., Ren K., Shu J. G., et al. Enabling personalized search over encrypted outsourced data with efficiency improvement. IEEE Transactions on Parallel and Distributed Systems, Vol. 27, Issue 9, 2016, p. 2546-2559.
-
Gu B., Sheng V. S. A robust regularization path algorithm for ν-support vector classification. IEEE Transactions on Neural Networks and Learning Systems, 2016.
-
Gu B., Sun X. M., Sheng V. S. Structural minimax probability machine. IEEE Transactions on Neural Networks and Learning Systems, 2016.
-
Zheng Y. H., Jeon B., Xu D. H., et al. Image segmentation by generalized hierarchical fuzzy C-means algorithm. Journal of Intelligent and Fuzzy Systems, Vol. 28, Issue 2, 2015, p. 961-973.
-
Xia Z. H., Wang X. H., Sun X. M., et al. Steganalysis of LSB matching using differences between nonadjacent pixels. Multimedia Tools and Applications, Vol. 75, Issue 4, 2016, p. 1947-1962.
-
Luo Y. R., Wang Q. Y., Liu Y. J., Huang C. X. Low cycle fatigue properties of steel structure materials Q235 and Q345. Journal of Sichuan University (Engineering Science Edition), Vol. 44, Issue 2, 2012, p. 169-175.
About this article

