Abstract
A 2-D model-bridge with different porosity barriers is simulated with CFD to explore the windbreak mechanism. The accuracy of simulation is verified by a wind tunnel test. The porosity of the barriers is optimized by analyzing the aerodynamic features of the train-bridge system subjected to cross winds. It is found that wind velocity on the windward track changes greater than that on the leeward track. The train rolls towards the barrier when porosity is lower than 10 % and away from barrier when porosity is higher than 30 %, and the rolling moment is minimized when porosity is 30 %. The dynamic response of running train with and without wind barrier is compared, from which the windbreak effect of barrier is identified.
1. Introduction
In the area where the Lanzhou-Xinjiang high-speed railway runs through, strong wind usually happens, which increases the possibility of derailment and rollover accidents of trains. It is necessary to install wind-barriers to ensure the running safety of high-speed trains.
Several researches have been made about the wind-induced stability of trains on ground and on bridges. Yang, et al. [1] studied the reasonable height of win-break wall which is used on the flat ground and advised to adopt the wind-break wall in the strong wind area. The research of Hrvoje, et al. [2] indicated that without a wind barrier, wind velocities on bridge reach 80 % of the freestream velocity at height as low as 1 m full-scale. Zhu, et al. [3] investigates the effects of vehicle position in different road lanes of the bridge deck basing on a wind tunnel test. However, windbreak mechanism and effect of wind barriers on the railway train need more attention.
This paper focuses on the windbreak mechanism of wind barrier with different porosities (0 %, 10 %, 30 % and 50 %). Then the aerodynamic of train and bridge are studied for optimal porosity of certain height barrier, as well as the layout of trains on the track. To verify the simulated precision, a wind tunnel test is conducted which is proved in good agreement with calculated results. Finally, dynamic response of running train is studied which prove the windbreak effect of barrier.
2. Modeling and performance evaluation index
2.1. Modeling and meshing
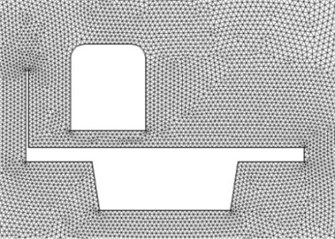
Considering the limited computing resources, slender train is often simplified as 2-D model in numerical simulation, and bogies and wheel-sets are ignored because of their small windward area, thus just wind forces on the car-body are taken into consideration. The bridge and train model (scale 1:32) is shown in Fig. 1. The size of computational region is a 50×22 rectangle, where and denote the height and width of the deck respectively, which is same as in Zhang et al. [4]. Shown in Fig. 2 is the local grid distribution, and the flow domain is resolved by a block unstructured grid. The total grid number is about 2×10⁶. The holes on the barriers were simulated with blocks of identical thickness but different heights, and unconstructed mesh is generated densely around the target structure. For supplementing the mesh resolution, the wall function is adopted for the CFD simulation, the wall boundaries at the section surface.
The flow field around the running train on the bridge can be simplified into viscous and incompressible system, and the governing equations are solved by the finite volume method. The RNG k-ε turbulence model is adopted to simulate the flow field distribution through wind barriers. The governing equation is analyzed with the second-order upwind scheme (MUSCL) and a second-order central difference scheme in space. For the CFD simulation, velocity inlet is applied to the entrance and pressure outlet to define the outlet boundary conditions. The no-slip condition is enforced on upper and lower boundaries as well as the bridge and deck. At the inflow boundary, uniform velocity of 8 m/s is utilized in the next fluid analysis.
Fig. 1Train-bridge model with barrier (unit: mm)
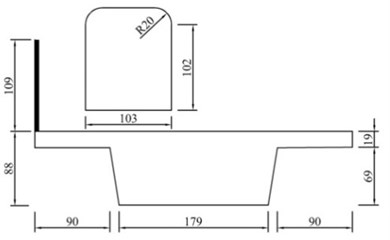
Fig. 2Meshing schematic diagram
2.2. Wind velocity reduction coefficient
Influenced by girder and wind barrier, a boundary layer is created when cross wind passes over the bridge, which resulted different wind velocities on the different height. To weigh the windbreak effect of wind-proof construction, equivalent velocity of bridge is defined based on the principle of dynamic equal effective as:
where is the velocity variation with height, is the equivalent height, namely range of height influenced by crosswind and can be 5 m for passenger train.
Windbreak effect of barrier can be justified by the local velocity reduction coefficient , which is the ratio of effective velocity to factual velocity , namely .
2.3. Tri-component coefficients and local protection coefficient of vehicle
When bridge-train system is exposed to a flow field, the pressure around it is quite different. The force and moment vary with wind velocity and windward area, so tri-component coefficients are used to appraise the dynamic properties of the deck and train as:
where , and are the drag, lift and moment coefficients, respectively; , and indicate the simulated drag, lift and moment forces, respectively; , and represent the height, length and width of the section model (herein 1 m), respectively; is the air density which is usually deemed to be 1.225 kg/m3; stands for the velocity of the wind flow.
Criteria mentioned above are used for evaluating the overall windbreak effect of wind-proof structure, and local protection coefficient LPC can be applied to estimate protection effect of some unique points, which is defined as:
where stands for local wind velocity of a point. 0 means the flow in the zone is accelerating. One can get local protection coefficients of all points in the protection zone, and normalize them to evaluate the protection effect of wind barrier in the zone. Protection zone is where vehicle runs and the center of it is in the vertical plane the center line of bridge exactly belongs to. For a double-track railway, the protection zone can take as width 9 m by height 5 m.
3. Simulation result analysis
Fig. 3 shows the wind velocity profiles on the surface of bridge deck where wind barrier is installed on the windward side. It can be seen that wind break effect is closely related to the porosity of barrier, and wind velocity in the protection zone increases with the porosity. Generally, wind velocity on the windward track is larger than that on the leeward track, and velocity profile on the windward track fluctuates heavier as well due to its location closer to the barrier. The size of holes on the barrier has a great impact on the wind velocity, which varies remarkably with the porosity. For the porosity 0 % and 10 %, the wind velocity profile remains nearly clinic at the altitudes from 0 m-4 m, after which it increase rapidly. With the larger porosities (30 % and 50 %), wind velocity can reach to 8 m/s which is the same with inlet flow.
Fig. 3Wind velocity profile vs. porosity of wind barrier at track center
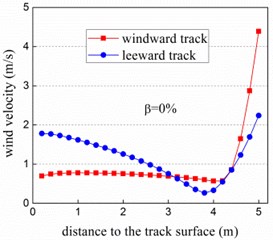
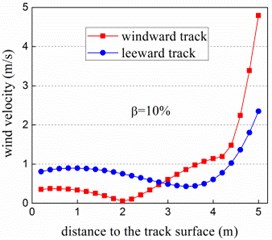
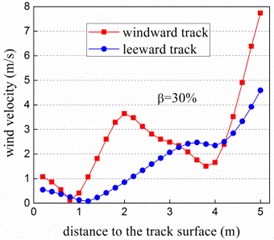
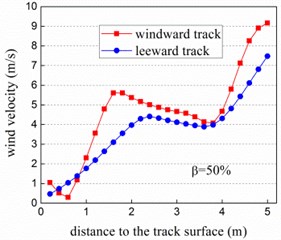
Fig. 4 denotes the wind velocity reduction coefficient of the bridge (protecting height is 5 m) when the porosity of wind barrier varies from 0 % to 50 %. In general, wind velocity reduction coefficient of the bridge increases with the porosity, and value of the left track is always larger than that of the right except the porosity of 0 %. On the contrary, the local protection coefficient decreases with the enlargement of porosity which is obviously shown in the Fig. 5. Which is in common between wind velocity reduction coefficient and local protection coefficient is that value of the left track is larger than that of the right track.
To analysis the windbreak effect of wind barrier with different porosities, equivalent wind velocities of various cases are calculated, as listed in Table 1, in which the ones without wind barrier are also given for comparison.
Fig. 4Wind velocity reduction coefficient of bridge
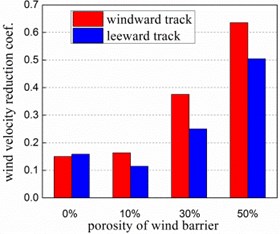
Fig. 5Local protection coefficient of bridge
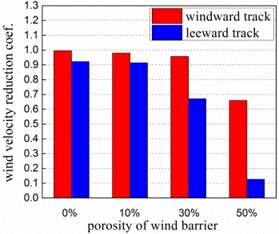
Table 1Wind velocity reduction and local protection coefficient with and without wind barrier
Indexes | Position of focus | No barrier | Porosity of wind barrier | |||
0 % | 10 % | 30 % | 50 % | |||
Equivalent wind velocity | Centerline of windward track | 8.53 | 1.20 | 1.31 | 3.00 | 5.08 |
Centerline of leeward track | 8.13 | 1.27 | 0.92 | 2.00 | 4.04 | |
Wind velocity reduction coefficient | Centerline of windward track | 1.066 | 0.150 | 0.163 | 0.375 | 0.636 |
Centerline of leeward track | 1.016 | 0.159 | 0.115 | 0.250 | 0.504 | |
Local protection coefficient | Centerline of windward track | –0.299 | 0.995 | 0.980 | 0.957 | 0.659 |
Centerline of leeward track | –0.223 | 0.998 | 0.994 | 0.914 | 0.709 | |
It can be seen from Table 1 that equivalent wind velocity is reduced effectively by wind barrier. Local protection coefficient of bridge with no barrier is negative and the wind reduction coefficient is slightly greater than 1, which implies the increase of wind speed. The wind velocity reduction coefficient of the deck of different porosities is less than 1, which signifies the diminution of the wind speed. Comparing the results in different cases, wind velocity is dramatically reduced and local protection coefficients exceed 90 % when the porosity is less than 30 %. So porosity of 30 % is suggested to be adopted in practical engineering.
The conditions of the wind barrier porosity and are selected to make a specific comparative analysis. Fig. 6 denotes the pressure contour when the porosity of the wind barrier is 0 % and 30 % respectively.
Fig. 6Pressure contour of train-bridge system with barrier (H= 3.5 m)
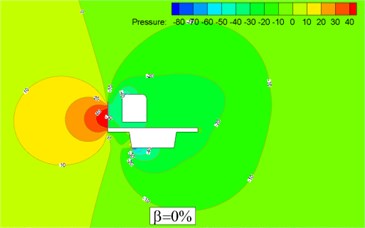
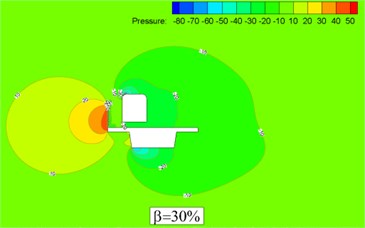
When the porosity of the wind barrier is 0 %, there is an obvious positive pressure domain on the upwind side of the train and a large drag force is acted. The negative pressure on the upwind side of the train is slightly small when porosity is 30 % due to the holes on the wind barrier. There is a small pressure difference on the leeward side in the two cases. Therefore drag force on the bridge is reduced because the wind barrier and the bridge work as an integral whole.
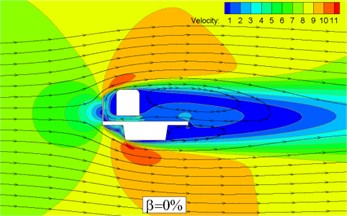
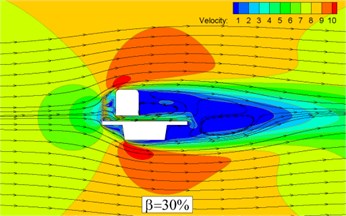
Fig. 7 denotes the velocity nephogram and the stream line of train-bridge system when the porosity of the wind barrier is 0 % and 30 % respectively. It can be seen that there is an obvious eddy domain when the flow pass by the train-bridge system. A big vortex appears obviously behind bridge and maximum velocity presents on the left corner of the train and bridge evenly. The difference is that flow passes through the barrier and plenty of little vortexes generate at the gap between barrier and train when porosity is 30 %.
Fig. 7Velocity contour and streamline of train-bridge system with barrier (H= 3.5 m)
Shown in the Fig. 8 and Fig. 9 are the distributions of the tri-component coefficients versus barrier porosity rate. For the train, almost increases linearly with porosity which means decrease of wheel-rail contact force. To avoid overturn of the train, rolling moment coefficient might just as well be held near zero and positive lift force can make train difficult to run off the rails. For the bridge, increases evidently while and decrease slowly with the porosity rate, due to the decrease of windward area. Compared with bridge, the tri-component coefficients of train are more sensitive to the porosity of wind barrier. Synthetically considering the safety of train and bridge, 30 % is proved to be the optimum value of barrier porosity once again.
Fig. 8Tri-component coefficients of train
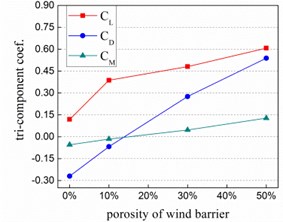
Fig. 9Tri-component coefficients of bridge
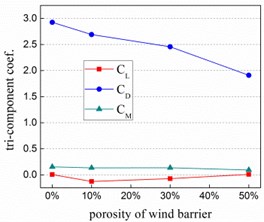
Table 2Tri-component coefficients of vehicle and bridge under different cases
Cases | 1 | 2 | 3 | |||
Sketches | 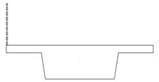 | 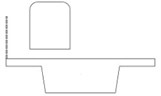 | 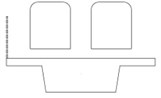 | |||
Targets | Bridge | Train | Bridge | Train on windward side | ||
CFD | Test | RD (%) | ||||
2.843 | 3.021 | 5.9 | 0.275 | 2.456 | 0.257 | |
0.059 | 0.074 | 20.3 | 0.480 | –0.074 | 0.486 | |
0.192 | 0.180 | –6.7 | –0.047 | 0.134 | –0.028 | |
To study the tri-component coefficients of the bridge and train, three cases are considered, as listed in Table 2. Wind barrier in the three cases have the same parameters as 3.5 m in height and 30 % in porosity. Drag force and rolling moment coefficient of bridge remain unchanged, while lift force coefficient changes from positive to negative, which means a greater possibility of derailment. The tri-component coefficients of bridge in case 1 from a wind tunnel test [5] are also given in the table, where RD is the difference between measured values and simulated ones divided by the former. The comparison shows that the computed results are credible.
To explore the windbreak effect of wind barrier, dynamic responses of train running on the bridge are studied in the cases with and without barrier, in which the train runs on the bridge at 200 km/h under wind velocity of 20 m/s. Fig. 10 displays maximum lateral and vertical accelerations of the vehicles. It can be seen that the maximum accelerations are effectively reduced with the help of barrier, which immensely ensures the running safety of train.
Listed in Table 3 are running safety indices of train on bridge with/without barrier. It can be seen that the offload factor is approximately reduced by half, while derailment factor and lateral wheel force are cut down as well. As a consequence, the running safety of the train is greatly enhanced due to the windbreak effects of the wind barriers.
Fig. 10a) Lateral and b) vertical acceleration curves of the vehicles on the bridge
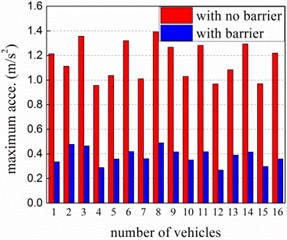
a)
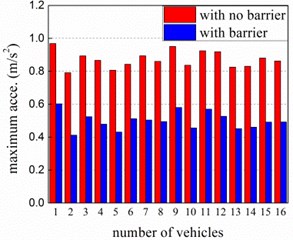
b)
Table 3Comparison of indices of running train on bridge with/with no barrier
Indices for running safety | With no barrier | With barrier (3.5 m, 30 %) |
Offload factor | 2.428 | 0.257 |
Derailment factor | 0.820 | 0.313 |
Lateral wheel force (kN) | 60.706 | 22.420 |
4. Conclusions
It can be concluded from above analysis that wind velocity on the deck is reduced by the wind barrier with the porosity, which is beneficial for train running. The porosity of wind barrier has a great effect on the aerodynamic characteristic of the high-speed train. The match of simulated results and testing ones indicates that the numerical simulation can provide a simple and convenient approach to analysis the aerodynamics of train-bridge system. With the help of wind barrier, maximum of train acceleration decrease distinctly which is in favor of running safety of train.
References
-
Yang B., Liu T. H., Yang M. Z. Reasonable setting of wind-break wall on railway in strong wind areas. Journal of Railway Science and Engineering, Vol. 8, 2011, p. 67-72.
-
Hrvoje K., Lorenzo P., Alessandra B., Gianni B. Sheltering efficiency of wind barriers on bridges. Journal of Wind Engineering and Industrial Aerodynamics, Vol. 107, 2012, p. 274-284.
-
Zhu L. D., Li L., Xu Y. L., Zhu Q. Wind tunnel investigations of aerodynamic coefficients of road vehicles on bridge deck'. Journal of Fluids and Structures, Vol. 30, 2012, p. 35-50.
-
Zhang T., Xia H., Guo W. W. Analysis on running safety of train on bridge with wind barriers subjected to cross wind. Wind and Structures, Vol. 17, 2013, p. 203-225.
-
Guo W. W., Wang Y. J., Xia H., Lu S. Wind tunnel test on aerodynamic effect of wind barriers on train-bridge system. Science China-Technological Sciences, Vol. 58, 2015, p. 219-225.
About this article

