Abstract
Effectively evaluating the fatigue behavior of aging bridge structures is an urgent task for engineers and researchers, as more and more existing bridges approach the end of their service life. Determining the fatigue load effects due to moving trains is a key aspect of the available assessment frameworks (e.g., the S-N approach). In this paper, a vehicle-bridge system model is integrated into the fatigue assessment procedure employing S-N lines. The system model is used to obtain fatigue stresses generated by moving train loads. The integration is proven able to aid in effective prediction of fatigue damage and remaining fatigue life of railway bridges.
1. Introduction
More and more existing bridges are approaching the end of their service life worldwide. In this context, it is an urgent task for engineers and researchers to effectively evaluate the fatigue behavior of these aging structures. Determining the load effects (i.e., fatigue stresses) due to moving trains is a key aspect of the fatigue assessment of railway bridges. Even small differences in stress predictions can affect fatigue life estimates considerably, which can lead to inappropriate decisions regarding assessment and maintenance of existing bridges [1]. Consequently, it is crucial for the reliable assessment to obtain fatigue stress ranges which reflect the real load effects as much as possible.
In addition, significant dynamic effects have been caused in train-bridge systems, since increasing axle load and train speed were implemented for the railway transportation in many countries. These effects have to be accounted for in the fatigue evaluation, as coupling vibrations of the train and bridge can have a considerable impact on the stress response of bridge members. Recently, a numerical approach for the stress analysis of railway bridges based on train-bridge coupled dynamics has been proposed in Li, et al. [2].
In this paper, a coupled vehicle-bridge system model is integrated into the fatigue assessment procedure employing S-N lines. The system model developed is verified by field data from a steel railway bridge and utilized to compute the fatigue stresses of critical members. Fatigue damage and remaining fatigue life of the investigated bridge detail are estimated with various S-N lines provided by current codes.
2. S-N approach
Over the last several decades, the S-N approach, with the use of the Miner’s rule, has been well developed and adopted to design and assess fatigue-prone bridge components. An S-N line defines the relationship between the constant-amplitude stress range due to external loading and the applied number of stress cycles which lead to the fatigue failure of structural details. Several fatigue-related codes proposed S-N lines for different categories and/or classifications of commonly used bridge details in engineering practice [3-6]. A single-slope S-N line can be expressed as [3]:
where is the constant-amplitude stress range; is the applied number of stress cycles corresponding to a specific ; C and are, respectively, the fatigue detail coefficient for each category and material constant. The material constant represents the slope of the S-N line on logarithmic scale, while indicates the fatigue resistance and/or life of the specific structural detail when the constant-amplitude stress range is applied.
For a bilinear S-N line, Eq. (1) can be revised as [4]:
where CAFL is the constant-amplitude fatigue limit corresponding to a specific number of cycles ; and are, respectively, the slopes of the S-N line above and below the CAFL.
Combining the S-N line (i.e., Eq. (1)) and the Miner’s rule, the cumulative fatigue damage caused by variable-amplitude stress ranges can be given by:
where is the fatigue damage accumulation index; is the number of applied loading cycles in the predefined stress range bin ; is the critical number of cycles under stress range .
Based on the equivalence principle, the equivalent stress range can be determined, which results in the same fatigue damage as that caused by all the variable-amplitude stress ranges in a stress range bin histogram. Considering Eqs. (1) and (3), for single-slope S-N lines can be expressed as:
where is the total number of stress cycles in a stress range bin histogram. Similarly, for the bilinear S-N lines can be given by:
where is the number of cycles in the stress range bin , which is greater than the CAFL; is the number of cycles in the stress range bin smaller than the CAFL; and is the total number of stress cycles in the stress range bin histogram. Consequently, the fatigue damage index for both single-slop and bilinear S-N lines can be calculated by a uniform formula as:
where = for Eq. (4) or for Eq. (5); and in bilinear S-N lines.
3. Dynamic analysis of train-bridge system
In order to obtain the dynamic stresses induced by moving trains for the fatigue assessment, a coupled vehicle-bridge system model is herein developed and verified with the use of field data from a steel truss bridge, i.e., the Baihe Bridge in China.
3.1. Vehicle-bridge system model
The coupled vehicle-bridge system model consists of a 3D vehicle model, a 3D bridge model, and a wheel-rail interaction model. The car-body, bogie, and wheel-set are considered as rigid bodies. These rigid-body components are connected by the primary and/or secondary suspension systems, which are modeled as springs and dashpots. To take into account the spatial actions on the bridge structure by vehicles, it is assumed that each car-body or bogie has five DOFs (degrees-of-freedom), i.e., swaying, rolling, yawing, floating, and pitching; while each wheel-set has four DOFs, i.e., swaying, rolling, yawing, and floating. Consequently, the equation of motion of the vehicle model can be established by employing the Lagrange’s equation [7].
The bridge model is established by using the finite element (FE) method, and the equation of motion of the bridge is formulated through the direct stiffness method (DSM). Using original mass, stiffness, and damping matrices of the structure in geometric coordinates, the DSM can avoid the selection of bridge mode shapes and take into account contributions of all the modes to the dynamic stress response.
The wheel-rail interaction model defines dynamic forces applied on each other by the vehicle and bridge subsystems. In this study, it is assumed that in the vertical direction, the motion of a wheel-set can be considered as the superposition of motion of the bridge deck and track irregularities. As a result, the floating and rolling movements of a wheel-set are not independent and are related to the bridge movements. In the horizontal direction, the Kalker’s creep theory, indicating that the lateral wheel-rail interactions rely on their relative motion, is adopted. Based on the abovementioned assumptions, considering the equilibrium of forces and compatibility of displacements at the wheel-rail contact, the dynamic equation of motion of the coupled vehicle-bridge system can be expressed as:
where , , and are, respectively, the mass, damping, and stiffness matrices; , , and represent, respectively, the displacement, velocity, and acceleration vectors; is the vector of the dynamic force; the subscripts and stand for, respectively, the vehicle subsystem and the bridge subsystem. Eq. (7) can be solved by using the Newmark- method.
3.2. Fatigue stress
After obtaining the nodal displacements of the bridge (i.e., in Eq. (7)), the dynamic element stresses can be calculated as:
where is the vector of dynamic stress time histories; is the vector of dynamic strains; is the elastic matrix, which depends on material properties of the bridge structure in question; and is the displacement-strain matrix, which can be evaluated through derivative operations of the element shape functions with respect to geometric coordinates.
In order to estimate the fatigue damage accumulation and fatigue life, stress time histories obtained by Eq. (8) have to be processed. In the present analysis, the rain-flow counting method is applied to the raw stress data to generate stress range bin histograms which are next used for the fatigue assessment.
3.3. Verification of the system model
The Baihe Bridge is a continuous steel truss structure with three spans, 128 m each. The two main trusses are 13.4 m high and 8.0 m apart (see Fig. 1). As part of the Beijing-Tongliao Railway Line opened for traffic in 1980, it spans the Miyun Reservoir in the northeast of Beijing. In 2011, a routine inspection was performed on the bridge by the Beijing Railway Bureau, in association with Beijing Jiaotong University. The inspection includes modal analysis, and static and dynamic load tests.
Fig. 1Positions of bridge members for measurement in the field test
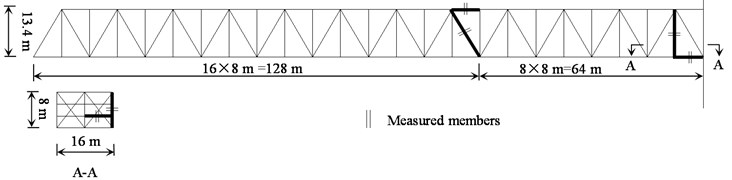
By analyzing the ambient vibration data, two fundamental vibration modes were identified, namely, the first lateral and vertical bending modes. The corresponding natural frequencies are, respectively, 1.04 Hz and 1.55 Hz [8]. In addition, the bridge FE model was established using BEAM 188 elements in the software ANSYS. In the bridge, high strength bolts are utilized for member connections, which are assumed as fixed in the FE model. In addition, considering that concrete piers and abutments of the bridge are much more rigid compared to the truss, only the superstructure was modeled. The calculated natural frequencies of the two fundamental modes are found to be 1.03 Hz and 1.55 Hz. Thus, very good agreement is achieved between the measured and computational modal parameters.
The dynamic stresses of major bridge members were monitored during the passage of a passenger train (see Fig. 1). This specific train, consisting of one locomotive and 12 passenger cars, passed through the bridge at the speed of 67 km/h. The length of the train is 340 m, and static axle loads of the locomotive and passenger car are, respectively, 230 kN and 154 kN.
The Class 5 track irregularities proposed by the U.S. Federal Railway Administration were included in the vehicle-bridge system model to predict the stress time histories. Fig. 2 shows the predicted and measured stresses in bridge members highlighted in Fig. 1. The field data have been processed with a low pass filter of 30 Hz. It can be observed that for all the investigated members, good agreement is achieved between the numerical result from the vehicle-bridge system model and the measured counterpart from the field inspection. This coincidence indicates that the system model established is capable of accurately predicting the dynamic stress response of railway bridges under moving train loads.
4. Results: fatigue damage and remaining life
Fatigue trains running in the history of the Baihe Bridge are identified based on the traffic survey in [9]. According to this survey, passenger trains, consisting of 1 locomotive and 20 cars, passed the bridge 22 times per day, while freight trains, composed of 2 locomotives and 43 cars, passed the bridge 28 times per day. Considering the movement to raise the speed of railway travel in China which started in 1997, the loading history of the Baihe Bridge is divided into two different periods, namely, period I (1980-1997) and period II (1998-2014). Moreover, it is assumed that speeds of the passenger and freight trains during time period I are, respectively, 50 km/h and 40 km/h, whereas the corresponding values for time period II are 70 km/h and 60 km/h, respectively. These speeds, along with the Class 5 track irregularities, are used to perform dynamic analyses of the coupled train-bridge system.
Fig. 2Predicted and measured dynamic stress time histories in bridge members
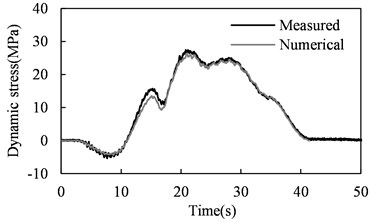
a) Upper chord
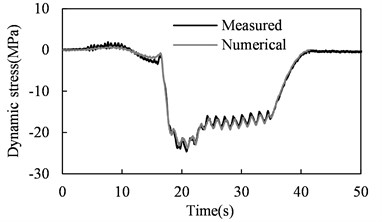
b) Diagonal
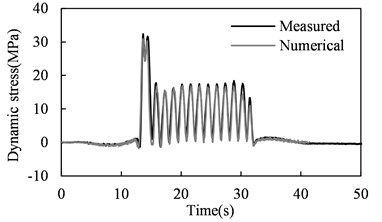
c) Vertical web member
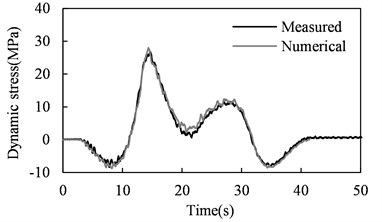
d) Lower chord
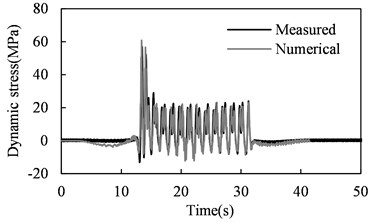
e) Stringer
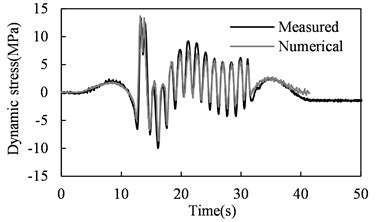
f) Floor beam
It can be observed from Fig. 2 that the stringer is the fatigue-critical member, experiencing most significant stress variations. The associated structural detail is the high strength bolted floor-beam-to-stringer connection. The fatigue resistance of this detail can be represented by S-N lines proposed in several current codes (see Fig. 3).
Fig. 3S-N lines in different codes for the high strength bolted connection
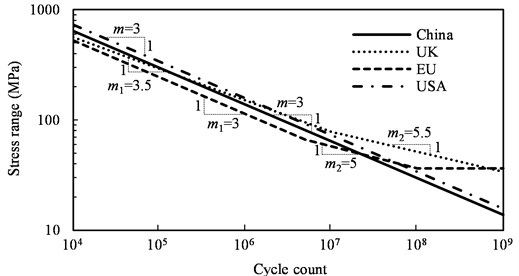
The accumulated fatigue damage can be calculated by using Eq. (6). Based on the obtained damage index, the remaining fatigue life of the investigated detail is estimated, assuming that no traffic evolutions occur in the future (i.e., after 2014). The associated results are reported in Table 1. Significant differences in the predicted fatigue life can be observed. Most of the stress ranges in the Baihe Bridge generated by passenger and freight trains lie in the range of 0-30 MPa, where S-N lines in Fig. 3 significantly differ from one another. In particular, the British line leads to over 500 years of remaining life, which is far more than those from the other three lines. This indicates that S-N lines for fatigue evaluation should be properly selected, since they can have a significant impact on the results.
Table 1Fatigue damage and remaining life of the stringer
S-N line | Fatigue damage per year | Remaining life | |
Period I (1980-1997) | Period II (1998-2014) | ||
China [3] | 0.01979 | 0.01245 | 35 |
UK [4] | 0.00304 | 0.00075 | >500 |
EU [5] | 0.01633 | 0.00504 | 123 |
USA [6] | 0.01324 | 0.00833 | 74 |
5. Conclusions
This paper presented a procedure for fatigue assessment of steel railway bridges, integrating a vehicle-bridge system model into the identification of load effects. The model was verified with the field data obtained from a real bridge, and good agreement is achieved. By employing the verified model for coupled dynamic analyses of the train-bridge system, fatigue stresses were computed. The fatigue damage and remaining fatigue life of the bridge were subsequently estimated based on the S-N approach. The inclusion of the system model enables accurately predicting the fatigue load effects, and therefore, effectively assessing fatigue behavior of existing bridges. In addition, S-N lines can have a significant impact on the projected fatigue life. Consequently, they should be properly selected.
References
-
Imam B., Yahya N. Dynamic amplification factors for existing truss bridges for the purposes of fatigue assessment. The 9th International Conference on Structural Dynamics, Portugal, 2014, p. 1273-1280.
-
Li H. L., Xia H., Soliman M., Frangopol D. M. Bridge stress calculation based on the dynamic response of coupled train-bridge system. Engineering Structures, Vol. 99, 2015, p. 334-345.
-
Code for Design on Steel Structure of Railway Bridge. Ministry of Railway China (TB 10002.2-2005), Beijing, 2005.
-
Steel, Concrete and Composite Bridges: Part 10: Code of Practice for Fatigue. British Standards Institution (BS 5400), London, 1980.
-
Design of Steel Structures: Part 1-9: Fatigue. European Committee for Standardization (EN 1993-1-9 Eurocode 3), Brussels, 2005.
-
AASHTO LRFD Bridge Design Specifications. Washington, D.C., 2008.
-
Xia H., De Roeck G., Goicolea J. M. Bridge Vibration and Controls: New Research. Nova Science Publishers, New York, 2011.
-
Hou Y. F., Yang Z. M., Zhang N. Report on the Routine Inspection of the Baihe Bridge in Jing-Tong Railway Line, Report No. 24. Beijing Railway Bureau Beijing, 2012, (in Chinese).
-
Zhang Y. L., Xin X. Z., Cui X. Updating fatigue damage coefficient in Railway Bridge design code in China. Journal of Bridge Engineering, Vol. 17, Issue 5, 2012, p. 788-793.
About this article

This study was sponsored by the Fundamental Research Funds for the Central Universities (Grant No. C15JB00300) of China.
