Abstract
Coastal bed profile change is described by bed load, pick-up, and settling on a boundary-fitted moving grid. Existing bed load formula is modified by changing threshold bed shear stress to reflect local bed slope. A numerical model system adopting the above function is developed to simulate cross-shore sediment transport around swash zone with steep bed slope as well as surf zone. The model system adopts a moving boundary grid which fits bed boundary slope, and other horizontal grid lines are parallel to the bed grid line. The model system is composed of flow module and sediment transport module. The flow module solves continuity equation and Reynolds-average Navier-Stokes momentum equations in intra-wave-phase manner. The flow module provides detailed flow information including near-bed fluid velocity which varies asymmetrically within a regular wave period near sea-bed and wave-phase average undertow profile of main fluid body including wave boundary layer. The sediment transport module solves sediment mass conservation equation. Exchange of sediment mass between bed itself and fluid column containing suspended sediment happens through pick-up and deposition. Wild bed level undulation is controlled by using a smoothing method. Model system is applied to two extreme cases of sand experiments by Kajima et al., and reasonable agreements between measurements and computations are obtained for both onshore-dominant and offshore-dominant cases.
1. Introduction
Sand or gravel beach functions as important protection barrier against severe natural forces, as well as pleasant place for leisure. Some coastal zones are muddy where waves are not high, which is outside of our interest in this paper. Understanding of sediment transport is the first step to preserve coastal zone.
Sediment transports in both alongshore and cross-shore directions. Even if alongshore sediment transport amount is known, and shoreline movement is roughly guessed with some stable equilibrium profile concept, we are sometimes interested in short-term cross-shore sea-bed profile change affected by complex interaction between waves, tide, and morphology, e.g. beach profile change after artificial nourishment.
Accuracy of prediction of sediment transport and morphological change depends on quality of prediction methodology. Field sediment transport is often described by combination of alongshore transport and cross-shore transport. Although field waves are short-crested random waves, a general prediction tool should be able to reproduce morphological change for monochromatic or long-crested random wave conditions at laboratory as well.
Common field bed material is relatively poorly-sorted, while laboratory experiment can use artificially chosen sediment material like well-sorted sand. When poorly-sorted material is used at laboratory experiment, sediment starts sorting along beach profile; i.e. swash zone gets coarser, and underwater zone gets finer. Eventually an equilibrium state on median grain size distribution along profile will develop similarly to field environment, but obtaining final equilibrium grain sorting at laboratory may take very long time depending on initial condition, and driving force strength. Grain size sorting is not considered in this study.
Prediction of sediment transport and profile change in the swash and surf zone involves several stages, and thus a methodology for profile change prediction could be called a system. Methods are deterministic, or empirical, but most of them describe individual or combined processes. Information on fluid flow side can be obtained from either direct simulation or from parameterised methods, while information on sediment transport side is obtained from mostly empirical formulas based on statistical analysis of measurements at laboratory or field.
Sediment transport is described by two aspects: sediment movement within fluid body, and sediment exchange between fluid body and sediment-laid sea-bed.
An example of the simplest end of prediction system may be lump-sum formulas for total alongshore sediment transport rate at cross-shore section. Likewise, objects related to cross-shore profile include equilibrium beach profile concept [1], index for typical beach shape type [2], index for existence of offshore bar [3] and beach-face slope [4]. However, these approaches do not provide detailed profile change information.
The detailed end of the prediction system for cross-swash zone profile change may be intra-wave-phase approaches. From fluid flow point of view Navier-Stokes equation or Reynolds--averaged equation solver is the most detailed approach. It is not yet feasible to use fluid molecule-sized grid. It is known that limitations exist in this direction, e.g. on grid size, computational time, and numerical error. The finer the grid size, the longer cpu. From sediment transport within fluid body point of view sediment particle tracking would be the utmost detailed approach. Schmeekle [5] computed fluid flow and tracked individual sediment particles on a fine three-dimensional grid to investigate bed load. However, Schmeekle used uniform-sized spherical sediment particles instead of real irregularly angular sediment particles, which may behave much differently from true sediment particles, and may not accurately reproduce bed form development or decay. Density of suspended sediment has often been expressed by suspended sediment concentration, and suspended sediment mass conservation is expressed by the equation including advection-diffusion-settling terms of the suspended sediment concentration.
Most cross-shore profile change prediction systems are between the two extreme ends. Some systems adopt a number of parameterisations for flow and sediment transport, while others adopt direct simulation of flow field and some empirical formulas for sediment transport. Existing prediction systems include CROSMOR [6], XBEACH [7], CSHORE [8], each of which has its own combination of process parameterisations.
Individual processes included in prediction systems have also been independently studied. Thus an existing prediction system could be upgraded by adopting a new development of specific processes. Processes involved in cross-shore profile prediction can be classified into two groups, i.e. fluid flow-related one, and sediment-related one.
Fluid flow-related individual processes include wave transformation before and after breaking in shallow water [9-10], skewness of water level variation, or asymmetry of near-bed wave-induced orbital velocity variation, wave breaking condition, type, position, and cross-shore wave height distribution after breaking, wave breaking-induced turbulence, horizontal or vertical dispersion, rup-up limit and height, sea-bed shear stress due to wave [11], mass transport due to wave [12], undertow, effect of groundwater or tidal level, infiltration and exfiltration, and infra-gravity wave.
Sediment-related individual processes include phase lag between bed shear stress and orbital velocity [13], pickup, bed load, suspended sediment concentration at reference level, threshold bed shear stress of non-cohesive sediment [14], settling velocity of sediment particle, deposition, hindered deposition, horizontal and vertical diffusion [15], bed-form formation or change, and vortex entrainment over bed-form [16]. The above processes have been parameterised or directly simulated depending on system.
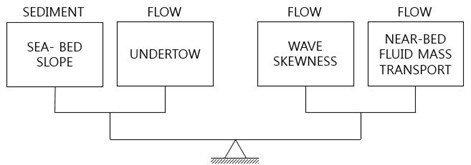
On-offshore bed profile at swash zone with relatively steep sea-bed slope is balanced by onshore sediment transport and offshore sediment transport. We can list that two major onshore-transport-driving factors are fluid velocity skewness due to non-linear wave deformation, and near-bed onshore fluid mass transport. Wave-breaking-induced pressure impact or turbulence energy may also contribute to the onshore sediment transport. On the other hand two major offshore-transport-driving factors are sea-bed slope, and undertow produced by wave breaking in surf zone. The sea-bed slope is a sediment-related parameter, while the others are flow-related parameters, see Fig. 1.
Fig. 1Major factors contributing to onshore and offshore sediment transport
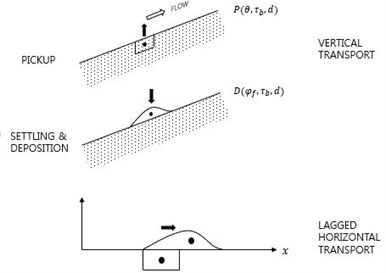
There have been arguments on distinction of bed load and suspended load. Bed load is often known as sediment movement pattern of rolling, sliding and saltation. However, as sea-bed is mostly covered by bed-forms like ripple or dune, it is more difficult to divide bed load over bed-forms. Sediments on ripple crest surface are lifted, shoot over the crest into vortex grown between ripple troughs, lifted backwards with the vortex itself when flow reverses, and released from the vortex after that [16]. Here we define bed load as instant horizontal sediment response to external driving force, and pick-up as vertical upward sediment movement driven by external force, which involves phase-lag between the force and the sediment transport, see Fig. 2.
Fig. 2Two sediment transport modes: vertical and horizontal movements
Niroshinie et al. [17] developed a relatively detailed intra-wave-phase profile prediction system, which is composed of a flow module with large eddy simulation and a sediment transport module with advection-diffusion of the suspended sediment concentration, pickup, and deposition. They did not include bed load in their prediction system. They adopted an inclined fixed grid to obtain smooth flow output along bed surface. Flow module in their system automatically produces wave skewness, wave-induced near-bed undertow above wave boundary layer. However, their inclined model grid cannot expand to offshore side with milder bed slope, and thus it is hard to provide accurate wave condition at offshore boundary. Furthemore their fixed grid cannot be used to simulate thick bathymetric change involving bottom boundary grid point removal or attachment. They didn’t take local sea-bed slope into account, which may influence final equilibrium profile shape of swash zone. They compared laboratory experimental results with their numerical model results at the elapsed time of 30 seconds, and showed rapid bed level oscillation during the time. Their prediction system seems a preliminary result and may need further validation for longer time of bathymetric change.
In this study a detailed intra-wave-phase prediction system is developed to simulate bathymetric change more naturally. A moving-boundary-fitted grid is adopted to simulate thick bathymetric change in this study. Fluid flow is computed resolving wave period by solving continuity and Reynolds-average momentum equations in vertical domain with a mixing length closure for turbulence. Sediment transport is computed by solving the concentration advection-diffusion equation in water body; bed load, pickup and deposition at fluid-bed interface. The bed load and pickup function are modified to account the sea-bed slope.
2. Model system
Model system for CROSS-shore profile development with Moving Grid (CROSS-MG in short) proposed here is composed of three modules: flow, suspended sediment transport, and bathymetric change modules. The modules interact with each other at user-specified time steps.
2.1. Flow module
Fluid flow is basically three-dimensional due to three-dimensionality of turbulence. However, two-dimensional simulation might be acceptable to represent a flow field, if the flow is uniform in one redundant direction like flow within a uniform sectional flume. The flow module simulates free-surface gravity wave motion of incompressible fluid in - domain.
The governing equations of the flow module are the continuity equation and two momentum equations in two directions. The continuity equation for incompressible fluid reads:
where is the fluid velocity in the direction, is the fluid velocity in the direction, is the longitudinal horizontal direction, and is the upward vertical direction. The Reynolds-averaged Navier-Stokes equations, and the eddy viscosity are introduced as:
where is the fluid density; is the pressure; , and are the turbulent eddy viscosity in the and directions, respectively; and is the gravitational acceleration.
The position of free water surface is computed by using the volume-of-fluid (VOF) method.
The above governing equations have often been solved with a fixed, rectangular grid, see Fig. 3(a). For simulation of morphological change, fixed grid cannot follow micro-scale bed level change with a finite-sized grid height. It is useful for computation of flow around fixed bed morphology only.
Another group tried to introduce partially full grid concept at the liquid-soil interface, see Fig. 3(b)-(c). Fig. 3(b) allows partially full grid with flat or vertical border, and Fig. 3(c) allows partially full grid with a linearly sloped border [18]. These trials may produce continuous flow pattern around the partially full grid, but they have not yet been proved to produce smooth flow-related physical properties like bed shear stress, which acts an important role for a computation of sediment transport and morphologic change, an existing bed-boundary-fitted grid, sigma-coordinate fails for short period waves, especially for waves with overturning crests, which is not good for present purpose.
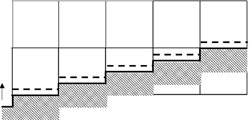
In order to simulate sediment transport at coastal zones a bed-boundary-fitted grid is adopted here, see Fig. 3(d). A typical coastal beach profile may be expressed as Fig. 4 when this new grid is adopted.
Fig. 3Merits and demerits of grid systems for simulation of morphologic change
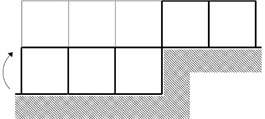
a) Bed level rises by a grid size
b) Partial grid with flat level
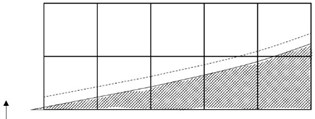
c) Partial grid with slope
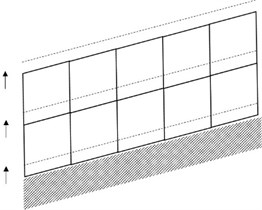
d) Grid moves as accretion or erosion height
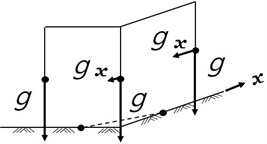
The bottom line of the new grid follows the slowly-moving bed profile, and the other higher grid points move in parallel with the bottom grid line. The vertical grid border lines are in the direction. The bottom grid line is folded with a small angle every delta . It is assumed that the grid moving speed is not large, and the folding angle at every horizontal grid point remains small, either. Coastal geography is not flat, but sloped or wavy. In most cases coastal bed slope does not exceed a certain value, unless non-erodible rocks are around. The steepest slope is often observed at swash zone along cross-shore profiles, and is smaller than the angle of repose for still water condition. The folding angle at every horizontal grid point interval is limited to 10° (slope = 0.18). To simulate wave transformation through curvy grid lines with no discontinuity in pressure distribution, gravity is modified: additional gravity, , in the direction is added in the momentum equation along grid columns, see Fig. 5.
The speed of morphological change due to deposition or erosion is not fast, and therefore the whole grid adjusts to slowly varying bed profile every time step. Then, the above governing equations become:
The turbulent eddy viscosity is modelled by a mixing length hypothesis, which has been known to be useful for flows near plane wall boundary [18]. Kim et al. [19] adopted the mixing length hypothesis with a substitution of the vertical gradient of horizontal fluid velocity () with fluid deformation () for flows over wavy bed form. The mixing length can be approximated by the vertical distance from the point of interest to the nearest bed surface, if bed slope is not steep. The eddy viscosity is assumed isotropic. Then:
where is the mixing length, is the von Karman constant (= 0.4), is the distance between the internal point and bed surface, and is the water depth.
Fig. 4New grid system adapted for present model system: whole grid levels change in the vertical direction depending on bed level change
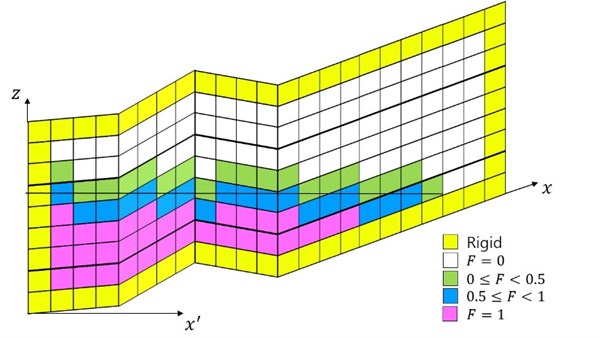
a) New boundary-fitted parallelogram grid and axis . Air-water interface is expressed by two kinds of grids, 0.5 and 0.5, where is volume-fill ratio
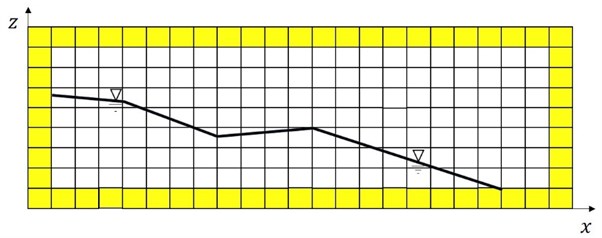
b) Distorted viewing of still water level with axis
Fig. 5Artificial gravitational acceleration induced in the momentum equation
Based on operator splitting theory [20], each of the above two momentum equations are split into two equations:
where superscripts *, ** express the first and second split operators, respectively. Eqs. (6) and (8) are solved by using the first order upwind scheme, and Eqs. (7) and (9) are solved by using a time-forward, space-centered scheme.
The pressure is then computed by using the SOLA method [21] with coincident adjustment of velocity field. The present model uses a fixed coefficient (= 0.8) for pressure-divergence adjustment instead of using over relaxation parameter of the SOLA:
Newton’s second law of motion is used for pressure adjustment instead of fluid compressibility for compressible fluid flows:
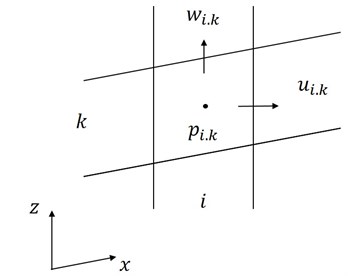
where is the divergence , subscripts , are indices for variables in grid points in a staggered grid in the and directions, respectively, see Fig. 6.
Fig. 6Staggered grid for the present flow model
2.2. Sediment transport module
Sediment transport is computed including the suspended sediment load, and the bed load. The suspended sediment transport describes sediment movement in suspended mode subject to flow conditions. On the other hand, the bed load is defined as instantaneous horizontal response to imposed shear stress on the bed surface.
The suspended sediment is often expressed as concentration, and governed by sediment mass conservation, which reads:
where is the suspended sediment concentration [kg/m3]; is the settling velocity of sediment particles; , are the diffusion coefficients of the suspended sediment concentration in the , directions, respectively.
There is an interface between water column containing the suspended sediment and the deposited bed, where deposition moves sediment from the water column onto the bed, and pickup moves sediment from the bed into the water column. The deposition rate is computed from settling of suspended sediment as:
where is the deposition rate [kg/m2s], and is the coefficient to take into account hindered settling due to high concentration near the bed (unity for low concentration), and is the probability function.
The bed load is related to both flow and bed sediment properties including bed shear stress. The bed shear stress acting on the bed surface exerted by flow can be approximated by fluid particle near-bed velocity under assumption of constant shear stress profile or equilibrium logarithmic velocity profile within thin boundary layer, that is:
where is the bed shear stress, is the instantaneous current friction coefficient (=), is the von Karman constant (= 0.4), is the one thirtieth of bed roughness, and is the fluid horizontal particle velocity at level z from the mean bed level.
As we look in inter-wave-phase sediment movement, we need a prediction formula for instantaneous bed load.
Some existing empirical formulas for bed load are for wave-phase-average bed load at wave-current environment, while other existing formulas are for steady current. We need not distinguish empirical bed load formula for steady current or for instantaneous current, if our approach resolves the wave phase. Meyer-Peter and Muller [22], Bagnold [23], and van Rijn [24] proposed empirical formulas of bed load for current, all of which have a similar form as:
where is the bed load [kg/ms], is the scaling coefficient, is the bed shear stress, is the critical shear stress needed for initiation of motion of a specific or representative grain size, and n is the empirical power. Non-dimensional form is practically used for arbitrary bed grain size, and more universal coefficient:
where is the non-dimensional bed load; is the scaling coefficient; are non-dimensional bed shear stress, and critical shear stress, respectively. Van Rijn’s [24] bed load formula is adopted here:
where is the sediment density, is the fluid density, is the median diameter [m], is the gravitational acceleration, is the fluid kinetic viscosity, is the bed shear stress, and is the critical shear stress for initiation of motion.
Bed load with instantaneous response to the external force is believed to be affected by the local bed slope. Some researchers suggested modification of the critical motion-initiating bed shear stress due to the local bed slope [25-27]. Dey analyzed their laboratory data, and proposed the following formula:
where , are bed slopes in the , directions, respectively; and is the angle of repose. For flows in two-dimensional vertical domain, the second part of Eq. (23) disappears.
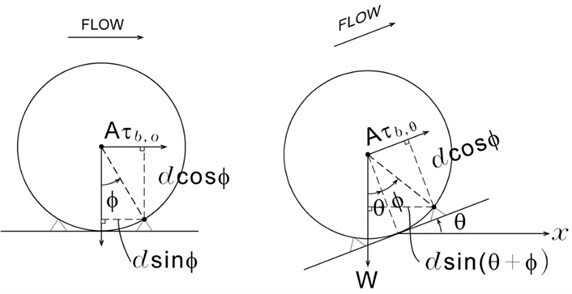
For the present study we look in the problem from mechanical point of view instead of analysis of experimental data. Assume a situation that a cylinder is laid on a flat bed. Two moments balance i.e. overturning moment due to flow shear force, and resisting moment due to gravitational force, see Fig. 6. There is a pivot on a cylinder surface at the angle of repose on the vertical line from cylinder centre. Now we consider a case when flow is upward over a sloped bed. The resisting moment due to gravity is increased because of the expanded distance of action of the force to the vertical line from the cylinder centre. Thus, the critical overturning moment becomes larger. On the other hand for downward flow the resisting moment becomes smaller. This modification of resisting moment can be expressed as:
where is the upward bed slope. If bed slope is downward angle of repose (= ), the critical shear stress becomes zero as the above equation. Therefore, we modify Eq. (17) by replacing with by using the relationship between the two in Eq. (24).
Fig. 7Effect of bed slope on critical bed shear stress for initiation of motion
The pickup rate has similarity to the bed load from the point that the initiation of motion is suppressed, if the bed shear stress is below the critical value, , and is more or less proportional to the bed load. Partheniades [28], Nielsen [29], and van Rijn [30] proposed formulas for instantaneous pickup rate in the following form as:
However, the pickup is vertical movement, and therefore empirical coefficient and unit are different from those of bed load. We use the following modified van Rijn’s formula for pickup rate by adding an additional coefficient, as:
where is the reference level concentration [volume/volume], and is the reference level above mean bed.
2.3. Bathymetric change module
Bed level change is computed from the total sediment mass conservation with sediment mass exchanges to and from water column:
where is the bed level [m], is time [s], is the void ratio of bed sediment, is the pure sediment density [kg/ m3], is the deposition rate [kg/m2s], is the pickup rate [kg/m2s], and is the bed load [kg/ms].
Bathymetric change is computed periodically, and extrapolated with a multiplication factor for simulation of long term change. When the bed slope at a part of the bed profile exceeds the underwater angle of repose, the bed profile is modified by using a moving boundary filter. Interim profile is further treated by using the moving-average filter multiple times as needed.
3. Model system applications and results
The flow module won preliminarily tested on a still water condition, and showed no movement of water as expected.
Majority of previous numerical works on on-offshore profile modelling have been about the erosion type profile changes so far. Initial condition of constant slope has often been used for laboratory experiments, and fast profile change was accompanied at the beginning stage because constant slope does not represent an equilibrium state.
The model system is applied to two sets of previous experiments of Kajima et al. [31] at a large wave tank for regular waves. Water depth for the two experiments was 4.5 m. The conditions of the two select sets of experiments are shown in Table 1.
Table 1Select experimental cases carried out by Kajima et al. (1982) at large wave tank
Case | Wave height, (m) | Wave period, (s) | Median grain size (m) | Bed slope () | Offshore water depth (m) | Duration (hr) |
1-3 | 0.95 | 9.0 | 0.000470 | 0.05 | 4.5 | 69.5 |
3-4 | 1.62 | 3.1 | 0.000270 | 0.05 | 4.5 | 76.1 |
Table 2Numerical parameters used for simulation of Cases 1-3 and 3-4 of Kajima et al. [31]
Case | Delta (m) | Delta () (m) | Delta () (s) |
1-3 | 0.2 | 0.2 | 9.0/256 |
3-4 | 0.2 | 0.2 | 3.1/128 |
The above two cases may be two opposite typical cases from the sediment transport direction point of view. Case 1-3 corresponds to the accretion type (Type III), and Case 3-4 corresponds to the erosion type (Type I) according to Sunamura and Horikawa’s [2] classification. Similar numerical parameters are used for Cases 1-3 and 3-4 of Kajima et al. [31], see Table 2.
Fig. 8Initial folded coordinate for simulation of Cases 1-3 and 3-4 laboratory experiments of Kajima et al. [31]
![Initial folded coordinate for simulation of Cases 1-3 and 3-4 laboratory experiments of Kajima et al. [31]](https://static-01.extrica.com/articles/16641/16641-img12.jpg)
a) True profile
![Initial folded coordinate for simulation of Cases 1-3 and 3-4 laboratory experiments of Kajima et al. [31]](https://static-01.extrica.com/articles/16641/16641-img13.jpg)
b) Distorted profile
3.1. Computation results of Case 1-3
Measured new bed profile of Case 1-3 at 69.5 hours from the start is shown in Fig. 8. Computed water level and pressure distribution, and the particle velocity vector field at a wave phase after 30 waves are shown in Figs. 9-10. Computed results are presented in - domain for convenience. Acceleration parameter of 1500 was applied to the bed level change speed.
Fig. 9Measured cross-shore profile change after 69.5 hours of wave action for Case 1-3 of Kajima et al. [31]
![Measured cross-shore profile change after 69.5 hours of wave action for Case 1-3 of Kajima et al. [31]](https://static-01.extrica.com/articles/16641/16641-img14.jpg)
Fig. 10Computed pressure after 30 waves after 30 waves

In order to reduce computational load, the bed level change speed was accelerated by using a scaling factor (multiplication factor). The laboratory experiments lasted 69.5 hours, but only 30 waves were run for numerical modelling. After every 15 waves bed profile change was allowed with the acceleration factor.
Generated waves on flat bed propagate over sloped profile, and get broken as spilling type. Fluid particle velocity near the seabed is affected by the bed friction.
Computed phase-average horizontal velocity component (residual current) profile at 80 m after 30 waves is shown in Fig. 11. The residual current near water surface is more onshore-ward, while the residual current near bed is more offshore-ward.
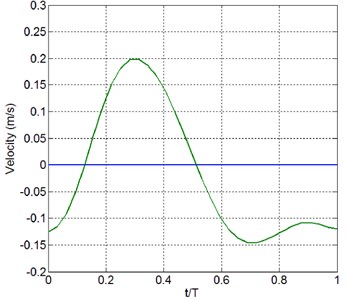
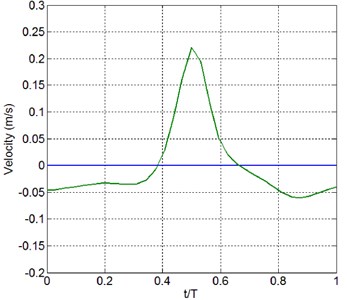
Asymmetry of temporal near-bed particle velocity variation with respect to mean sea level has been known as one of the important factors affecting the direction of net sediment transport on cross-shore profile. Previous research results described typical pattern as strong onshore current for a short term, and weak offshore current for a long term [29], in other words asymmetric speed with respect to the mean water level drives on-shore sediment transport. Computed near-bed velocity variation at a point shows this asymmetry, see Fig. 12. The computed near-bed velocity asymmetry at a point within a swash zone within a wave period is considered to include the effect of enhanced turbulence due to wave breaking.
Fig. 11Computed particle velocity vector field after 30 waves

Fig. 12Computed residual horizontal velocity profile at x'= 80 m after 30 waves
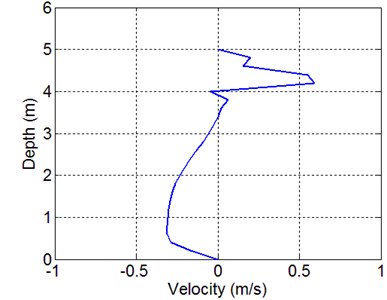
Fig. 13Computed near-bed particle velocity variation within a wave period after 30 waves
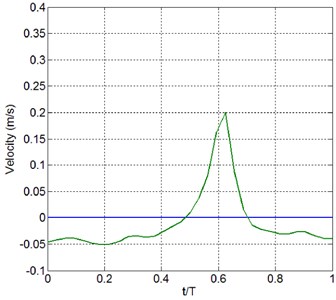
a)86.4 m
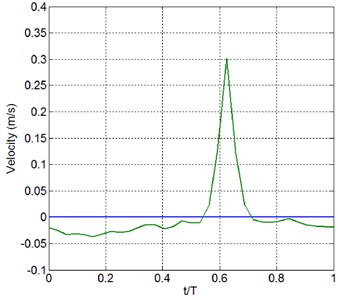
b)40 m
Computed wave-phase-average suspended sediment concentration distribution in the domain after 30 waves is shown in Fig. 13. The suspended sediment concentration is high near eroded zone, and it settles down quickly around the eroded zone.
Computed bed profile with measured one after 69.5 hours are shown in Fig. 14. The trend of accretion at onshore zone was well reproduced. The computed eroded position and the maximum erosion depth of 0.55 m were reasonably reproduced compared to measured erosion depth of about 0.77 m. The computed accretion position and the maximum accretion height of 0.89 m were also well reproduced, compared to measured accretion of about 1.02 m. It is thought that the model system satisfactorily reproduced the sediment transport and following bed profile change for this case.
Fig. 14Computed wave-phase-average suspended sediment concentration field after 30 waves

3.2. Computation results of Case 3-4
Case 3-4 is for a setting with higher wave height, shorter wave period, and finer grain size. Measured bed profile change of Case 3-4 at 76.1 hours is shown in Fig. 15. Waves break earlier than Case 1-3, and the asymmetry of the orbital velocity is not prominent, and therefore doesn’t much enhance the onshore sediment transport in this case.
The computed water level and pressure distribution, and the particle velocity vector field at a wave phase at the beginning stage and after 30 waves are shown in Figs. 16-17. Computed results are presented in - domain for convenience. The acceleration parameter of 4750 was applied to the bed level change speed, respectively.
Fig. 15Computed bathymetric change after 69.5 hours waves for Case 1-3
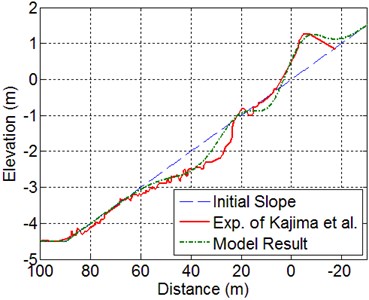
Fig. 16Measured cross-shore profile change after 76.1 hours of wave action for Case 3-4 of Kajima et al. [31]
![Measured cross-shore profile change after 76.1 hours of wave action for Case 3-4 of Kajima et al. [31]](https://static-01.extrica.com/articles/16641/16641-img22.jpg)
Fig. 17Computed pressure after 30 waves

Computed phase-average velocity (residual current) vector profile at 80 m is shown in Fig. 18. The residual current near water surface is more onshore-ward, while that near bed is more offshore-ward.
Near-bed velocity variation within a wave period for Case 3-4 is also asymmetric with respect to the mean water level, but the asymmetry is weaker then Case 1-3, see Fig. 19.
Computed wave-phase-average suspended sediment concentration distribution in the domain after 30 waves is shown in Fig. 20. The suspended sediment concentration is high near eroded zone, and it settles down around the eroded zone.
Fig. 18Computed particle velocity vector field after 30 waves

Fig. 19Computed residual horizontal velocity profile at x= 80 m after 30 waves
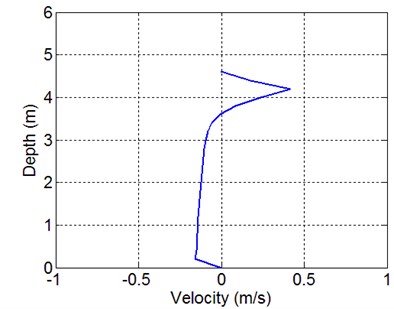
Fig. 20Computed near-bed particle velocity variation within a wave period after 30 waves
a)86.4 m
b)40 m
Fig. 21Computed wave-phase-average suspended sediment concentration field after 30 waves

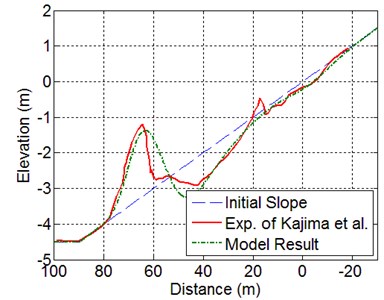
Computed bed profile with measured one after 76.1 hours is shown in Fig. 21. The trend of eroded onshore zone and offshore bar formation were well reproduced. The computed eroded position and the maximum erosion depth of 0.99 m were reasonably reproduced compared to measured erosion depth of about 0.81 m. The computed accretion position and the maximum accretion height of 1.82 m were also well reproduced, compared to measured accretion of about 2.04 m. It is thought that the model system satisfactorily reproduced the sediment transport and following bed profile change of Case 3-4, as well.
Fig. 22Computed bathymetric change after 76.1 hours for Case 3-4
4. Conclusions
A numerical model system was developed for specific purpose to simulate swash and surf zone profile change in this paper. The model adopts a moving boundary-fitted, parallel, non-orthogonal grid composed of parallelogram grid cells. The new governing momentum equation includes additional artificial gravity terms in the sloped axis. The new model system adopted an additional method to reflect the bed slope, which modifies the critical initiation bed shear stress.
The model system was applied to two existing laboratory experimental cases, and model results reproduced both erosion-dominant, and accretion-dominant laboratory at swash zone results reasonably well.
More tests of the present model system are needed to increase its reliability further. It could expand its usage to random wave cases, field situations, and three-dimensional problems in the future.
References
-
Bruun P. Coastal Erosion and the Development of Beach Profiles. Technical Memorandum No. 44, Beach Erosion Board, Coastal Engineering Research Center, US Army Engineer Waterways Experiment Station, Vicksburg, MS, 1954.
-
Sunamura T., Horikawa K. Two-dimensional beach transformation due to waves. International Conference on Coastal Engineering, Vol. 1, Issue 14, 1974, p. 920-938.
-
Wijnberg K. M. On the systematic offshore decay of breaker bars. International Conference on Coastal Engineering, 1996, p. 3600-3613.
-
Kim H., Hall K., Jin J.-Y., Park G.-S., Lee J. Empirical estimation of beach-face slope and its use for warning of berm erosion. Journal of Measurements in Engineering, Vol. 2, Issue 1, 2014, p. 29-42.
-
Schmeekle M. W. Numerical simulation of turbulence and sediment transport of medium sand. Journal of Geophysical Research: Earth Surface, Vol. 119, Issue 6, 2014, p. 1240-1262.
-
Van Rijn L. C. Unified view of sediment transport by currents and waves. IV: Application of morphodynamic model. Journal of Hydraulic Engineering, American Society of Civil Engineers, Vol. 133, Issue 7, 2007, p. 776-793.
-
Rooijen A. A. V. Modelling Sediment Transport in the Swash Zone. M.Sc. Thesis, Delft University of Technology, The Netherlands, 2011.
-
Johnson B. D., Kobayashi N., Gravens M. B. Cross-Shore Numerical Model Cshore for Waves, Currents, Sediment Transport and Beach Profile Evolution. No. ERDC/CHL-TR-12-22. Engineer Research and Development Center, Vicksburg, Coastal and Hydraulics Lab, 2012.
-
Kim H., Jang C. Inhomogeneous Helmholtz equation for water waves on variable depth. Journal of Korean Society for Marine Environmental Engineering, Vol. 13, 2010, p. 174-180.
-
Kim H., Jang C. Water wave propagation equation from expanded form of Leibniz rule. Korean Society of Civil Engineers, Vol. 17, Issue 2, 2013, p. 257-261.
-
Kim H. Temporal variation of suspended sediment concentration for waves over ripples. International Journal of Sediment Research, Vol. 18, Issue 3, 2003.
-
Kim H., O’Connor B. A., Park I., Lee Y. Modeling effect of intersection angle on near bed flows for waves and currents. Journal of Waterway, Port, Coastal and Ocean Engineering, Vol. 127, Issue 6, 2001, p. 308-318.
-
Aagaard T., Black K. P., Greenwood B. Cross-shore suspended sediment transport in the surf zone: a field-based parameterization. Marine Geology, Vol. 185, 2002, p. 283-302.
-
Shields A. Application of similarity principles and turbulence research to bed-load movement. Mitteilungen der Preussischen Versuchsanstalt fur Wasserbau und Schiffbau, Vol. 26, 1936, p. 5-24.
-
Kim H., Jang C. Vertical suspended sediment diffusivity for uniform currents. Korean Society of Civil Engineers, Vol. 17, Issue 6, 2013, p. 1496-1501.
-
Kim H., O’Connor B. A., Kim T. H., Williams J. J. Suspended sediment concentration over ripples. International Conference on Coastal Engineering, 2000, p. 2873-2885.
-
Niroshinie M. A. C., Suzuki T., Sasaki J. Numerical modeling of bed profile evolution using large eddy simulation. Journal of Coastal Research, Vol. 65, 2013, p. 350-355.
-
Manpaey F., Zhi-An X. Simulation and experimental validation of mould filling. Proceedings of the Modeling of Casting, Welding and Advanced Solidification Processes 7, London, 1995.
-
Prandtl L. Z. Bericht uber untersuchungen zur ausgebildeten turbulenz. Zeitschrift fur Angewandte Mathematik und Mechanik, Vol. 5, Issue 1, 1925, p. 136-139, (in German).
-
Kim H., Jang C. Effect of breaking in vertical diffusion coefficient. CMEM, Alicante, Spain, 2001.
-
Geiser J., Ewing R. E., Liu J. Operator splitting methods for transport equations with nonlinear reactions. Proceedings of the Third MIT Conference on Computational Fluid and Solid Mechanic, Cambridge, 2005.
-
Hirt C. W., Nichols B. D., Romero N. C. SOLA: A Numerical Solution Algorithm for Transient Fluid Flows. NASA STI/Recon Technical Report No. 75:32418, 1975.
-
Meyer-Peter E., Müller R. Formulas for bed-load transport. Proceedings of the 2nd Meeting of the International Association for Hydraulic Structures Research, 1948, p. 39-64.
-
Bagnold R. A. Flow of cohesionless grains in fluids. Proceedings of the Royal Society A, Vol. 249, 1956, p. 235-297.
-
Van Rijn L. C. Sediment transport, Part I: bed load transport. Journal of Hydraulic Engineering, American Society of Civil Engineers, Vol. 110, Issue 10, 1984, p. 1431-1456.
-
Dey S. Experimental study on incipient motion of sediment particles on generalized sloping fluvial beds. International Journal of Sediment Research, Vol. 16, Issue 3, 2001, p. 391-398.
-
Fuhrman D. R., Fredsøe J., Sumer B. M. Bed slope effects on turbulent wave boundary layers: 2. Comparison with skewness, asymmetry, and other effects. Journal of Geophysical Research, Vol. 114, Issue 3, 2009, p. 1-19.
-
Francalanci S., Solari L., Toffolon M. Local high-slope effects on sediment transport and fluvial bed-form dynamics. Water Resources Research, Vol. 45, Issue 5, 2009, p. 1-15.
-
Partheniades E. Results of Recent Investigations on Erosion and Deposition of Cohesive Sediments. Sedimentation, Fort of Collins, Colorado, 1972, p. 20-39.
-
Nielsen P. Sheet flow sediment transport under waves with acceleration skewness and boundary layer streaming. Coast Engineering, Vol. 53, 2006, p. 749-758.
-
Van Rijn L. C. Sediment pick-up functions. Journal of Hydraulic Engineering, American Society of Civil Engineers, Vol. 110, Issue 10, 1984, p. 1494-1502.
-
Kajima R., Shimizu T., Maruyama K., Saito S. Experiments of beach profile change with a large wave flume. International Conference on Coastal Engineering, American Society of Civil Engineers, 1982, p. 1385-1404.
About this article
This includes research results of “MIDAS” 2016 supported by Ministry of Oceans and Fisheries (Korea).
