Abstract
Non-stationarity in time series data is one of the most important challenges in signal processing nowadays. One of the most often cases occurs when signal is a mixture of different processes that reveal different statistical properties. Common way to deal with is the data segmentation. In the following paper we propose an automatic segmentation procedure based on gamma distribution approach. In the algorithm we estimate the parameters of gamma distribution for subsequent batches of distance values between consecutive impulses (waiting times). Then we use Expectation-Maximization algorithm to classify estimated parameters. Obtained classes refer to particular signal segments. Procedure has been applied to real vibration signal from roadheader working in underground mining industry.
1. Introduction
Key aspect of modeling and analysis of real-life signals is a possibility of obtaining the information about the considered process. Unfortunately, it is common that observed time series is characterized with high level of non-stationarity, which comes from the fact that it consists of different processes occurring subsequently. Typically, those processes cannot be described by the same model, because they reveal very different statistical properties. On the other hand, it is often seen that they can be described with the same type of model, but its parameters vary. Because of that, segmentation of the signal should be performed before any further analysis or modeling, and the aim is to extract parts of the signal with homogenous statistical properties. In the same time, extracted segments define points in time when properties change and signal switches to the other regime [1-4]. According to presented methodology, those properties of the signal can be estimated and then used multidimensionally as classification parameters.
Signal segmentation methods very often are dedicated to the applications they are used. We mention only methods related to speech analysis [5], condition monitoring for shocks isolation [6], seismic signal analysis [7], physics [3], machine performance analysis for operation modes separation [4] or biomedical signals [8].
In this paper we propose the segmentation algorithm based on modeling of empirical distribution function of waiting times between consecutive impulses by gamma distribution and clustering obtained parameters with Expectation-maximization (EM) algorithm. The gamma distribution has been chosen because of its closest similarity to empirical distributions derived from the data, as well as its theoretical predisposition to be used for modeling of waiting times.
2. Methodology
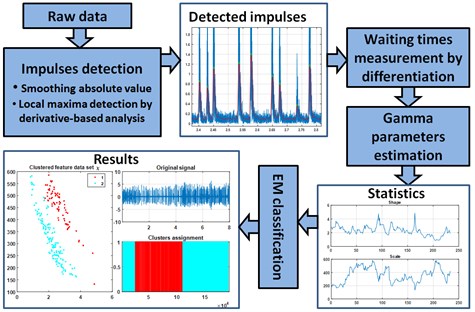
This section describes segmentation procedure presented in this paper. Firstly, impulses observed in the signal are identified and localized in time and distances between them are measured. Then parameters of gamma distribution related to shape and scale are estimated for those waiting times within a sliding window. This outputs two vectors of parameters, that are provided to the EM algorithm for clustering. Finally, post-processing translates clustering results into time segments containing signal parts that reveal homogenous statistical behavior. General schematic of the procedure is presented in Fig. 1. Key aspects are discussed in Sections 2.1-2.4.
Fig. 1Functional schematic of presented procedure
2.1. Impulses localization
To localize the impulses in time, firstly one needs to choose positive or negative side of the signal in terms of values. To choose positive side, absolute value of signal is performed. After that signal is smoothed with moving average with the window length equal to 160 samples to extract the general shape, and then the result is smoothed again with moving average with the window length equal to 70 samples, just to get rid of the smallest ripples that would interfere during the derivative analysis. Finally, localization of the impulses in time is performed as a simple derivative-based local maxima detection. When location of individual impulses is known, we can proceed to modeling their distances with gamma distribution.
2.2. Gamma distribution
There are many parameterizations of gamma distribution. In this paper we assume the random variable has gamma distribution with shape parameter and scale parameter if it has the following probability density function [9]:
This distribution has found many practical applications. It is especially important in the insurance theory, where individual claims are modeled by using gamma distribution [9]. In many research papers the gamma distribution is also considered as an appropriate one for modeling so-called waiting times in the continuous time random walk model (CTRW), [10].
2.3. Parameters estimation
When the real independent data are modeled by using gamma distribution, the most classical method that can be used to parameter’s estimation is the method of moments [9]. However, if the considered vector of observations is related to the waiting times, then the method of moments cannot be directly applied. The most commonly used method to identify the correct distribution in this case is visualization of empirical cumulative distribution function (CDF) on a plot with log-log scale and comparison with fitted parametric distribution [10]. However, a testing procedures which would allow to identify the correct class of distribution for observations corresponding to waiting times are very rarely considered in the literature. The difficulty arises from the discretization of the time intervals which is a natural consequence of time-discretization of measuring devices. Furthermore, standard estimation procedures like method of moments might lead to under- or overestimation of parameters.
In this paper we use an estimation procedure of gamma distribution parameters for waiting times proposed in [11]. This is a new method which is based on the distance between theoretical CDF and so-called rescaled modified CDF. The main issue during estimation of waiting times parameters comes from the fact that the exact waiting time is unknown and usually comes from continuous distribution. For example, if we observe that a character of the process has changed after 3 units of time, it is not known at which point of time the change actually happened, the correct value lies in the interval (2, 4). In other words, a constant time period equal to 2.5 might be classified as 2 or 3 with equal probability.
The estimators of gamma distribution parameters are calculated on the basis of the Kolmogorov-Smirnov distance for CDFs (theoretical and empirical one). More precisely, for vector of observations corresponding to waiting times we calculate first the empirical cumulative distribution function:
where denotes indicator of the set and , ,..., is a vector of observations of waiting times. In the next step we calculate the Kolmogorov-Smirnov statistic as follows:
where is rescaled modified CDF corresponding to gamma distribution. The estimators of parameters and are calculated such that they minimize the distance . More details one can find in [11].
2.4. Expectation-maximization algorithm
Expectation-maximization is an iterative optimization method for estimation of unknown parameters, given measured data and latent variables representing missing data. EM is particularly useful for separating mixtures of Gaussian distributions over the considered feature space. It consists of two main steps: Expectation (E-step) and Maximization (M-step), which are iterated until convergence [12-15].
In the first iteration algorithm has to be provided with some initial values of parameters It can be done by picking random means, covariances and distribution weights, but it is a good practice to pre-estimate means using some simpler algorithm like -means or hierarchical clustering, then compute covariance matrices basing on results of this pre-clustering, and set weights to normalized amount of points in each pre-cluster.
It is important to remember about limitations of EM methodology. EM only tries to find the maximum likelihood estimate, and not finds it with 100 % confidence, because EM estimate only guarantees not to get worse in the process. If the likelihood function has multiple peaks (non-concavity case) EM will not necessarily find the global optimum of the likelihood. In practice, one can never trust one single run. It is very common to start EM multiple times with multiple random initial guesses, and choose the one with the largest likelihood as the final estimate for parameters
EM is widely used for data clustering in machine learning and computer vision techniques. In natural language processing, two prominent instances of the algorithm are the Baum-Welch algorithm and the inside-outside algorithm for unsupervised induction of probabilistic context-free grammars. In our method we also propose to estimate optimal amount of clusters with Silhouette criterion [16, 17] for limited range of number of clusters (in our application 1:5) with Euclidean measure of distance. In our application we use Expectation – Maximization algorithm under the assumption that point clouds in feature space will form clusters distributed normally.
3. Application to real data
The analyzed real-life data set is a vibration signal of a roadheader. The sampling rate was equal to 25 kHz. Duration of measurement was 8 seconds, and it was performed by using a linear accelerometer placed vertically on the mining head’s arm. The analyzed data set is presented in Fig. 2.
At first, impulses have been localized in time according to the description in Section 2.1 (see Fig. 3), and waiting times between them have been calculated as a numerical derivative of impulses’ timestamps.
Fig. 2Raw vibration data
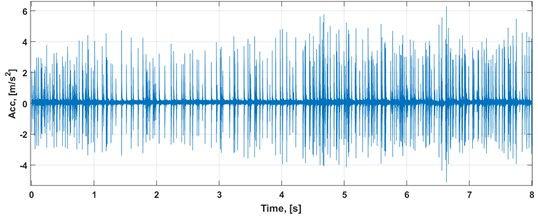
Fig. 3Raw vibration data and localized impulses (zoomed for better visibility)
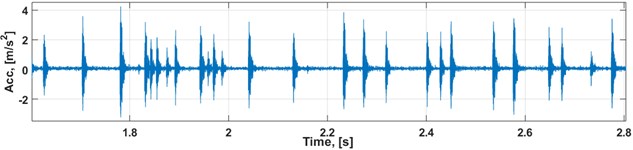
a) Raw vibration data
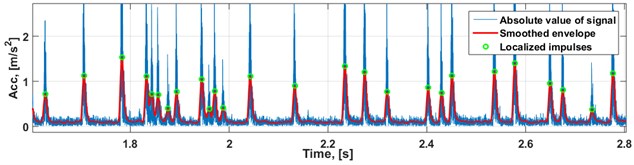
b) Impulse localization
After that two vectors of shape and scale parameters have been estimated by modeling waiting times data (see Section 2.3) within the window of the two lengths.
Statistics presented in Fig. 4 represent set of -points vectors of statistics for window length equal to 20 and 30 respectively. Dataset is then centered and variance over each dimension is set to 1. This operation allows to more reliable and efficient clustering and also estimation of cluster amount.
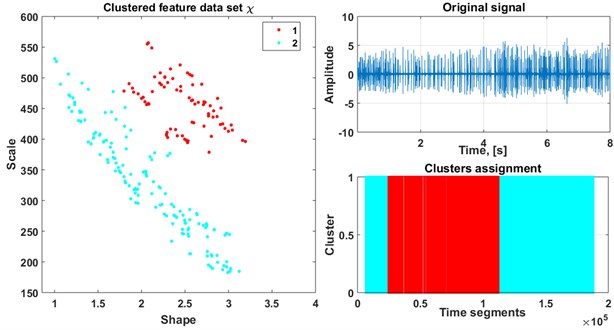
After calculation of parameters we estimate the amount of clusters using Silhouette criterion for limited range (1:5). When optimal amount of clusters is established, EM algorithm clusters the dataset dividing it into classes. For the analyzed dataset we discovered that the optimal number of clusters is equal to two.
Fig. 4Statistics used for classification: a) window of 20 impulses, b) window of 30 impulses
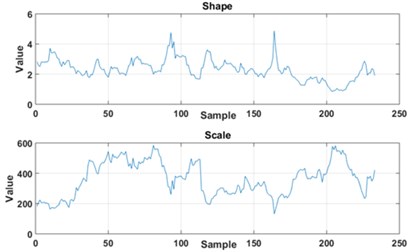
a)
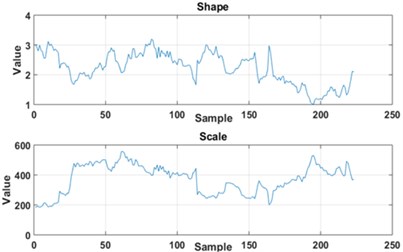
b)
We present the division of the raw signal for window length equal to 20 samples (Fig. 5) and equal to 30 (Fig. 6) into two clusters after application of the mentioned procedure. As a result of the presented procedure we obtain parts of signal belonging to certain clusters. Investigation of indices of data points revealed that both window lengths resulted in identical classification results. Detection and further analysis of such time map can help improving machine operating efficiency, e.g. to minimize amount and duration of idle modes.
Fig. 5Result of classification (window 20)
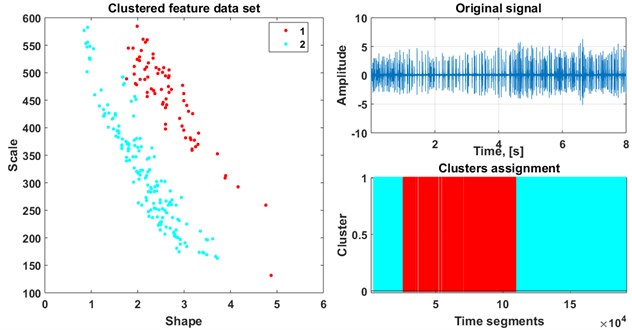
Fig. 6Result of classification (window 30)
4. Conclusions
In this paper we have proposed a segmentation technique which can be applied to the vibration signal from roadheader working in the mining industry. Different operation modes, difficult working conditions and some degree of uncertainty due to external interferences cause the analysis to be difficult from diagnostic point of view. Therefore, it is needed to design new data-driven method for signal segmentation for operational modes classification. Proposed technique works automatically and is based on Silhouette criterion, gamma distribution approach and Expectation-maximization algorithm for parameters classification. The method outputs time segments within which given signal reveals homogenous character. Obtained time periods correspond to operation modes of the machine.
References
-
Lopatka M., Laplanche C., Adam O., Motsch J.-F., Zarzycki J. Non-stationary time-series segmentation based on the Schur prediction error analysis. 13th Workshop on Statistical Signal Processing, 2005, p. 251-256.
-
Wylomanska A., Zimroz R., Janczura J., Obuchowski J. Impulsive noise cancellation method for copper ore crusher vibration signals enhancement. IEEE Transactions on Industrial Electronics, Vol. 63, Issue 9, 2016, p. 5612-5621.
-
Gajda J., Sikora G., Wyłomańska A. Regime variance testing – a quantile approach. Acta Physica Polonica B, Vol. 44, Issue 5, 2013, p. 1015-1035.
-
Wyłomańska A., Zimroz R. Signal segmentation for operational regimes detection of heavy duty mining mobile machines- a statistical approach. Diagnostyka, Vol. 15, Issue 2, 2014, p. 33-42.
-
Makowski R., Hossa R. Automatic speech signal segmentation based on the innovation adaptive filter. International Journal on Applied Mathematics and Computer Science, Vol. 24, 2014, p. 259-270.
-
Obuchowski J., Wyłomańska A., Zimroz R. The local maxima method for enhancement of time-frequency map and its application to local damage detection in rotating machines. Mechanical Systems and Signal Processing, Vol. 46, 2014, p. 389-405.
-
Popescu T. D. Signal segmentation using changing regression models with application in seismic engineering. Digital Signal Processing, Vol. 24, 2014, p. 14-26.
-
Azami H., Mohammadi K., Bozorgtabar B. An improved signal segmentation using moving average and Savitzky-Golay filter. Journal of Signal and Information Processing, Vol. 3, 2012, p. 39-44.
-
Cizek P., Härdle W., Weron R. Statistical Tools for Finance and Insurance, (2nd Edition). Springer, Heidelberg, 2011.
-
Janczura J., Wylomanska A. Anomalous diffusion models: different types of subordinator distribution. Acta Physica Polonica B, Vol. 43, Issue 5, 2012, p. 1001-1016.
-
Poloczanski R., Wylomanska A., Gajda J., Maciejewska M., Szczurek A. Modified cumulative distribution function in application to waiting times analysis in CTRW scenario. arXiv:1604.02653, 2016.
-
Dempster A. P., Laird N. M., Rubin D. B. Maximum likelihood from incomplete data via the EM algorithm. Journal of the Royal Statistical Society, Series B, Vol. 39, Issue 1, 1977, p. 1-38.
-
Sundberg R. Maximum likelihood theory for incomplete data from an exponential family. Scandinavian Journal of Statistics, Vol. 1, Issue 2, 1974, p. 49-58.
-
Neal R., Hinton, Jordan M. I. A view of the EM algorithm that justifies incremental, sparse, and other variants. Learning in Graphical Models, MIT Press, Cambridge, MA, 1999, p. 355-368.
-
Hastie T., Tibshirani R., Friedman J. 8.5 The EM algorithm. The Elements of Statistical Learning. Springer, New York, 2001, p. 236-243.
-
Kaufman L., Rouseeuw P. J. Finding Groups in Data: An Introduction to Cluster Analysis. John Wiley & Sons, Inc., Hoboken, NJ, 1990.
-
Rouseeuw P. J. Silhouettes: a graphical aid to the interpretation and validation of cluster analysis. Journal of Computational and Applied Mathematics, Vol. 20, Issue 1, 1987, p. 53-65.
About this article

