Abstract
Bearing fault diagnosis has a pivotal role in condition-based maintenance. Vibration spectra analysis has been proven to be the most efficient method for rotating machinery fault diagnosis. Vibration spectra can be analyzed by various signal processing tools (e.g. wavelet analysis, empirical mode decomposition, Hilbert-Huang transform). However, they involve human expertise in ensuring its maximum success. Machine learning tools (e.g. artificial neural networks (ANN), support vector machines (SVM)) can be an alternative for an automatic fault diagnosis. Researchers have studied the feasibility of ANN for automatic fault diagnosis since last decades. Most of the researchers reported positive finding in adapting ANN for automatic fault diagnosis. However, its accuracy is highly dependent on the neural networks structure such as number of nodes, hidden layers, and sigmoid function. This study proposed a hybrid algorithm used for automated bearing fault diagnosis based on ANN and Dempster-Shafer (DS) theory. The hybrid algorithm employed DS theory to improve the fault diagnosis results from ANN by eliminating conflicting results generated by ANN. Four conditions of bearing namely healthy condition and three types of faults included ball, inner race, and outer race faults classify by the proposed hybrid algorithm and artificial neural networks. The superiority of the hybrid algorithm was shown by comparing its result with the performance of ANN alone.
1. Introduction
The past decades have seen the increasing installation of critical and advanced machines in the modern industry such as power generation, aviation, oil and gas, chemical, manufacturing sector. The bearing is one of the key components of this modern machinery. The health condition of a bearing plays a pivotal role in ensuring the integrity of rotating machinery. Bearing failure can lead to total machine malfunction. Vibration spectra analysis has been proven to be the most efficient diagnostic method for rotating machinery health monitoring. Various vibration signal processing tools were introduced in the past decades such as wavelet analysis, empirical mode decomposition, and Hilbert-Huang transform. These signal processing methods evolved from non-adaptive to self-adaptive signal analysis [1]. The effectiveness of these diagnosis methods to diagnose machinery faults depends heavily on the experience and knowledge of the operator of the machine. There is a growing body of literature that recognizes the importance of machine learning approach in machinery fault diagnosis. This method provides a more consistent diagnostic result based on a trained machine learning structure and thus leads to a more automated fault diagnosis system which eliminates any human intervention. Although machine learning based machinery fault diagnosis provides a more consistent diagnostic result, its accuracy is still highly dependent on the machine learning algorithm applied to analyze the signal. In other words, the accuracy of diagnostic based on artificial neural network (ANN), self-organizing maps (SOM), and support vector machine (SVM) could be entirely different. This paper explores the application of Dempster-Shafer (DS) theory to improve the accuracy of the bearing fault diagnosis results based on the ANN.
2. Bearing fault features extraction
2.1. Data collection
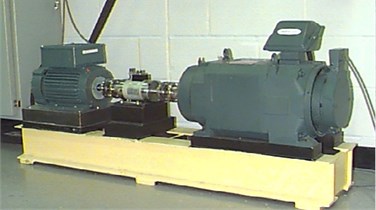
The data used in this study was downloaded from the website of Case Western Reserve University Bearing Data Center specifically to represent ball bearing healthy and faulty conditions (rolling element, inner raceway, and outer raceway faults). The arrangement of the test rig used to simulate different conditions of the bearing is shown in Fig. 1. The test rig consists of a 2 hp motor, a torque transducer, and a dynamometer. A 7 mils (178 microns) fault diameter was introduced to the SKF bearing to simulate bearing faults. The motor was operating at approximately 1772 rpm with 1 hp load. Vibration data was collected at a sampling rate of 12,000 samples per second by accelerometers that were attached to the bearing housing.
Fig. 1Test rig for the experiment
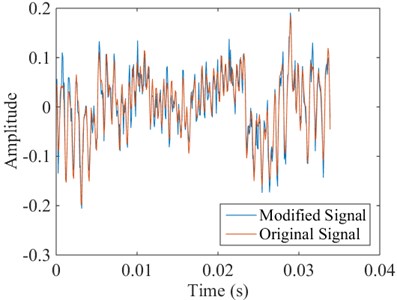
To simulate industrial environment where bearing vibration signals would be contaminated with random noise, white Gaussian noise was added to the original vibration signal. Fig. 2 shows the original vibration signal and the modified signal with additive white Gaussian noise. As a result, the signal-to-noise ratio (SNR) of the modified signal is 10 dB. A total of 1,000 sets of vibration time series were extracted from the time domain vibration signal. Then, the 1,000 sets of vibration data were divided into two different inputs of which one set of the data was used to train the machine learning model, and the other set of the data was used for model validation. The distribution of the vibration data set employed in this study is shown in Table 1. The next section describes the statistical analysis methods and parameters such as root-mean-square (RMS), standard deviation (), skewness, kurtosis, and crest factor that are used in features extraction for machine learning diagnostic study.
Fig. 2Comparison of original vibration signal and the modified signal with additive white Gaussian noise
2.2. Statistical analysis
The 1,000 sets of vibration data were used as the input for statistical analysis and subsequently the resulted statistical parameters were used as features for ANN model training and testing purposes. Each statistical analysis method is briefly described in the following paragraphs.
The RMS value of a vibration time series can be used to represent the power content of a vibration signal. This feature is known to be effective in detecting an imbalance in rotating machinery [2]. Eq. (1) shows the mathematical function of RMS:
Table 1Distribution of the vibration data used in this study
Bearing condition | Training data | Testing data |
Healthy | 200 | 50 |
Rolling element fault | 200 | 50 |
Inner raceway fault | 200 | 50 |
Outer raceway fault | 200 | 50 |
Standard deviation () of a vibration time series denotes the energy content of the vibration signal. It is also a measure of discrimination [3]. Eq. (2) shows the mathematical function of standard deviation:
Skewness measures the degree of asymmetry of a distribution around its mean. It is a dimensionless parameter which is also an effective parameter to be used for fault diagnosis in rotating machinery [4]. Eq. (3) shows the mathematical function of skewness:
Kurtosis is a statistical parameter that describes the distribution of the data around the mean. It characterizes the degree to which a statistical frequency curve is peaked [5]. Also, it is also a dimensionless parameter. Eq. (4) shows the mathematical function of kurtosis:
Crest factor is a ratio of the peak value to its RMS value of an input signal. It can be used to identify changes in the signal pattern due to impulsive vibration sources such as for ball bearing defects on the outer raceway [2]. Eq. (5) shows the mathematical function of crest factor:
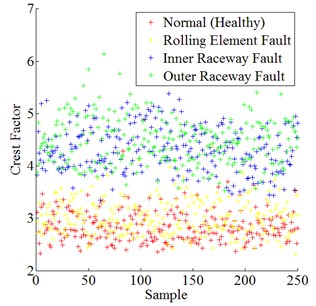
Fig. 3 shows the data distribution of skewness, kurtosis, and crest factor for all experimental bearing conditions respectively.
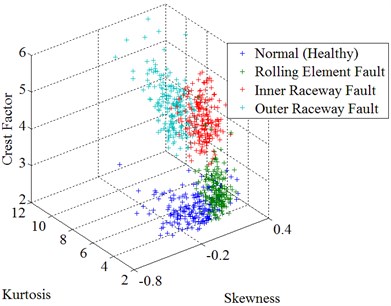
Since there is a total of 250 samples for each bearing condition, 80 % of the samples were selected randomly as the training data to synthesize the machine learning model while the remaining 20 % of the samples were used to validate the trained machine learning model. The distribution of all training data of the three feature parameters (skewness, kurtosis, and crest factor) used in this study is shown in Fig. 4.
Fig. 3Data distribution of skewness, kurtosis, and crest factor for all experimental bearing conditions
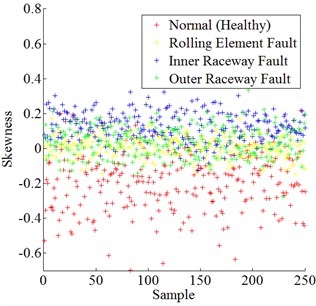
a) Skewness of all bearing conditions
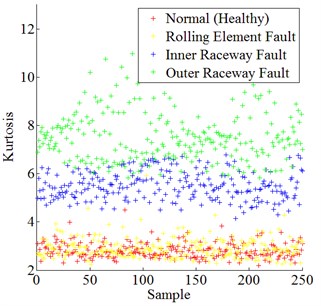
b) Kurtosis of all bearing conditions
c) Crest factor of all bearing conditions
Fig. 4Distribution of all training data
3. Bearing fault diagnostic model
Machine learning plays an important role to enable automated machinery fault diagnosis. It synthesizes the learning algorithm by samples (training data). In this study, ANN was used for fault classification purpose. Subsequently, the results produced by ANN were further refined by DS theory for ultimate decision-making purpose. The two machine learning techniques were described in the following sections.
3.1. Artificial neural network
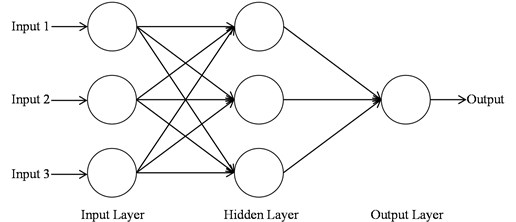
Over the past century, there has been a dramatic increase in the application of ANN in various fields, including machinery faults diagnosis. ANN is a supervised machine learning theory. ANN form a parallel information processing arrangement based on a grid of interconnected artificial neurons as shown in Fig. 5 [6].
There are two phases in ANNs: the training phase and the testing phase [7]. The training phase aims to determine the type of tasks that can be solved later while the testing phase seeks to process the representative features of the inputs. Lee et al. [8] reviewed characteristics of commonly used algorithms such as ANN, SVM, Bayesian Belief Networks (BBN), Hidden Markov Model, and Feature Map. for machinery faults diagnostics. Finally, they nominated ANN as the most appropriate tool for machinery faults diagnostics.
Fig. 5Schematic structure of an Artificial Neural Networks
3.2. Dempster-shafer theory
The DS theory was the seminal work of Glenn Shafer (1976) and its conceptual forerunner by Arthur P. Dempster (1967). It is a mathematical theory that deals with uncertain information reasoning. It allows the combination of evidence from multiple sources and provides a measure of confidence (belief function, ) that a given event will occur. Let be a finite set of possible answers, and represents an empty set; the belief function should satisfy the three axioms represented by Eqs. (6-8):
The DS theory consists of three important parameters, namely the mass function (), belief function () and plausibility (). Mass function () is a basic probability assignment that measures the belief that is committed exactly to a subset. Belief function () is a lower probability that measures the total belief mass that is confined to a subset while plausibility () is a higher probability that measures the total belief mass that can move into a subset.
The most recent applications of DS theory can be found in the fields of medical diagnostic [9], aviation [10], machinery condition monitoring and fault diagnosis [11, 12], maintenance management [13], chemical engineering [14], defence [15], power generation industry [16] and engineering design [17], to name a few. To date, DS theory has been proven to be effective in combining evidence to provide a high level of confidence in the occurrence of an event.
3.3. Structure of bearing fault diagnosis model
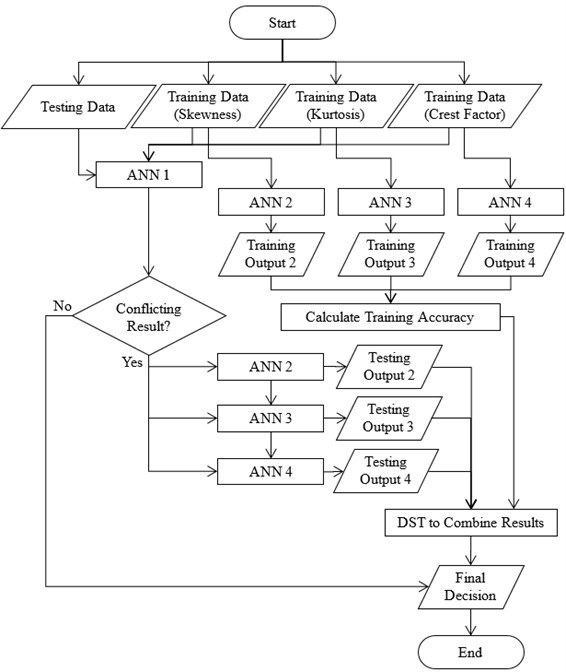
The automated bearing fault diagnosis model in this study was constructed by combining the ANN and DS theory. This is a two layers classification. First layer: an ANN model will be constructed by feeding training data from all features (skewness, kurtosis, and crest factor) to the ANN algorithm. Then, testing data will be used to test the trained ANN algorithm. In this stage, some of the testing data may have the conflicting result as illustrated in Table 2. Second layer: three ANN models will be constructed by feeding training data from each feature respectively, meaning that an ANN model will be built on training data from a single feature only (e.g. skewness). The testing data with conflicting result produced in the first layer will be classified by the second layer classification. This second layer classification model combines all the three ANN models (skewness, kurtosis, and crest factor) by DS theory. The ANN models with single feature generated a better classification curve fitting that capable of distinguishing the samples fell on the border of the first layer classification and provide the final decision on a bearing’s condition. A flowchart for the automated bearing fault diagnosis model used in this study is shown in Fig. 6.
Fig. 6Flowchart for the automated bearing fault diagnosis
4. Results and discussion
4.1. ANN results and discussion
In the first layer of bearing conditions classification, ANN has classified most of the testing data into four bearing conditions which are healthy, rolling element fault, inner raceway fault, and outer raceway fault. The ANN structure used in this study is a feed-forward back propagation neural network with two layers and ten neurons on the first layer. Besides, Levenberg-Marquardt training algorithm (trainlm) has been employed in this study. It is generally considered as the fastest training function. The ANN structure was shown in Fig. 7. The ANN’s training performance progress was shown in Fig. 8. The training performance plot showed the validation curve is analogous to test curve. In other words, it does not indicate any major problem in the training stage such as overfitting problem. The validation performance reached a minimum at 12 iterations. Fig. 9 shows the regression plot of the ANN. The plot demonstrates the relationship between the outputs of the ANN and the targets during its training, validation, and testing stage. The ideal situation is all ANN’s outputs exactly same as targets which mean all data were classified correctly. However, this situation rarely happens in the real practice. When the value of closer to 1, it indicates better the relationship between outputs and targets. In this study, the regression plot showed the value of is about 0.9 for all training, validation, testing stages which indicate a good relationship between outputs and targets. Therefore, the authors able to summarize the performance of the ANN model are acceptable.
Table 2An example of results generated by ANN
Sample | Bearing condition | Final decision | |||
Healthy | Rolling element fault | Inner raceway fault | Outer raceway fault | ||
A | 1 | 0 | 0 | 0 | Healthy |
B | 0 | 1 | 0 | 0 | Rolling element fault |
C | 0 | 0 | 1 | 0 | Inner raceway fault |
D | 0 | 0 | 0 | 1 | Outer raceway fault |
E | 0 | 0 | 0 | 0 | Conflict |
F | 0 | 1 | 1 | 0 | Conflict |
Fig. 7The ANN structure in this study

The results generated by the ANN model were analyzed. However, some conflicting results were generated as shown in Fig. 10. The conflicting results were then classified by the second layer classification which employed DS theory for results fusion.
Fig. 8The ANN’s training performance. Best validation performance is 0.036211 at epoch 12
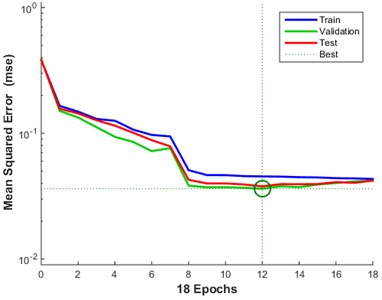
Fig. 9The ANN’s regression
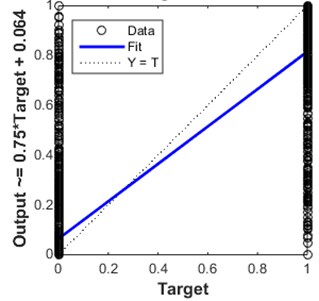
a) Training 0.87064
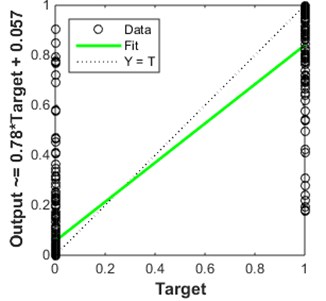
b) Validation 0.89868
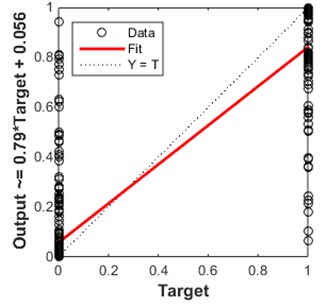
c) Test 0.8935
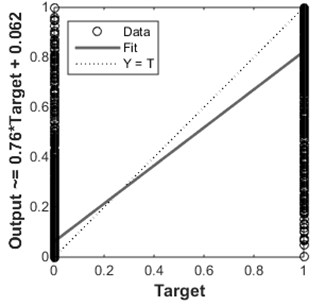
d) All 0.87832
Fig. 10Analysis of decisions of ANN models
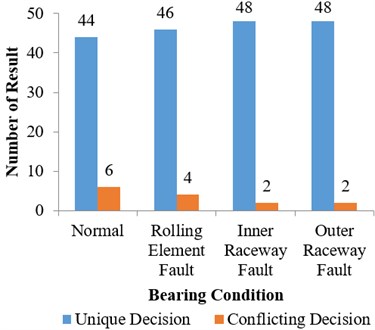
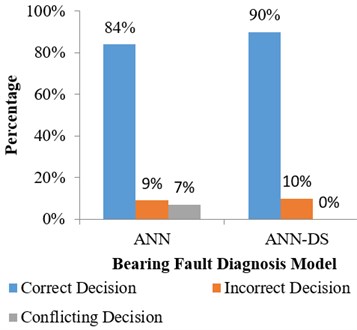
Fig. 11The accuracy of decisions by ANN and ANN-DS
4.2. DS theory results and discussion
In this phase, the conflicting results of ANN model can be further analyzed or fused by DS theory to eliminate the conflicting decisions to arrive at the final result of bearing fault diagnosis. The inputs data of the conflicting results were sent to each ANN models which are skewness, kurtosis, and crest factor for classification. Finally, the results generated by each ANN models will be combined with DS theory to make the final decision. Fig. 11 shows the comparison of decisions making from the ANN model and the hybrid ANN-DS model. In summary, these results indicate that the hybrid ANN-DS can eliminate all conflicting decisions of ANN model and to make the final decision on the data in hand.
The accuracy of the ANN and the hybrid ANN-DS model is 84 % and 90 % respectively. Even though the increasing of accuracy is small but it was proven to be effective in eliminating conflicting results by using the hybrid ANN-DS model for bearing fault diagnosis. The increase in accuracy of the hybrid model was attributed to the elimination of conflicting decisions of the ANN model. In particular, the hybrid model was able to increase the accuracy of ANN model by 6 %.
5. Conclusions
This paper proposed a hybrid ANN-DS model for automated bearing fault diagnosis. The four bearing conditions simulated by Case Western Reserve University Bearing Data Center were used as the inputs to the machine learning models. Results of this study show that DS theory had increased the accuracy of ANN model by eliminating all conflicting results of ANN. In summary, the application of ANN-DS was found to be more superior and accurate for bearing fault diagnosis as compared to only the ANN model.
References
-
Hui K. H., Hee L. M., Leong M. S., Abdelrhman A. M. Time-frequency signal analysis in machinery fault diagnosis: review. Advanced Materials Research, Vol. 845, 2013, p. 41-45.
-
Yang H., Mathew J., Ma L. Vibration feature extraction techniques for fault diagnosis of rotating machinery – a literature survey. Asia Pacific Vibration Conference, 2003, p. 1-7.
-
Sarabi-Jamab A., Araabi B. N., Augustin T. Information-based dissimilarity assessment in Dempster-Shafer theory. Knowledge-Based Systems, Vol. 54, 2013, p. 114-127.
-
Lei Y., He Z., Zi Y. Application of an intelligent classification method to mechanical fault diagnosis. Expert Systems with Applications, Vol. 36, Issue 6, 2009, p. 9941-9948.
-
Kankar P. K., Sharma S. C., Harsha S. P. Rolling element bearing fault diagnosis using wavelet transform. Neurocomputing, Vol. 74, Issue 10, 2011, p. 1638-1645.
-
Liu S. W., Huang J. H., Sung J. C., Lee C. C. Detection of cracks using neural networks and computational mechanics. Computer Methods in Applied Mechanics and Engineering, Vol. 191, Issues 25-26, 2002, p. 2831-2845.
-
Saravanan N., Ramachandran K. I. Incipient gear box fault diagnosis using discrete wavelet transform (DWT) for feature extraction and classification using artificial neural network (ANN). Expert Systems with Applications, Vol. 37, Issue 6, 2010, p. 4168-4181.
-
Lee J., Wu F., Zhao W., Ghaffari M., Liao L., Siegel D. Prognostics and health management design for rotary machinery systems – reviews, methodology and applications. Mechanical Systems and Signal Processing, Vol. 42, Issues 1-2, 2014, p. 314-334.
-
Guil F., Marín R. A Theory of Evidence-based method for assessing frequent patterns. Expert Systems with Applications, Vol. 40, Issue 8, 2013, p. 3121-3127.
-
Phillips P., Diston D. A knowledge driven approach to aerospace condition monitoring. Knowledge-Based Systems, Vol. 24, Issue 6, 2011, p. 915-927.
-
He Y. L., Wang R., Kwong S., Wang X. Z. Bayesian classifiers based on probability density estimation and their applications to simultaneous fault diagnosis. Information Sciences, Vol. 259, 2014, p. 252-268.
-
Cao J., Chen L., Zhang J., Cao W. Fault diagnosis of complex system based on nonlinear frequency spectrum fusion. Measurement, Vol. 46, Issue 1, 2013, p. 125-131.
-
Potes Ruiz P. A., Kamsu-Foguem B., Noyes D. Knowledge reuse integrating the collaboration from experts in industrial maintenance management. Knowledge-Based Systems, Vol. 50, 2013, p. 171-186.
-
Natarajan S., Srinivasan R. Implementation of multi agents based system for process supervision in large-scale chemical plants. Computers and Chemical Engineering, Vol. 60, 2014, p. 182-196.
-
Avci E. A new method for expert target recognition system: genetic wavelet extreme learning machine (GAWELM). Expert Systems with Applications, Vol. 40, Issue 10, 2013, p. 3984-3993.
-
Bhalla D., Bansal R. K., Gupta H. O. Integrating AI based DGA fault diagnosis using Dempster-Shafer theory. International Journal of Electrical Power and Energy Systems, Vol. 48, 2013, p. 31-38.
-
Browne F., Rooney N., Liu W., Bell D., Wang H., Taylor P. S., Jin Y. Integrating textual analysis and evidential reasoning for decision making in engineering design. Knowledge-Based Systems, Vol. 52, 2013, p. 165-175.
Cited by
About this article
The authors would like to extend their greatest gratitude to the Institute of Noise and Vibration UTM for funding the study under the Higher Institution Centre of Excellence (HICoE) Grant Scheme (PY/2016/06784, PY/2016/07069 and PY/2016/07034). Additional funding for this research also come from the UTM Research University Grant (Q.K130000.2543.11H36), and Fundamental Research Grant Scheme (R.K130000.7840.4F653) by The Ministry of Higher Education Malaysia. The main author also supported by The Ministry of Higher Education and Universiti Tun Hussein Onn Malaysia for his Ph.D. study.
