Abstract
The article presents the impact of variable operating conditions on the value of braking process delay for the progressive gears of PP16 type and the newly constructed CHP2000 gears. Tests were conducted in the regular working conditions with the application of mineral oil as lubricating agent. Values of delays were recorded for the loading of 400 and 1000 kg. This research study presents the recurrence plot analysis to investigate variability of received test runs. The results may be useful for testing new solutions brakes in varying conditions of service and may set new directions of research in the discussed topics.
1. Introduction
The brake systems belong to the most important systems of all technical constructions. Friction gears are equipped with two types of brakes (gears): instantaneous and progressive ones. Many authors [1-7] touch the aspects related to the friction gears construction and operation. In most cases, the papers described in the literature refer to instantaneous brake systems. With respect to the characteristics of their operation they require to apply the safety coefficients of 3rd order. The topic of the progressive gears construction and operation is brought up by the authors in the papers [8, 9]. The authors used the numerical modeling and analyzed the impact of a gear construction on the length of braking distance. The wavelet analysis to investigate the pressures received in the engine chamber is described by the authors in publication [10]. Nevertheless, the world literature providing descriptions, analyses and mathematical models of progressive gears represents deficiency of information. Thus, it is justified to perform research studies within the impact of variable loading and operating conditions on the progressive gears braking process.
2. Experimental tests results
Below presented research study illustrates the possibility to apply the recurrence analysis to evaluate the delay value for the progressive gears. It refers to the gears subject to variable loadings and operating conditions. Free fall method, in dry conditions (without lubrication) and with RENOLIN B20 oil applied, was used in the tests. A test bench, the scheme of which is presented in Fig. 1 and 2, was used to perform the tests.
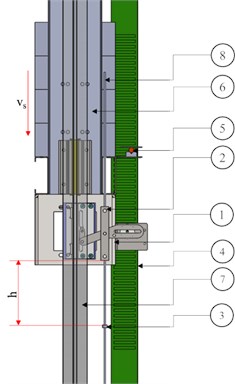
Free fall of the friction elevator was simulated during the tests. In order to that the carrying ties were broken off. In the frame of the system No. 6 the bodies No. 1 were installed in turn together with PP16 and CHP 2000 gears respectively. The guides No. 7 were mounted in the test bench construction. The frame loading the gears was moving along the guides. The gears and the frame were coupled with the system to control the free fall speed. The system had a task to initiate the braking process once the nominal value of speed was exceeded by 0.3 m/s. The measurement of braking parameters was recorded by an accelerometer of MMA7341LC type. It was manufactured by Pololu 5 company. This device was coupled with PC class computer. Apart from „” delay parameter also the “” free fall distance was recorded. The free fall distance was recorded with an optical sensor of CFR-22 type. The sensor was manufactured by Sensor company. The sensor possessed a graduation that was scaled every 10 mm. It was placed on the slat No. 4. Once the free fall was initiated, a lever of the gear No. 2 hit a clamp of the line No. 3. In consequence the braking process was started. The height of free fall, at which the frame system should have been placed, was defined via an empirical dependence. That was the empirical dependence between potential and kinetic energy. The calculated value of the free fall height was 250 mm – This dependence is presented in Eq. (1):
where: – the free fall height [m], – the speed of the gears release, 1.25 [m/s] value accepted for tests, –the acceleration of gravity – 9.81 [m/s2], 0.1 – the delay coefficient of the gears activation [-], 0.03 – the excessive clearance coefficient in the brake system according to [11] [-].
Fig. 1The test bench scheme
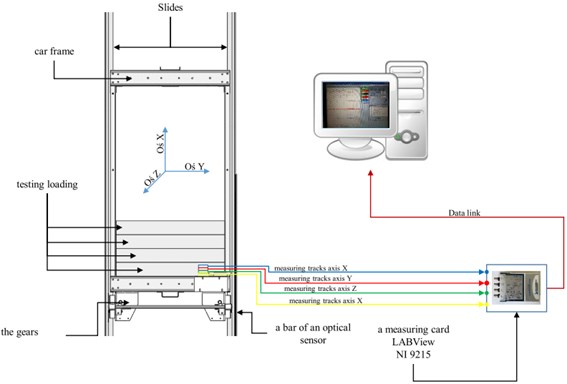
Fig. 2The test bench scheme
All measuring tracks were coupled with LABVIEW 9215 measuring card. The card was connected with PC class computer. Data was recorded on the computer.
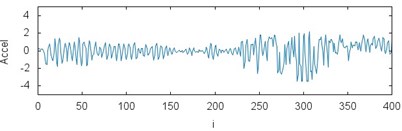
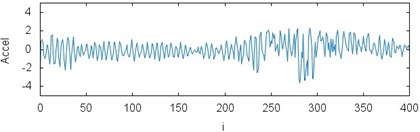
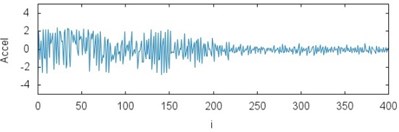
Braking distance dependencies for tested gears received via the experiments are presented in Fig. 3.
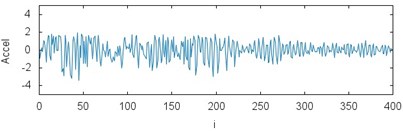
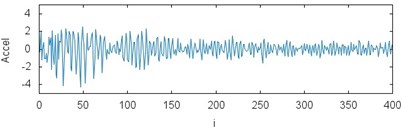
While analyzing the characteristics obtained in the experiment the influence of operating conditions on the value of braking process delay can be noticed. The maximum values reaching 130 m/s2 with lubrication applied were received for the gears of CHP 2000 type and with 1000 kg loading. For the same gears type but without lubrication the values of delay reached 110 m/s2. The values of delay 90 and 105 m/s2 werereached respectively for the loading of 400 kg. During tests the gears of PP16 type demonstrated more fixed characteristic. It is reflected on the plots. The maximum values reaching 130 m/s2 with lubrication and 1000 kg loading were obtained for the gears of CHP 2000 type. For the same gears type but without lubrication the values of delay reached 128 m/s2. The values of delay 125 and 120 m/s2 werereached respectively for the loading of 400 kg.
3. The analysis of recurrence
Originally, the analysis of recurrence was proposed by Eckmann in 1987 [12]. It was presented as a new graphic tool to identify time dependencies in dynamic systems. It looks for the presence of the same dynamical system conditions in successive time periods. It means that, if two points on trajectory in phase space are close enough to each other they are marked as “the recurrence points” [13, 14]. If dynamics is periodic the number of recurrent points increases. If it is non-periodic or stochastic dynamics, then the number of recurrent states decreases or disappears. This method has been widely used in many fields, especially in physiology, technical science or economics where periodicity can be observed and identified in short time scales or/and with presence of noise [13-20]. In nonlinear time series analysis, all phase space coordinates can be used if available or the phase space can be reconstructed from one-dimensional time series with the use of embedding theorem by Takens [21]. Let us have time series of length. On its basis the dimensional reconstruction of phase space can be done:
where means time delay, and stands for the phase space dimension. Generally, any time delay can be selected. Nevertheless, due to too low value the respective constituents are strongly correlated with each other. On the other hand, too high value causes weaker correlation. Thus, it can lead to the loss of information about the system in short time intervals.
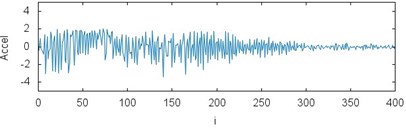
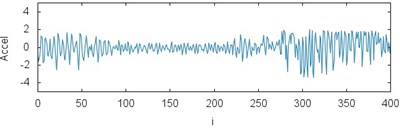
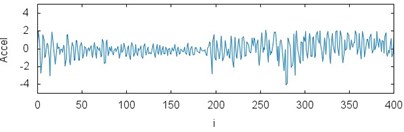
Fig. 3The results of measurements for acceleration of the gears braking process depending on the operating conditions and loading: a) CHP 2000 progressive gear with 1000 kg loading – operated with lubrication, b) CHP 2000 progressive gear with 1000 kg loading – operated without lubrication c) CHP 2000 progressive gear with 400 kg loading – operated with lubrication, d) CHP 2000 progressive gear with 400 kg loading – operated without lubrication, e) PP16 progressive gear with 1000 kg loading – operated with lubrication, f) PP16 progressive gear with 1000 kg loading – operated without lubrication, g) PP16 progressive gear with 400 kg loading – operated with lubrication, h) PP16 progressive gear with 400 kg loading - operated without lubrication
a)
b)
c)
d)
e)
f)
g)
h)
Mutual Information method () [22] is one of the methods to select optimal value of . The method takes into account nonlinear dependencies:
where is the probability of finding the value from time series in th interval and is the probability after the time of the value from time series in th interval (the number of intervals is 16). The value is selected as the first minimum of MI function. In this case 4. Then, the identified value of delay is used to determine a dimension of reconstructed phase space with False Nearest Neighbors Fraction (FNNF) [23, 24] method. It is an iterative comparison of the distance relation between neighboring points when dimension of reconstructed space increases:
where means a given point, and its closest neighbour. If the relation received with the Eq. (4) is higher than a given value (in our case it is the value 2) then the number of false neighbors goes up. One of the means to select the embedding dimension is zero of FNNF function, in our case equals 5. It should be noticed that the embedded space dimension can be higher. In the space with higher dimension, the false neighbors also disappear. Periodicity of analyzed dynamics can be tested with the use of the recurrence analysis. This analysis, in opposition to the majority of statistical methods, can be used for short and non-stationary time series. If the distance between two points on the trajectory is small enough they are marked as neighboring ones. It can be expressed with a distance matrix, elements of which are calculated with the following formula:
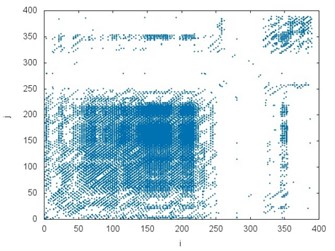
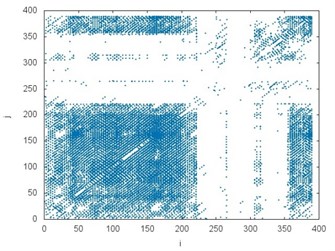
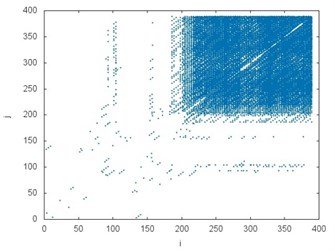
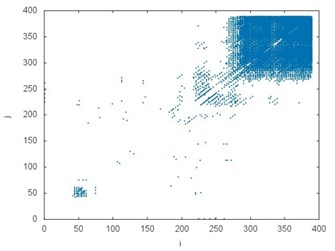
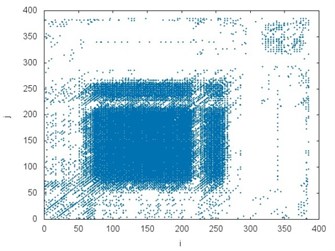
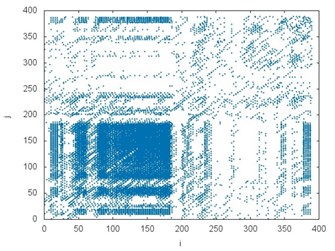
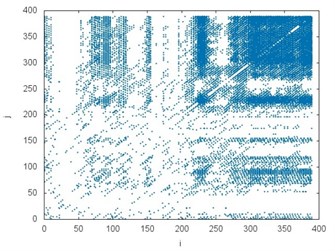
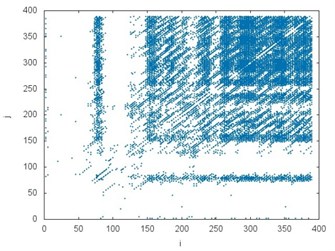
where means the highest value of distance, and means Heaviside function. The number of recurrence points depends both on value and dynamics of the system. Usually, is selected in such a way so as the number of recurrence points equals to several percent. Fig. 4 presents the comparison between (RP) recurrence plots including 10 % of recurrence points received in the time series (Fig. 3).
The recurrence plot can consist of diagonal lines, isolated points and vertical lines. Presence of different length diagonal lines gives evidence of periodic dynamics. Additional isolated points indicate non-periodic dynamics or noise. The vertical lines belong to the features distinguished for intermittent states. Comparing the recurrence plots presented in Fig. 4 the similarity between several examples but subject to different operating conditions (it is also visible in the chart in Fig. 3) can be noticed. White areas represent the fact that tested time series are non-stationary. The concentration of recurrence points in the lower left corner in the plots in Fig. 4(a), (b) and (e), (f) indicates more regular dynamics of braking process at the initial stage. Analogously, the clusters of recurrence points located in the upper right corner give evidence of higher regularity of the phenomenon at the final stage. They are clearly visible in the plot in Fig. 4(c), (d) but also (g), (h). It should be added that analyzed data comes from the test bench and it is influenced by noise.
Visual analysis of recurrence plots can be helpful to identify the dynamics type. Nevertheless, more precise comparison can be received when the statistics of isolated points, diagonal and vertical lines [12] are used.
Fig. 4The recurrence plots prepared for all analyzed accelerations: a) CHP 2000 progressive gear with 1000 kg loading – operated with lubrication b) CHP 2000 progressive gear with 1000 kg loading – operated without lubrication c) CHP 2000 progressive gear with 400 kg loading – operated with lubrication, d) CHP 2000 progressive gear with 400 kg loading – operated without lubrication, e) PP16 progressive gear with 1000 kg loading – operated with lubrication f) PP16 progressive gear with 1000 kg loading – operated without lubrication g) PP16 progressive gear with 400 kg loading – operated with lubrication h) PP16 progressive gear with 400 kg loading - operated without lubrication
a)
b)
c)
d)
e)
f)
g)
h)
– RR (Recurrence Rate) – the ratio between the number of recurrence points and the total number of points:
– DET (Determinism) – the ratio between the number of recurrence points creating diagonal lines and the total number of points:
– LAM (Laminarity) – the ratio between the number of recurrence points creating vertical lines and the total number of points:
– LMAX – the longest diagonal line.
– VMAX – the longest vertical line.
– – the average length of diagonal lines:
– TT – the average length of vertical lines:
where means probability of the diagonal lines arrangement for or vertical lines for . The values and mean a minimum length of diagonal or vertical lines (the following was selected: 2).
Table 1. presents the recurrence indicators for respective cases.
Table 1The analysis of recurrence quantification
Case | RR | DET | LAM | LMAX | VMAX | L | TT | |
CHP2000-1000 OL | 1.2 | 10 % | 0.55 | 0.68 | 88 | 48 | 5 | 4 |
CHP2000-1000 S | 1.3 | 10 % | 0.46 | 0.55 | 74 | 18 | 4 | 2 |
CHP2000-400 OL | 0.9 | 10 % | 0.74 | 0.55 | 131 | 48 | 6 | 2 |
CHP2000-400 S | 1.1 | 10 % | 0.84 | 0.77 | 165 | 109 | 13 | 14 |
PP16-1000 OL | 1.2 | 10 % | 0.65 | 0.69 | 72 | 31 | 5 | 3 |
PP16-1000 S | 1.5 | 10 % | 0.56 | 0.64 | 75 | 83 | 6 | 4 |
PP16-400 OL | 1.5 | 10 % | 0.58 | 0.61 | 83 | 44 | 5 | 3 |
PP16-400 S | 1.3 | 10 % | 0.61 | 0.44 | 47 | 23 | 4 | 2 |
Comparing the values of recurrence indicators, quite high values of DET can be noticed. They reflect predictability of the system and give evidence of not big impact of measuring noise. It is worth mentioning that the highest level of determinism was reached for the experiment conducted with the use of CHP2000 type gears. Moreover, for lower loading (400 kg) determinism is lower with lubrication in comparison to the runs without lubrication. On the other hand, for the greater loading (1000 kg) the runs of acceleration are more predictable while operated with lubrication. Presence of vertical lines can be also noticed. Relatively high values of laminarity (LAM) indicate the presence of vertical lines. At the same time, average lengths of diagonal and vertical lines are short. And, quite high LMAX and VMAX values indicate the determinism of analyzed process. Furthermore, they confirm the highest regularity of braking process for CHP2000-400 experiment.
4. Conclusions
This paper presents nonlinear methods used to analyze dynamics of the elevator braking process. Two types of the gears (CHP2000 and PP16) were investigated. Different loadings (1000 kg and 400 kg) were applied during tests. Moreover, they were working in various operating conditions (with and without lubrication). Time series of accelerations vibrations (400 measuring points) were used to reconstruct the space where the process periodicity was compared. It can be assumed that higher periodicity of braking process increases durability of the brake elements and provides better comfort for the passengers. Due to the recurrence analysis it was discovered that at the initial stage of braking process (the first 200 ms) the higher periodicity exists for the lower loading (400 kg). On the other hand, at the final stage of braking process (the last 200 ms) the higher regularity was observed for the higher loading (1000 kg). While analyzing the values of recurrence indicators, similar periodicity of braking process for PP16 gears was observed regardless of operating conditions. Yet, dynamics of the braking process for CHP2000 gears changes considerably together with changing operating conditions. Summing up, it seems that higher loading increases periodicity of the process. To confirm the conclusions, more systematic research studies with more experiment repetitions should be performed.
References
-
Feng L., Bao Y., Zhou X., Wang Y. High speed elevator car frame’s finite elements analysis. Advanced Materials Research, Vol. 510, 2012, p. 298-303.
-
Filas J., Mudro M. The dynamic equation of motion of driving mechanism of a freight elevator. Procedia Engineering, Vol. 48, 2012, p. 149-152.
-
Jong de J. Understanding the natural behavior of elevator safety gears and their triggering. The International Congress on Vertical Transportation Technologies, Istambul, 2004.
-
Kayaoglu E., Salman O., Candas A. Study on stress and deformation of an elevator safety gear brake block using experimental and FEA methods. Advanced Materials Research, Vols. 308-310, 2011, p. 1513-1518.
-
Onur Y. A., Imrak C. E. Reliability analysis of elevator car frame using analytical and finite element methods. Building Services Engineering Research and Technology, Vol. 33, 2012, p. 293-305.
-
Taplak H., Erkaya S., Yildirim S., Uzmay I. The use of neural network predictors for analyzing the elevator vibrations. Mechanical Engineering, Vol. 39, 2014, p. 1157-1170.
-
Zhu W. D., Ren H. A linear model of stationary elevator traveling and compensation cables. Journal of Sound and Vibration, Vol. 332, 2012, p. 3086-3097.
-
Lonkwic P., Różyło P., Dębski H. Numerical and experimental analysis of the progressive gear body with the use of finite-element method. Maintenance and Reliability, Vol. 17, 2015, p. 542-548.
-
Lonkwic P. Influence of friction drive lift gears construction on the length of braking distance. Chinese Journal of Mechanical Engineering, Vol. 28, 2015, p. 363-368.
-
Longwic R., Litak G., Asok K. Sen. Recurrence plots for diesel engine variability tests. Verlag der Zeitschrift fur Naturforschung, Vol. 64, 2009, p. 96-102.
-
Polish Standard PN EN 81.1+A3, Safety Regulations Concerning the Structure and Installation of Lifts, Part I. Electric Lifts.
-
Eckmann J. P., Kamphorst S. O., Ruelle D. Recurrence plots of dynamical systems. Europhysics Letters, Vol. 5, 1987, p. 973-977.
-
Webber Jr., C. L., Zbilut, J. P. Dynamical assessment of physiological systems and states using recurrence plot strategies. Journal of Applied Physiology, Vol. 76, 1994, p. 965-973.
-
Zbilut J. P., Webber Jr. C. L. Embeddings and delays as derived from quantification of recurrence plots. Physics Letters A, Vol. 171, 1992, p. 199-203.
-
Zbilut J. P., Giuliani A., Webber Jr. C. L. Recurrence quantification analysis and principal components in the detection of short complex signals. Physics Letters A, Vol. 237, 1998, p. 131-135.
-
Marwan N., Romano M. C., Thiel M., Kurths J. Recurrence plots for the analysis of complex systems. Physics Reports, Vol. 438, 2007, p. 237-329.
-
Casdagli M. C. Recurrence plots revisited. Physica D, Vol. 108, 1997, p. 12-44.
-
Syta A., Jonak J., Jedlinski L., Litak G. Failure diagnosis of a gear box by recurrences. Journal of Vibration and Acoustics – Transactions of the ASME, Vol. 134, 2012, p. 041006.
-
Litak G., Gajewski J., Syta A., Jonak J. Quantitative estimation of the tool wear effects in a ripping head by recurrence plots. Journal of Theoretical and Applied Mechanics, Vol. 46, 2008, p. 521-530.
-
Litak G., Syta A., Gajewski J., Jonak J. Nonlinear analysis of the ripping head power time series. Journal of Vibroengineering, Vol. 13, 2011, p. 39-51.
-
Takens F. Detecting strange attractors in turbulence. Lecture Notes in Mathematics, Vol. 898, 1981, p. 366-381.
-
Fraser A. M., Swinney H. L. Independent coordinates for strange attractors from mutual information Physical Review A, Vol. 33, 1986, p. 1134-1140.
-
Hegger R., Kantz H., Schreiber T. Practical implementation of non-linear time series methods: the TISEAN package. Chaos, Vol. 9, 1999, p. 413-435.
-
Kantz H., Schreiber T. Non-linear Time Series Analysis. Cambridge University Press, Cambridge, 1997.
Cited by
About this article

