Abstract
The vibration signals measured from the surface of a gearbox are complex, nonlinear and non-stationary. This paper presents a novel test approach for tooth root crack fault diagnosis of a spur gearbox using an embedded piezoelectric accelerometer. This enhances the ability to extract useful fault information and provide early fault detection in gear transmission systems. The proposed method uses two piezoelectric accelerometers embedded symmetrically on the gear body, which effectively shortens the transmission path of the vibration signals stimulated by a gear fault. The proposed approach is tested by analyzing experimental data from a healthy gear system and systems with cracked gear faults. In order to extract the weak fault information from the experimental data, minimum entropy deconvolution (MED) is first used to eliminate noise from the vibration signals, and then the cyclic autocorrelation function is used to extract the frequency components. The results suggest that the proposed approach can effectively detect 2 mm and 4 mm crack faults, while traditional methods can only detect 4 mm crack faults.
1. Introduction
Gears are vital components in the majority of rotating machines that are used in modern industry. Over time, gears may experience faults such as the cracking and breakage of gear teeth due to internal and external stresses in gear transmission systems. The influences of manufacturing error, assembly error, multi-tooth meshing, and the transmission path cause vibration signals measured from gears to exhibit significant nonlinear and non-stationary characteristics. Moreover, initial gear faults are very weak, and the resulting fault information present in the vibration signal can be easily masked by ambient noise [1].
Recently, many fault detection methods have been applied to gear transmission system fault diagnosis such as minimum entropy deconvolution (MED) [2-3], ensemble empirical mode decomposition (EEMD) [4-6], wavelet transforms [7-9], spectral kurtosis [10, 11], and cyclostationary analysis [12, 13]. These methods are often combined together to increase the sensitivity of the fault detection system. Generally, vibration signals are obtained from the surface of the gearbox. An alternative method was presented by Chen Zhi [14], which used electrical current signals measured from an induction motor for gear fault diagnosis.
Due to the complexity, non-stationary characteristics, and nonlinearity of the vibration signals, early fault features may be too weak to be identified. To address this issue, most researchers have focused on methods of denoising the vibration signal. However, one key factor that affects the strength and fidelity of the vibration signal is the transmission path. The signals from gear tooth pitting or cracking are transmitted through the gear body, the gear shaft, and the bearing to the external sensor fixed on the surface of gearbox. This time varying transmission path causes the fault signals to be attenuated during the transmission process, as well as masked by noise contamination. In order to overcome these problems, W. Smith [15] and Zhiqi Fan [16] used a sensor mounted on the planet carrier to identify planetary gear bearing defects. It was demonstrated that this internal sensor offered superior performance in inner race fault detection when compared to an external sensor.
In this paper, we propose a novel test approach for gear fault diagnosis by using an embedded acceleration sensor fixed on the gear body. The goal of this method is to improve the fault detection sensitivity and effectiveness by shortening the transmission path. Vibration signals from the accelerometer are first processed by MED to eliminate noise, and then by a cyclic autocorrelation function to extract the frequency components of the signal. The fault detection performance of the proposed approach is assessed by measurements on a test gear rig.
The remainder of this paper is organized as follows. Section 2 describes the principles behind the MED algorithm and the cyclic autocorrelation function, and Section 3 presents the experimental setup. The experimental results are presented and discussed in Section 4, and conclusions are drawn in Section 5.
2. Principles of MED and the cyclic autocorrelation function
As previously mentioned, the tooth crack fault signal may be masked by deterministic gear signals present during gearbox operation, and by random noise. This section will describe the MED algorithm used to remove the noise, and the cyclic autocorrelation function used to extract the crack fault frequency.
2.1. Introduction of the MED algorithm
Minimum entropy deconvolution was initially applied by Wiggins to extract reflectivity information from seismic data [17]. It was also applied by Endo and Randall to diagnose faults caused by spalls and cracks in the gear tooth fillet region [18], and by J. Antoni to detect localized bearing faults [19].
The fundamental principle of the MED algorithm is to produce an inverse filter and search for the optimum set of filter coefficients that can recover the output signal with the minimum value of entropy. The MED filter is summarized as follows.
The output of inverse filter is given as a convolution by:
where is the length of the filter , is the input signal, and is the output signal. The normalized variance norm of the output signal is given by:
The maximum variance is found in order to attain the optimal filter coefficient by taking the derivative of Eq. (2):
By using with Eq. (1), Eq. (3) can be expressed as:
By substituting for the left side of Eq. (4), for the first terms on right side of Eq. (4), and for the second terms on right side of the Eq. (4), Eq. (4) can be written in matrix form as:
The column vector is computed from the cross correlation of the input and output signals ( and ) of the inverse filter . Then, is the Toeplitz autocorrelation matrix of the input signal and is the column vector of the required inverse filter coefficients. Based on this formulation, the optimum inverse filter is found by using an iterative method.
2.2. The cyclic autocorrelation function
Cyclic statistics have been used as a tool to exploit cyclostationary signals in fault diagnosis. The vibration signals of the gear transmission system consist of both random and periodic components. Although the vibration signals have nonlinear and non-stationary characteristics, they can be classified as a special kind of cyclostationary signal owning to their periodic statistical properties [12, 20]. The cyclic autocorrelation function analysis is introduced as follows.
For a signal , the autocorrelation function is defined as:
where is the expected value and is the time lag, or delay.
If the autocorrelation function is periodic with a period , and applied to the original signal with the sampling period (), the sampling results are ergodic. After the sampling average is used to estimate the mean, we obtain:
The Fourier series of the above periodic time-varying autocorrelation function is given as:
where is the cyclic frequency , and …–1, 0, 1,…
The Fourier coefficients of the autocorrelation function are defined as the cyclic autocorrelation function, which is given by:
By letting , Eq. (9) can be expressed as:
The function is referred to as the cyclic autocorrelation function, and it represents the signal strength at frequency . For a non-stationary signal , all non-zero values of are referred to as cyclic frequencies. The non-zero cyclic frequencies characterize the cyclostationarity of the signal [21].
2.3. Comparison of different denoising methods
Wavelet denoising and EEMD are employed to filter the raw vibration signal so their denoising performance can be compared with each other and with MED. In the wavelet denoising process, sym5 is selected as the wavelet basis function and the decomposition level is selected as 3. There are two important parameters in EEMD: the amplitude of the added white noise and the ensemble number. According to experience, the amplitude of the added white noise is roughly 0.2 times the standard deviation of the original signal, and the ensemble number is selected as one hundred. After EEMD denoising, IMF1 is classified as the noise component and removed, and the rest of the IMFs are reconstructed as the filtered signal. In the MED algorithm, two critical parameters need to be defined: the filter length and a suitable termination condition. In this paper, the filter length is set as 300, and the termination condition is set as 0.01 by using trial and error.
Fig. 1The different denoising methods: a) original signal, b) MED denoising result, c) Wavelet denoising result, d) EEMD denoising result
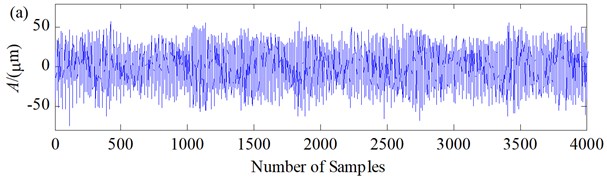
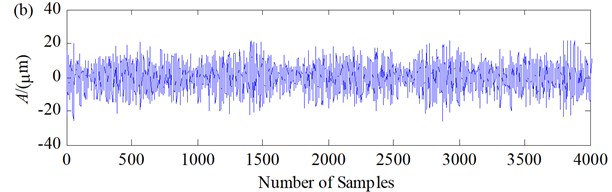
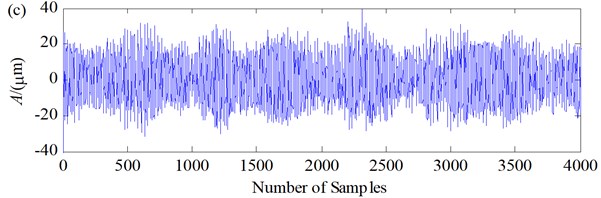
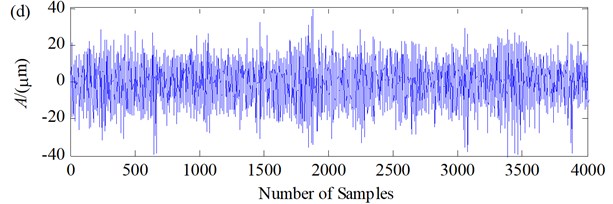
The above three denoising methods are applied to experimental data from a healthy gear system, and Fig. 1 presents the denoising results. It can be observed that the random noise is significantly reduced using all three methods. The standard deviation is employed to evaluate the denoising results, and a comparison between these three methods is shown in Table 1. The MED algorithm exhibits the best denoising results as it has the lowest standard deviation. Thus, MED is applied to the vibration signals measured from the sensors in Section 4.
Table 1Standard deviation comparison of different denoising results
Signal | Original signal | MED filtered signal | Wavelet filtered signal | EEMD filtered signal |
Standard deviation | 22.6733 | 4.1312 | 10.1263 | 7.3747 |
3. Experimental setup
3.1. Embedded acceleration sensor
In conventional gear fault diagnosis systems that monitor vibrations, accelerometers are mounted onto the surface of the gearbox as external sensors. However, the weak vibration signals from a gear crack fault are attenuated before reaching the external sensors as they propagate through complex transmission paths. Moreover, the transmission paths from the source of the fault to the external accelerometers are time-varying, which leads to modulation of the fault vibration signals.
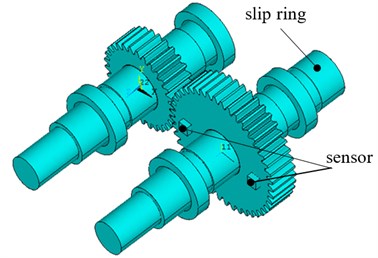
In the proposed approach, two accelerometers are symmetrically mounted directly onto the driven gear body to address the issue of a variable transmission path and enable the vibration signals to be received directly. The location of the embedded sensors is illustrated in Fig. 2. In order to transmit the vibration signals from the embedded sensors during continuous rotation of the shaft, a slip ring fixed to the driven gear shaft is used. This simplifies the construction of the measurement system, and avoids stressing the signal cable during rotation.
Fig. 2The locations of sensors and slip ring
3.2. Spur gearbox test setup
The single-stage gearbox test rig used in this study is shown in Fig. 3, and its loading manner is set up as a closed power flow cycle. The rig is composed of the main test gearbox, the accompanying test gearbox, the torsion bar, etc. Grease lubrication is used in the main test gearbox to avoid immersing the accelerometers in lubricating oil. The speed of the driving shaft is controlled by an adjustable motor. A torque speed sensor is mounted on driving shaft in order to measure the applied torque, the rotational speed, and the power of the test system. Four piezoelectric accelerometers are placed on the outer surface of the gearbox.
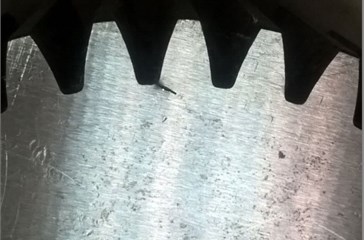
The parameters of the one-stage spur gearbox are as follows: the number of teeth on the driving gear and driven gear are 30 and 45 respectively, the module is 4 mm, the pressure angle is 20°, the tooth width is 40 mm, and the gears are made from 45 steel. Every gear shaft is supported by bearings. The gear ratio of the gearbox is 1:1.5, and a torsion bar is used to apply different torque loads during the tests. As a result of the limitation in experimental conditions, the gear crack is manufactured near the tooth root of the driven gear, and the two crack depths of 2 mm and 4 mm are obtained through wire-electrode cutting (see Fig. 4).
Fig. 3The single-stage spur gearbox test rig: 1 – accompanying test gearbox, 2 – coupling, 3 – The torque speed sensor, 4 – main test gearbox, 5 – torsion bar, 6 – shaft, 7 – accelerometer sensor
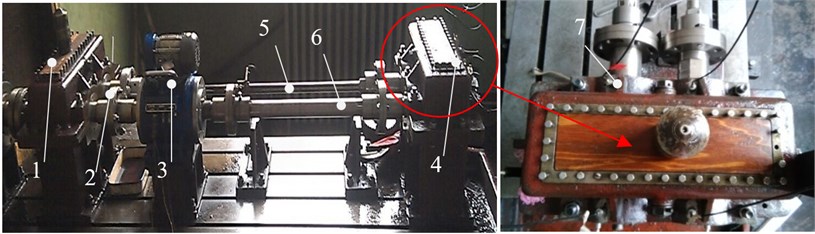
Fig. 4Artificially induced gear tooth root cracks: a) 2 mm; b) 4 mm

a)
b)
4. Results and discussion
The experiments to test the proposed vibration signal detection method for gear faults were conducted in the previously described gearbox rig. The experiments use driving shaft rotation speeds of 300, 600, 900 and 1200 r/min, and loaded torques of 100, 200, 300 and 400 Nm. The experiments were run on a healthy gear, and on gears with a 2 mm and a 4 mm tooth root crack. For all tests, the vibration signals were collected by both the embedded accelerometers and the external accelerometers.
Given the number of teeth and the driving shaft rotational speed of the gear system (shown in Table 2), the equations to calculate the mesh frequencies, harmonics frequency, and modulation frequencies are shown below:
Modulation frequency:
The mesh frequency and its harmonics:
where is the number of teeth and is the rotational speed of the driving gear in the gear system (r/min).
Table 2The frequency calculation results
Parameters | Healthy gear | 2 mm crack | 4 mm crack |
Speed (r/min) | 608 | 612 | 614 |
Driving shaft frequency (Hz) | 10.13 | 10.2 | 10.23 |
Driven shaft frequency (Hz) | 7 | 7 | 7 |
Meshing frequency (Hz) | 304 | 306 | 307 |
Harmonics 2 (Hz) | 608 | 612 | 614 |
Torque loads (nm) | 400 | 400 | 400 |
4.1. Analysis of the vibration signals from the embedded accelerometer
As stated previously, the vibration signals from sensors are first filtered by MED to attenuate the noise, and are then further processed by the cyclic autocorrelation function in order to extract the fault frequency components.
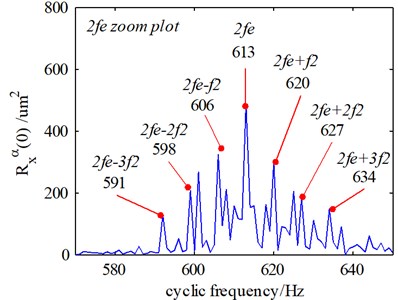
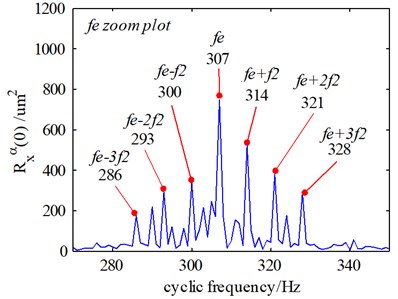
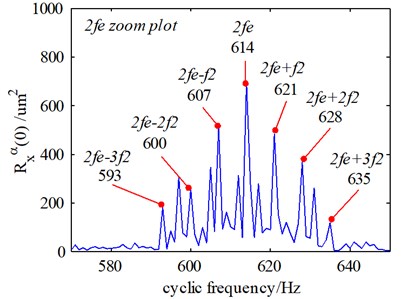
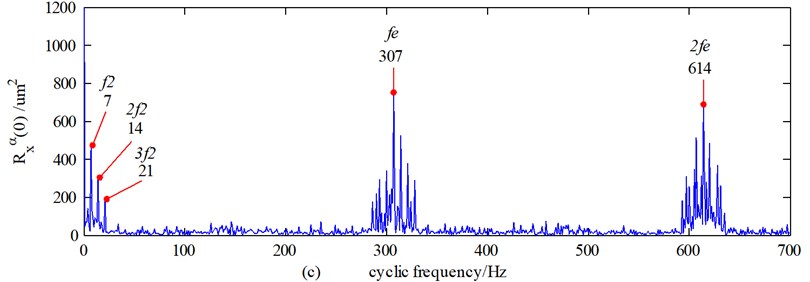
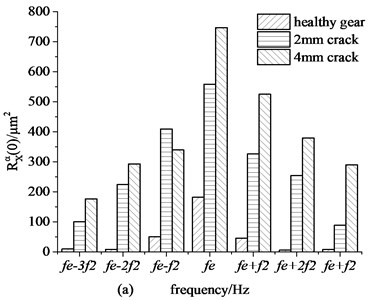
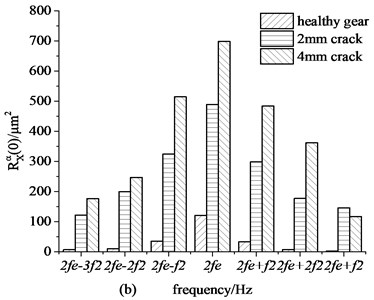
Fig. 5The frequency-domain signals processed by the cyclic autocorrelation function (embedded sensor): a) the healthy gear system, b) the 2 mm cracked gear system, c) the 4 mm cracked gear system
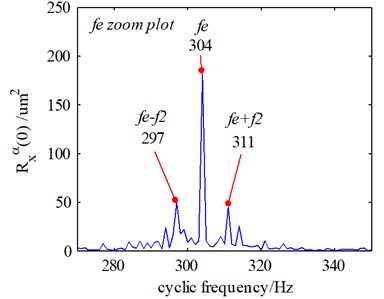
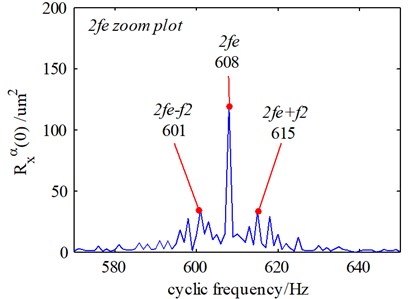
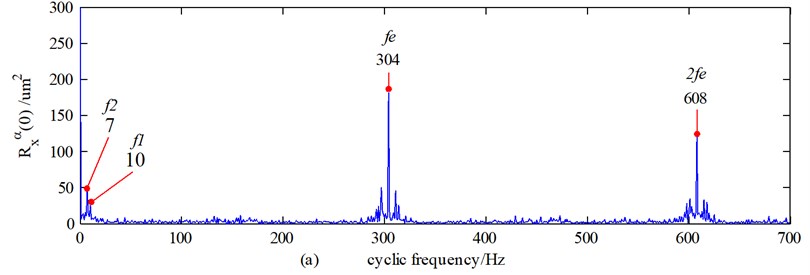
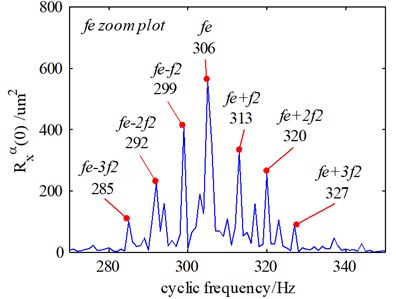
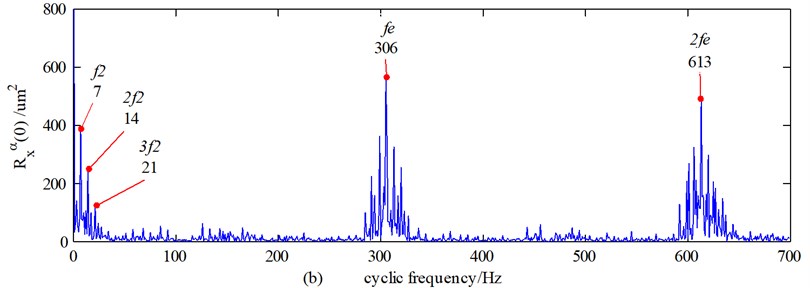
The frequency-domain signals of the healthy gear system and the cracked gear systems using the embedded sensors are shown in Fig. 5. It can be observed that for both the healthy gear system and cracked gear systems, the frequency components of the vibration signals include the mesh frequency (), its harmonics (), and sideband frequencies. For the healthy gear system (see Fig. 5(a)), there are two prominent components in the low frequency band: the driving shaft frequency (10 Hz) and the driven shaft frequency (7 Hz). In addition, sideband frequencies with an interval related to and are detected around the mesh frequency and its harmonics. For example, 297 Hz, 615 Hz. These frequency components are caused by machining and assembly errors, changed in the mesh stiffness, and tooth surface load fluctuations.
For the fault gear systems with crack depths of 2 mm and 4 mm (see Fig. 5(b) and Fig. 5(c)), the prominent components in the low frequency band are the driven shaft frequency () and its harmonics (, ). The sideband frequency components have an interval of , and , which is different from the healthy gear system in terms of both the mesh frequency and its harmonics. In this case, the frequency interval is only related to the rotational frequency of the driven gear , for example, , , , , , and so on. These frequency components are mainly induced by the gear tooth root crack.
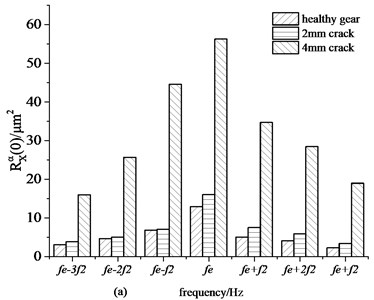
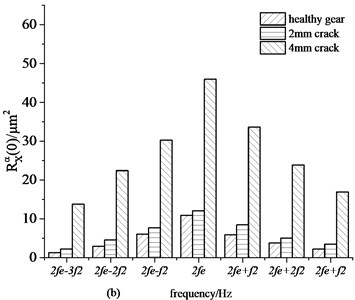
Fig. 5 shows that the frequency components for a cracked gear system are more complicated than for a healthy gear system. Moreover, it is observed that the amplitude of the vibration signals from the cracked gear system is significantly increased when compared to the healthy gear system. This is clearly shown in Fig. 6, which plots the amplitudes of the vibration signal mesh frequency and its harmonics from the embedded sensors in both the healthy gear system and cracked gear systems.
Based on the analysis above, it can be seen that the proposed embedded sensor approach can successfully detect both the 2 mm and 4 mm crack faults.
Fig. 6The increment of amplitude (embedded sensor): a) the mesh frequency (fe), b) its harmonic (2fe)
4.2. Analysis of the vibration signals from the external accelerometer
The frequency-domain signals of the healthy gear system and the cracked gear systems using the external sensors on the surface of the gearbox are shown in Fig. 7.
When comparing Fig. 7(a) (the healthy gear) with Fig. 7(b) (the gear with a 2 mm crack fault), we cannot judge whether a crack fault has occurred based on the prominent frequency components. The driven shaft frequency (), the sideband frequency components, and their corresponding amplitudes are very similar, as is clearly shown in Fig. 8 which plots these amplitudes. The sidebands frequency components including , , , and are also very similar. The conclusion is that the gear with a 2mm crack fault cannot be distinguished from a healthy gear by comparing the vibration signals obtained from the external sensors.
However, when comparing Fig. 7(a) with Fig. 7(c) (the gear with a 4 mm crack fault), we can see that the amplitude of the prominent frequency components has changed significantly (see Fig. 8). Additionally, the sidebands frequency components of the gear system with the 4 mm crack fault have an interval of , , and , which is different from the interval of only in the healthy gear system.
Based on the above analyses, we can draw the conclusion that the approach using external sensors can only successfully detect the 4 mm crack fault, but not the 2 mm crack fault.
The same conclusion can be drawn for driving gear rotational speeds of 300, 900 and 1200 r/min; the approach using the embedded sensors can successfully detect both the 2 mm and 4 mm crack faults, while only the 4 mm crack fault can be detected when using the external sensors.
Fig. 7The frequency-domain signals processed by the cyclic autocorrelation function (external sensor): a) the healthy gear system, b) the 2 mm cracked gear system, c) the 4 mm cracked gear system
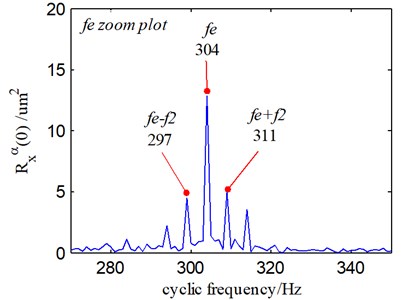
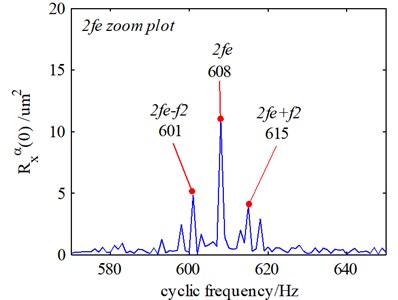
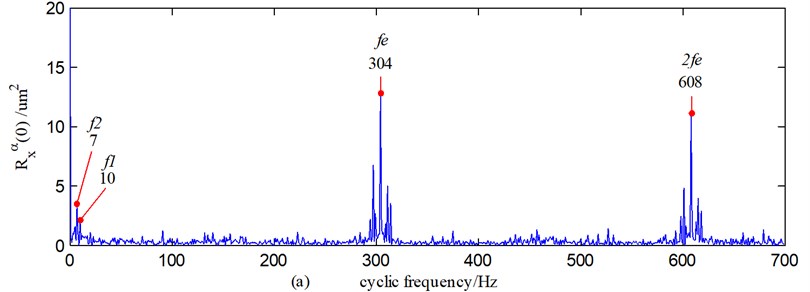
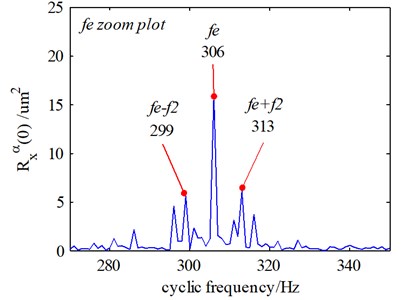
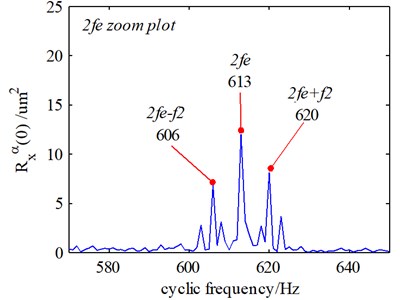
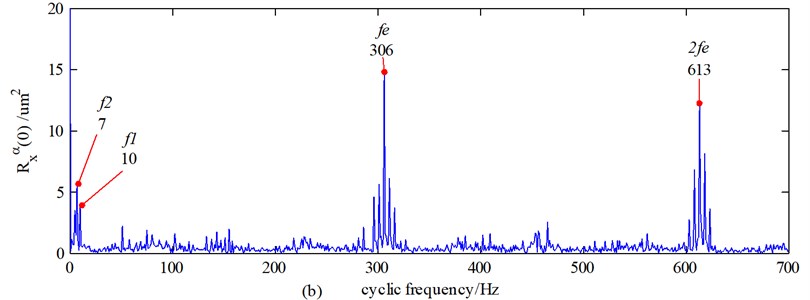
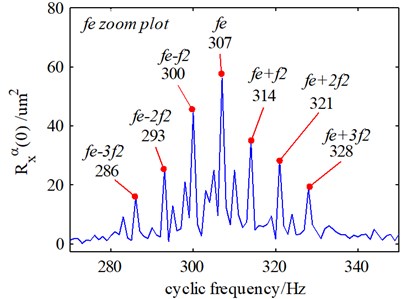
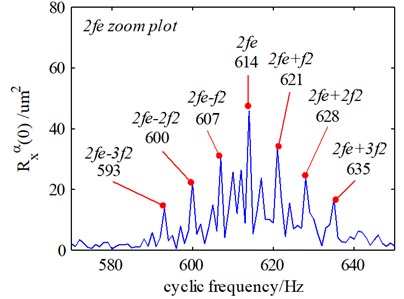
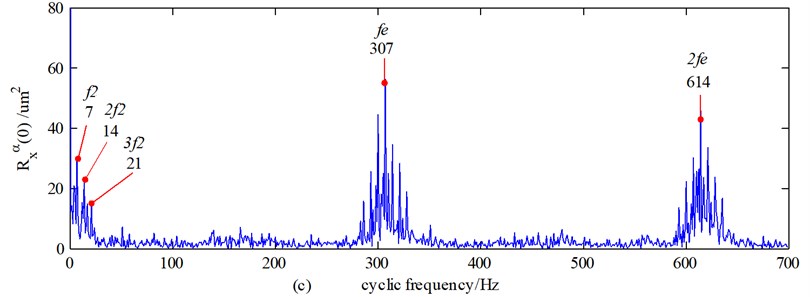
Fig. 8The increment of amplitude (external sensor): a) the mesh frequency (fe); b) its harmonic (2fe)
5. Conclusions
A novel approach using embedded sensors to enable weak fault diagnosis of gear transmission systems has been introduced and validated in this paper. The accelerometers are mounted on the rotating gear body rather than fixed on the surface of the gearbox. To address the strong nonlinear and non-stationary characteristics of the vibration signal due to interference from the environment and the transmission paths in the gear system, MED and the cyclic autocorrelation function are used to extract the fault feature frequency components from the raw signal.
Experiments were run to compare the vibration signal obtained from external and embedded sensors. The results showed that both 2 mm and 4 mm crack faults can be detected from the vibration signal using the embedded sensors, while only 4 mm crack faults can be detected from the vibration signal using the external sensors. Thus, the embedded sensor technique proposed here can be used to detect smaller faults than traditional methods, which can lead to enhanced early fault detection in gear transmission systems.
References
-
Chaari F., Fakhfakh T., Haddar M. Gear fault identification and localization using analytic wavelet transform of vibration signal. Measurement, Vol. 46, Issue 3, 2013, p. 1115-1124.
-
Endo H., Randall R. B. Enhancement of autoregressive model based gear tooth fault detection technique by the use of minimum entropy deconvolution filter. Mechanical Systems and Signal Processing, Vol. 21, Issue 2, 2007, p. 906-919.
-
He Dan, Wang Xiufeng, Li Shancang, et al. Identification of multiple faults in rotating machinery based on minimum entropy deconvolution combined with spectral kurtosis. Mechanical Systems and Signal Processing, Vol. 81, Issue 2, 2016, p. 235-249.
-
Wang Hongchao, Chen Jing, Dong Guangmimg Feature extraction of rolling bearing’s early weak fault based on EEMD and tunable Q-factor wavelet transform. Mechanical Systems and Signal Processing, Vol. 48, Issues 1-2, 2014, p. 103-119.
-
Jiang Hongkai, Li Chengliang, Li Huaxing An improved EEMD with multi-wavelet packet for rotating machinery multi-fault diagnosis. Mechanical Systems and Signal Processing, Vol. 36, Issue 2, 2013, p. 225-239.
-
Chen Xi-hui, Cheng Gang, Shan Xian-lei Research of weak fault feature information extraction of planetary gear based on ensemble empirical mode decomposition and adaptive stochastic resonance. Measurement, Vol. 73, 2015, p. 55-67.
-
Abad M. R. A. A., Ahmadi H., Moosavian A. Discrete wavelet transform and artificial neural network for gearbox fault detection based on acoustic signals. Journal of Vibroengineering, Vol. 11, Issue 1, 2013, p. 459-463.
-
Yu Jiang, Hua Zhu, Li Z. A new compound faults detection method for rolling bearings based on empirical wavelet transform and chaotic oscillator. Chaos, Solitons and Fractals, Vol. 89, Issue 1, 2016, p. 8-19.
-
Kedadouche M., Thomas M., Tahan A. A comparative study between empirical wavelet transforms and empirical mode decomposition methods: application to bearing defect diagnosis. Mechanical Systems and Signal Processing, Vol. 81, Issue 1, 2016, p. 88-107.
-
Barszcz T., Randall R. B. Application of spectral Kurtosis for detection of a tooth crack in the planetary gear of a wind turbine. Mechanical Systems and Signal Processing, Vol. 23, Issue 4, 2009, p. 1352-1365.
-
Elasha Faris, Ruiz Cristobal, Mba David Pitting detection in worm gearbox with vibration analysis. Engineering Failure Analysis, Vol. 42, Issue 4, 2014, p. 366-376.
-
Wang Zhijian, Han Zhennan,Gu Fengshou, Ning Shaohui A novel procedure for diagnosing multiple faults in rotating machinery. ISA Transactions, Vol. 55, 2015, p. 208-218.
-
Kankar P. K., Satish Sharma C., Harsha S. P. Fault diagnosis of rolling element bearing using cyclic autocorrelation and wavelet transform. Neurocomputing, Vol. 110, 2013, p. 9-17.
-
Chen Zhi, Wang Tie, Gu Fengshou Gear transmission fault diagnosis based on the bispectrum analysis of induction motor current signatures. Journal of Mechanical Engineering, Vol. 48, Issue 21, 2012, p. 84-90.
-
Smith W., Deshpande L., Randall R., Li H. Gear diagnostics in a planetary gearbox: a study using internal and external vibration signals. 6th International Congress of Condition Monitoring and Diagnostic Engineering Management, Journal of Physics, Vol. 3, Issue 2, 2013, p. 36-41.
-
Fan Zhiqi, Li Huaizhong A hybrid approach for fault diagnosis of planetary bearings using an internal vibration sensor. Measurement, Vol. 64, 2015, p. 71-80.
-
Wiggins R. A. Minimum Entropy Deconvolution, Geoexploration, Vol. 16. Elsevier Scientific Publishing, Amsterdam, 1978.
-
Endo H., Randall R. B., Gosselin C. Differential diagnosis of spall vs. cracks in the gear tooth fillet region: experimental validation. Mechanical Systems and Signal Processing, Vol. 23, Issue 3, 2009, p. 636-651.
-
Randall R. B., Antoni J. Rolling element bearing diagnosis – a tutorial. Mechanical Systems and Signal Processing, Vol. 25, Issue 2, 2011, p. 485-520.
-
Li Li, Qu Liangsheng Cyclic statistics in rolling bearing diagnosis. Journal of Sound and Vibration, Vol. 267, Issue 2, 2003, p. 253-265.
-
Saidi L., Fnaiech F., Henao H., Capolino G.-A., Cirrincione G. Diagnosis of broken bars fault in induction machines using higher order spectral analysis. ISA Transactions, Vol. 52, Issue 1, 2013, p. 140-148.
About this article

This paper is supported by National Natural Science Foundation of China, (No. 50775157) and Basic Research Project of Shanxi Province (No. 2012011012-1).
