Abstract
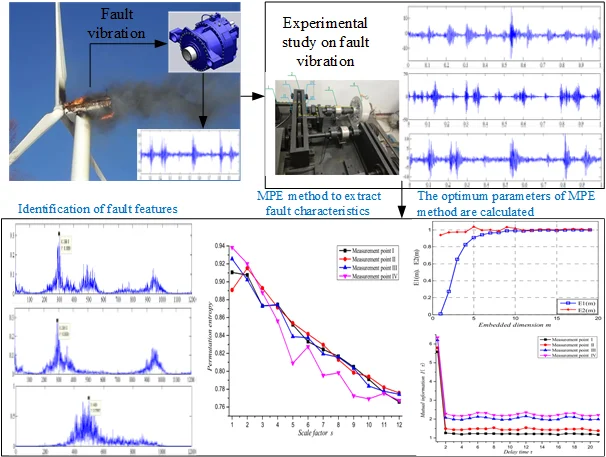
Multiscale Permutation Entropy (MPE) is a presented nonlinear dynamic technology for measuring the randomness and detecting the nonlinear dynamic change of time sequences and can be used effectively to extract the nonlinear dynamic wear fault feature of gear tooth surface from vibration signals of gear set. To solve the subjectivity drawback of threshold parameter selection process in MPE method, a joint calculation method based on the Mutual Information (MI) and improved False Nearest Neighbor (FNN) principle for calculating threshold parameters for MPE method was presented in this article. Then, the influence of threshold parameters on the identification accuracy of fault features with the MPE was studied by analyzing simulation data. Through the simulation analysis, the effectiveness of the proposed MPE method is validated. Finally, the wear failure test of spur gear was carried out, and the proposed method was applied to analyze the experimental data of fault signal. Meanwhile, the vibration characteristics of the fault signal are acquired. The analysis results show that the proposed method can effectively realize the fault diagnosis of gear box and has higher fault identification accuracy than the existing methods.
Highlights
- Fault identification technology
- Multi scale permutation entropy
- Mutual information method
- Improved false nearest neighbor method
1. Introduction
Gear trains always work under tough circumstance such as varying loading and heavy background noise, and the fault vibration signal about the gear wear is originally weak, prone to be contaminated by background noise [1, 2]. Recently, due to the computational simplicity, anti-noise and calculating robustness, entropy provides a new way to extract fault feature about mechanical equipment and has been widely applied in various applications [3, 4]. Due to the complexity and variability of practical problems, in order to make the value of entropy method to solve these problems efficiently. For illustration, the approximate entropy method, fuzzy entropy method, sample entropy method and multiscale permutation entropy (MPE) method [5, 6]. The MPE method expands from single scale to multi-scale phase space, so as to ensure the integrity of local information and overall information of the vibration characteristic [7, 8]. Additionally, this method can not only effectively solve the disturbance of noise to fault characteristics, but also competently detect weak fault signals. Simultaneously, the MPE method can solve the multi-scale coupling problem between multiple faults and accurately reflect the dynamic mutation capability of the fault system [9].
The calculation of MPE method is closely interconnected to the algorithm parameters, and dissimilar embedding dimensions and delay time will have great influence on the calculation results of entropy value. In this paper, a new technique for gear fault identification is developed using MI and improved FNN techniques for MPE method. Firstly, according to the basic principle and advantage of MI method, the minimum parameter of delay time is implemented of fault vibration signal. Then, the optimal embedding dimension is calculated by the improved FNN method of the phase space. Finally, through simulation analysis and gear fault experimental research, and a joint calculation method based on the MI and improved PNN principle for calculating threshold parameters for MPE method was confirmed in this article.
2. Review of the theoretical backgrounds
2.1. Principle of MPE
(1) Construct the phase space matrix of time sequences is shown in Eq. (1):
where, is the embedding dimension; is the delay time; is the number of reconstructed components.
(2) Ascending arrangement of elements in each reconstructed component is shown in Eq. (2):
(3) Calculation the entropy value and normalization is shown in Eq. (3):
(4) Coarse granulation time sequences and calculate the permutation entropy value is shown in Eq. (4):
2.2. The method of calculation crucial threshold parameters
2.2.1. Principle of the MI method
That is, the relationship between MI of time sequences and delay time is shown in Eq. (5):
where, is the probability distribution function of ; is the probability distribution function of ; is the combined probability distribution function of , .
2.2.2. Principle of the Improved FNN Method
The FNN points method is applied to calculate the relationship between and , as shown in Eqs. (6-7):
where, -dimensional time sequences , and the nearest neighbor point ; -dimensional time sequences , and the nearest neighbor point ; is the -norm.
3. Numerical simulation and verification
In this section, the simulation model is shown in Eq. (8):
And the parameter settings are shown in Table 1.
3.1. The analysis of delay time
This is illustrates in Fig. 1, and shows that: when the length of time sequences is short, the correlation between sequences is powerful. Conversely, the correlation of time sequences is faintly.
3.2. Embedded dimension analysis of time sequences
According to the basic theory of improved (FNN) point method, and four different lengths of the simulation signal are taken to calculate the embedding dimension are shown in Fig. 2. The analysis showed that: While the length of the time sequences is short, the correlation between the signals is high, but the effective characteristics are difficult to distinguish from the noise signals. On the contrary, the correlation between signals is weak, and the fault signal characteristics are not obvious.
Fig. 1The relationship between delay time and time sequences length
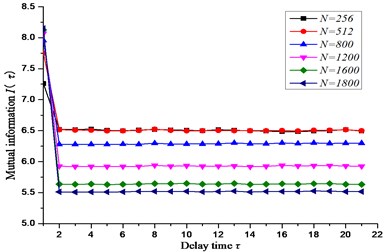
Table 1Input parameters of the simulation signal
Signal designation | Parameter setting |
Initialize signal | |
Random signal | Mean: 0; Variance: 1 |
Pulse signal | Frequency of 0.1 Hz |
Sample length | 800/1200/1600/1800 |
3.3. Analysis of the relationship between permutation entropy and threshold parameters
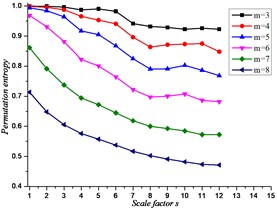
The relationship between the permutation entropy and the length of the time sequences is investigated based on the six groups of different lengths in Table 1. And the results are shown in Fig. 3. The entropy value decreases of the equivalent time sequences with the increase of embedding dimension. While the length of time sequences increases, the corresponding permutation entropy of value also increases slightly.
The fluctuation relationship between the length of time sequences and scale factor is obtained in Fig. 5, and the scale factor and the embedded dimension of time sequences is achieved in Fig. 6. It can be obtained that: the permutation entropy value of time sequences is inversely proportional to the embedded dimension and scale factor.
Fig. 2The relationship between embedding dimension and length of signal
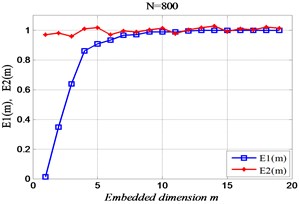
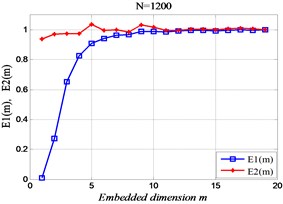
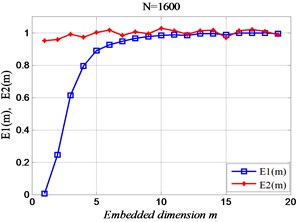
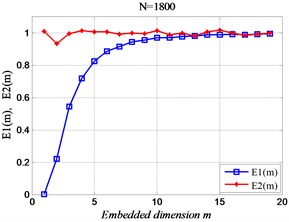
Fig. 3The relationship between the length and time of embedded dimension of time sequences
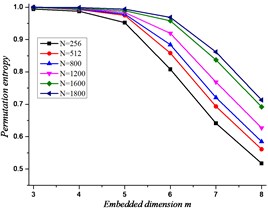
Fig. 4The relationship between the length and delay time sequences
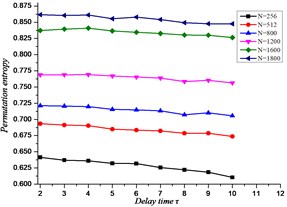
Fig. 5The relationship between scale factor and sample length of time sequences
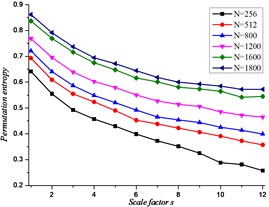
Fig. 6The relationship between scale factor and embedded dimension
4. Experimental verification and analysis
The layout of the laboratory table is shown in Fig. 7. Then, the four experiment points and parameters as follows: test point I, test point II, test point III and test point IV; input speed is 1500 r/min; the input current of the magnetic powder loader is 0.1 A; Modulus of gear 2 mm, Number of teeth 55, Tooth width 20 mm. 1. Motor input shaft, 2. Measured gear box, 3. Torque transducer, 4. Magnetic powder loader.
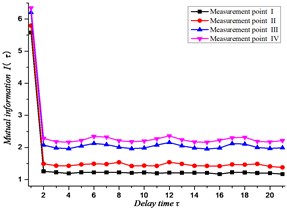
4.1. Calculate the delay time of the time sequences
Through simulation analysis, the results are obtained as shown in Fig. 8. As can be seen from the figure, the analysis shows that the delay time values of the time sequence at the four measuring points on the gearbox are all 2.
Fig. 7The test bench
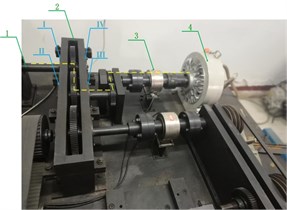
Fig. 8The MI curve at each measuring point
4.2. Calculate the embedding dimension of time sequences
According to the calculation principle of the improved FNN point method, the results shown in Fig. 9 is acquired. It is shows that: while the value of the embedding dimension is 5, it is the most reasonable of the time series at the four measuring points on the gearbox.
Fig. 9The improved FNN proportion at each measuring point
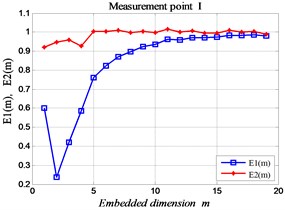
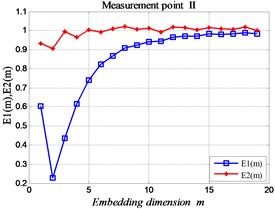
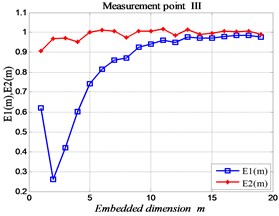
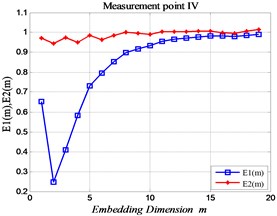
Fig. 10The MPE curve of each measuring point in normal state
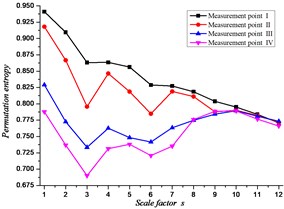
Fig. 11The MPE curve of each measuring point in malfunction state
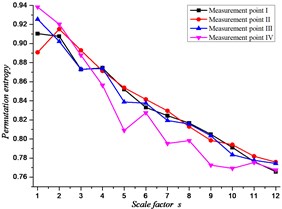
4.3. Multiscale permutation entropy method for fault identification
According to the research results of the above relevant chapters, the analysis parameters were set by 5, 2, 12. In the normal state (No fault), calculate the MPE value of the time sequences of the four measuring points on the gearbox is shown in Fig. 10, and the fault state is shown in Fig. 11. Shows that, according to the vibration variation of the signal, it can be adjudicated that the gear has gear tooth wear fault in the gearbox.
5. Conclusions
Conclusions are drawn as follows: The joint calculation method based on the MI and improved FNN principle for calculating threshold parameters for MPE method was presented. Compared with the trial algorithm given in related literature, the joint calculation method can improve the recognition of dynamic mutation of fault sequence by MPE method. Then, the fault identification simulation model for wear failure of gear tooth surface by MPE method was simulated, and the effectiveness of the proposed MPE method was validated. Finally, the wear failure test of spur gear was carried out, and the vibration characteristics of the fault signal are obtained by the method of MPE. Furthermore, With the experiment, it is efficient to identification the vibration signal for gear tooth surface wear fault.
References
-
Merainani B., Rahmoune C., Benazzouz D., et al. A novel gearbox fault feature extraction and classification using Hilbert empirical wavelet transform, singular value decomposition, and SOM neural network. Journal of Vibration and Control, Vol. 24, Issue 12, 2017, p. 2512-2531.
-
Hou F. T., Chen J., Dong G. M. Weak fault feature extraction of rolling bearings based on globally optimized sparse coding and approximate SVD. Mechanical Systems and Signal Processing, Vol. 111, 2018, p. 234-250.
-
Watt S. J., Politi A. Permutation entropy revisited. Chaos, Solitons and Fractals, Vol. 120, 2019, p. 95-99.
-
Xu M. Q., Wei Y., Li Y. B., et al. Gearbox fault diagnosis based on local mean decomposition, permutation entropy and extreme learning machine. Journal of Vibroengineering, Vol. 18, Issue 3, 2016, p. 1459-1473.
-
Chen D. N., Zhang Y. D., Yao C. Y., et al. Fault diagnosis based on FVMD multi-scale permutation entropy and GK fuzzy clustering. Journal of Mechanical Engineering, Vol. 54, Issue 14, 2018, p. 16-27.
-
Yan X. A., Jia M. P. Intelligent fault diagnosis of rotating machinery using improved multiscale dispersion entropy and mRMR feature selection. Knowledge-Based Systems, Vol. 163, 2019, p. 450-471.
-
Xia J. A., Shang P. J., Wang J., et al. Permutation and weighted-permutation entropy analysis for the complexity of nonlinear time series. Communications in Nonlinear Science and Numerical Simulation, Vol. 31, 2016, p. 60-68.
-
Gan X., Lu H., Yang G. Fault diagnosis method for rolling bearings based on composite multiscale fluctuation dispersion entropy. Entropy, Vol. 21, Issue 3, 2019, p. 290-305.
-
Ge M., Lv Y., Yi C. C, et al. A joint fault diagnosis scheme based on tensor nuclear norm canonical polyadic decomposition and multi-scale permutation entropy for gears. Entropy, Vol. 20, Issue 3, 2018, p. 161-183.
Cited by
About this article

This work was supported partially by the National Natural Science Foundations of China (No. 51175419) and Shaanxi Key Laboratory of Machinery Manufacturing Equipment Construction Project, which are highly appreciated by the authors.
