Abstract
Fatigue damage in engineering structures is universal. The occurrence of fatigue cracks brings unpredictable hidden dangers to a structure in terms of safety and service performance. Traditional damage identification methods, such as power spectrum analysis, are mostly based on linear elasticity theory that cannot reflect the typical nonlinear characteristics of fatigue cracks and cannot meet the higher requirements of the signal analysis method put forward by current mass detection data. To solve this problem, a numerical model of a cantilever beam with a breathing crack is established in this study. A method for diagnosing fatigue damage is studied by combining bispectral analysis and a statistical normal cloud model, which characterize the nonlinear characteristics of the structure. This method can effectively describe the nonlinear characteristics of the structure and reasonably evaluate the degree of fatigue damage in the structure. The bispectrum-normal cloud model method proposed in this study overcomes the limitations of existing linear damage detection methods in nonlinear damage detection, and can improve the efficiency of signal analysis from a statistical point of view. It has good prospects for structural nonlinear damage assessment.
1. Introduction
Detection of cumulative damage in a structure in long-term service has been a hot issue in many fields and disciplines [1, 2]. In engineering practice, generally speaking, the dynamic response of intact structures is linear, and the occurrence of fatigue damage leads to a nonlinear dynamic response in structures. Different from power spectrum analysis [3], the application of bispectrum in nonlinearity has been gradually discovered. Collis et al. [4] proved that second order nonlinearity between signals with the same power spectrum and different phases can generate a second order phase coupling signal; Boltezar et al. [5] applied bispectral analysis to the dynamic analysis of a washing machine rotor and Yang Jiangtian et al. [6] also proved by experiments that bispectral analysis could extract fault features of rolling bearings more effectively.
Health monitoring for major engineering structures such as large bridges and hydro-junctions has been gradually improved, but good results have not yet been achieved. The main problem lies in the lack of signal processing methods that can extract damage features from mass data. In this study, a normal cloud model is introduced that takes into account the fuzziness and randomness of things in essence, making good use of parameters to express them quantitatively. In this study, a cantilever beam model with fatigue cracks is established. Bispectral analysis is used to characterize the nonlinear dynamic characteristics of asymmetric structures. The normal cloud model is introduced. Damage to a cantilever beam structure is studied from the viewpoint of statistical probability by using the sensitivity of bispectrum to nonlinear damage and the characteristics of fuzzy region classification of a cloud model diagnosis of injury severity.
2. Bispectral dynamic analysis
It is assumed that the mean value of a real random signal is zero and k-order is stationary. If the -order cumulant of exists, the k-order spectrum is defined as the ()-dimensional Fourier transform of :
When 3, the third-order spectrum is also called bispectrum, expressed as .
3. Bispectrum-normal cloud model analysis
Assuming that represents the degree of damage of a cracked cantilever beam, and is the qualitative concept of , if () is the bispectrum analysis result of any damage state in , and satisfies the following two conditions:
1) ;
2) The degree of certainty of on is, then the distribution of on can be called a normal cloud model [7], where is the expected value of spatial distribution; entropy is a comprehensive measure of uncertainty of qualitative concepts; hyper-entropy is the entropy of entropy, representing the uncertainty of entropy; , and is the normal distribution of expectation and the variance is .
4. Validation of numerical simulation
4.1. Cantilever beam model with cracks
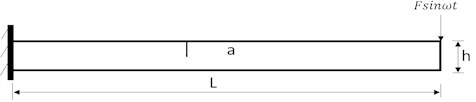
A cantilever beam model with length 0.5, width 0.04 and height 0.02 is established as shown in Fig. 1. It contains unilateral penetrating non-propagating fatigue cracks with depth a. The free end is subjected to a simple harmonic load . The dimensionless parameter is defined to indicate the depth of fatigue cracks and it also represents the degree of damage of the fatigue cracked cantilever beam in this study.
Fig. 1Structure diagram of the fatigue cracked cantilever beam
In many previous studies, to simplify the research process, opening crack models have been used. In real engineering structures, however, cracks mostly show a periodic breathing state. Gudmundson [8] performed relevant experiments and concluded that using an opening crack model would result in failure to accurately evaluate the degree of damage in structures with fatigue cracks. Therefore, the breathing crack model is used to simulate fatigue cracks in this study.
4.2. Bispectrum-normal cloud benchmark model
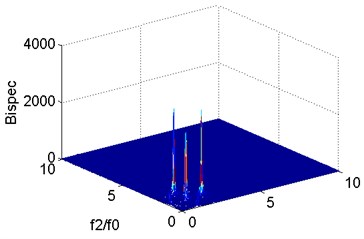
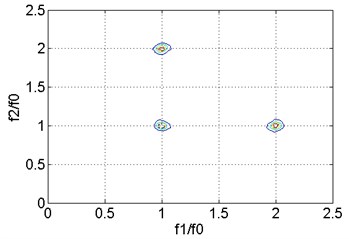
The vibration signals of the cantilever beam at 0.1 are obtained and analyzed by spectral analysis, power spectral analysis, and bispectral analysis. The results are shown in Fig. 2. From the spectrum in Fig. 2(a) and the power spectrum in Fig. 2(b), the first-order natural frequency is fully stimulated, but the second-order or even higher-order harmonic components cannot be observed. In contrast, the second harmonics in the bispectrum in Fig. 2(c) and (d) are very obvious. Compared with traditional spectrum analysis or power spectrum analysis, bispectral analysis is more sensitive to nonlinear signals and more suitable for nonlinear damage detection of fatigue cracks.
Fig. 2Analysis result of vibration signal when m= 0.1
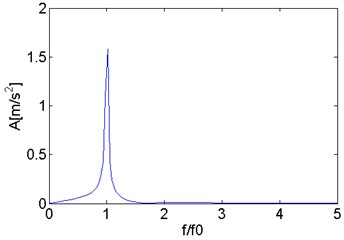
a) Spectrum of the vibration signal
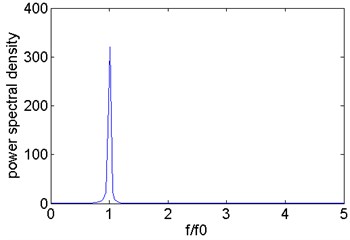
b) Power spectrum of the vibration signal
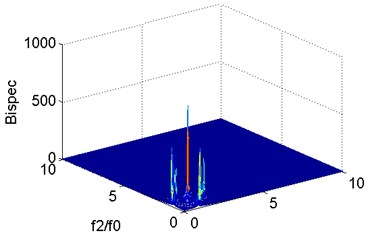
c) Three-dimensional spectrogram of bispectral analysis
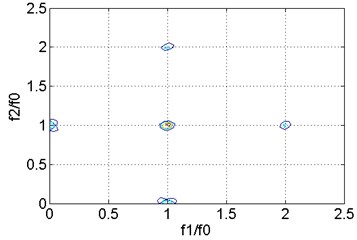
d) Two-dimensional slice spectrum of bispectral analysis
Fig. 3Bispectral analysis of vibration signals in training group
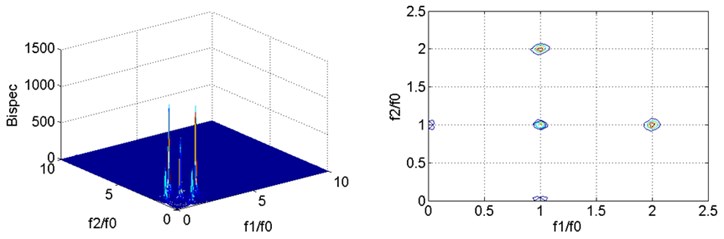
a) Bispectral analysis of vibration signal at 0.2
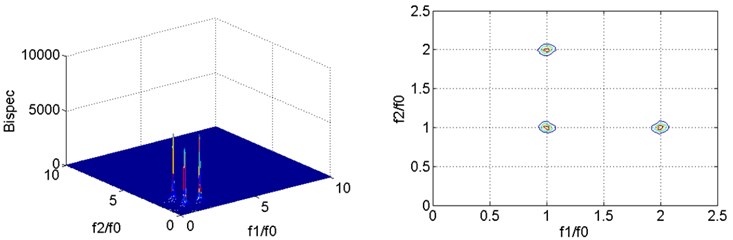
b) Bispectral analysis of vibration signal at 0.4
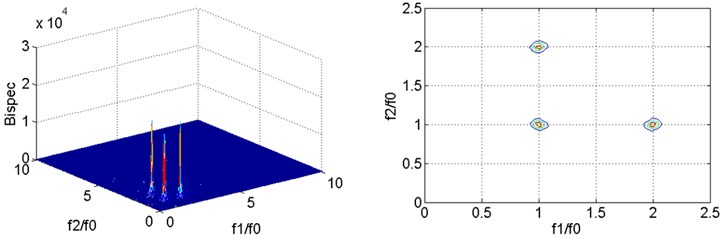
c) Bispectral analysis of vibration signal at 0.6
In this study, zero damage, 0.1, 0.2, 0.4, 0.6 are used as the criteria for the diagnosis of damage severity. The bispectral analysis results of vibration signals at 0.2, 0.4, and 0.6 are shown in Fig. 3.
It can be seen from the two-dimensional slice spectrums of bispectral analysis that the second harmonic component can be detected for fatigue cracks under each damage condition except for the first natural frequency, and the two-dimensional slice spectrums in Fig. 3. show obvious similarity because only single damage at a single location is studied in this study. In the three-dimensional bispectrum, the amplitude of the second harmonic obviously increases with the increase in fatigue crack depth, which is an approximately exponential growth trend.
As aforementioned, the degree of damage in the cantilever beam is categorized in four grades, (0-0.1), (0.1-0.2), (0.2-0.4), and (0.4-0.6). Four clouds corresponding to the four levels are recorded as D1, D2, D3, and D4, respectively, as shown in Fig. 4.
Fig. 4Normal cloud model curves for each assessment level (N= 3000)
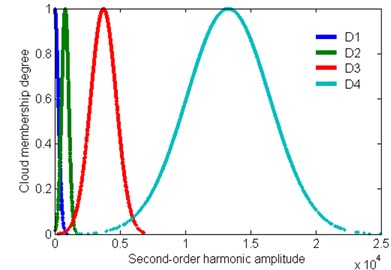
Fig. 5Bispectral analysis of vibration signal at m= 0.3
4.3. Diagnosis of degree of damage
In this study, the vibration signal at 0.3 is selected to diagnose the degree of damage and to validate the normal cloud benchmark model. Vibration signals are extracted for bispectral analysis. The results are shown in Fig. 5. The amplitude of the second harmonic component is extracted as the digital feature of cloud droplets under such a damage condition, the corresponding determinacy is calculated as (0, 0, 0.7981, 0.0059), and the extent of damage is (0.2-0.4), consistent with the actual situation.
5. Conclusions
Owing to long term practice and other reasons, damage in structures mostly appears as nonlinear fatigue damage. In this study, the finite element model of a cantilever beam with a crack is established using the breathing crack model. From this perspective, the damage assessment method based on the bispectrum-normal cloud model is studied. The results of numerical simulation show that this method can effectively evaluate the degree of damage of a cantilever beam structure. Some appealing observations about the method based on the bispectrum and normal cloud model in evaluating the degree of fatigue damage are as follows:
1) Compared with the traditional power spectrum analysis method, the bispectral analysis method is more sensitive to nonlinear signals and has higher accuracy in detecting second harmonics.
2) Bispectral analysis of vibration signals of a cracked cantilever beam shows that the amplitude of the second harmonic clearly increases with an increase in the fatigue crack depth, and the trend is approximately exponential.
References
-
Xu W., Cao M. S., Radzieński M., Xia N., Su Z. Q., Ostachowicz W., Wang S. S. Detecting multiple small sized damage in beam type structures by Teager energy of modal curvature shape. Journal of Vibroengineering, Vol. 17, Issue 1, 2015, p. 275-286.
-
Cao M. S., Zhu X., Xu W., Li X. M., Xu H., Manoach E. Detection of debonding in steel-reinforced bridges using wavelet curvature features of laser-measured operating deflection shapes. Journal of Vibroengineering, Vol. 19, Issue 3, 2017, p. 1845-1853.
-
Akaike H. Power spectrum estimation through autoregressive model fitting. Annals of the institute of Statistical Mathematics, Vol. 21, Issue 1, 1969, p. 407-419.
-
Collis W. B., White P. R., Hammond J. K. Higher-order spectra: the bispectrum and trispectrum. Mechanical Systems and Signal Processing, Vol. 12, Issue 3, 1998, p. 375-394.
-
Boltezar M. Some aspects of washing complex non-linear dynamics. Selected Topics in Structronics and Mechatronic Systems, Vol. 3, 2003, p. 83-120.
-
Yang J., Chen J., Zeng Z. Bispectral analysis and its application in machinery diagnosis. China Mechanical Engineering, Vol. 11, Issue 4, 2000, p. 424-426.
-
Li D. Membership clouds and membership cloud generators. Computer Research and Development, Vol. 32, Issue 6, 1995, p. 15-20.
-
Gudmundson P. The dynamic behaviour of slender structures with cross-sectional cracks. Journal of the Mechanics and Physics of Solids, Vol. 31, Issue 4, 2010, p. 329-345.
About this article

This work was supported by the National Key R&D Program of China (No. 2018YFF0214705) and the National Natural Science Foundation of China (Nos. 11772115 and 51708173).
