Abstract
In the nonlinear ultrasonic technique, the nonlinear received signal, such as second harmonic generation (SHG) signal in higher harmonic experiments, is complicated and non-stationary time series which reflects the fatigue damage of metal components. To effectively evaluate the fatigue damage of metal components, especially the earlier fatigue damage, the chaos and fractal theory are proposed to analyze the received signal of higher harmonic experiments. Chaotic characteristics, for example Lyapunov exponent, correlation dimension and Kolmogorov entropy, are extracted to evaluate the fatigue damage. Experiments results indicate that chaotic characteristics can reasonably characterize and evaluate the fatigue state of beams, which the variation trend of chaotic characteristics has a close relationship with fatigue crack propagation. Furthermore, chaotic characteristics are very sensitive to earlier fatigue damage of used connecting rods, especially the Lyapunov exponent. Therefore, chaos and fractal theory could effectively extract the nonlinear received signals, and chaotic characteristics could reasonably evaluate the fatigue damage state of metal components.
1. Introduction
In the long-term service of metal components, the unrecoverable fatigue or damage would be occurred under cyclic loading, therefore the fatigue damage detection and evaluation of metal components are very necessary to ensure the security service of metal components. The ultrasonic method is one of the most useful non-destructive detection techniques. In recent years, higher harmonics with frequency of or are experimentally observed in fatigued or damaged parts due to the nonlinear interaction of large-amplitude ultrasound [1, 2], where is the frequency of driving ultrasonic.
Related study has shown that the nonlinear ultrasonic technique is a useful nondestructive detection method [3, 4]. The ultrasonic nonlinear parameter is commonly applied to quantitatively evaluate and detect the fatigue damage [5], creep damage [6] and microscopic cracks [7] of metallic components in nonlinear ultrasonic technique. The parameter is calculated according to , where and are amplitudes of the second harmonic and fundamental wave obtained by Fast Fourier Transform of SHG signal [8]. While the FFT is more suitable for the analysis of stationary linear signal. Actually, the SHG signal in higher harmonic experiments is a non-stationary [9], weak and complicated nonlinear time series which indirectly reflects the cumulative fatigue damage of metallic components [10]. Therefore, how to effectively extract the SHG signal and more reasonably evaluate the fatigue damage state of metallic components are key issues in nonlinear ultrasonic technique.
The development of chaos and fractal theory has provided a theoretical basis for deep analysis the nonlinear time series [11, 12], for example they are widely applied in fault diagnosis and feature extraction of mechanical equipment’s. Based on vibration signals of mechanical system, chaos and fractal theory are used to analyze them, chaotic characteristics, such as correlation dimension and maximum Lyapunov exponent, are calculated for fault diagnosis of systems [13, 14]. However, the vibration signal contains much noise and it is very difficult to extract the fault features of system.
Foong, Chee-Hoe [15] theoretically studied the nonlinear dynamic response of beams caused by fatigue crack propagation which the nonlinear system changed from periodic state to chaotic state, this demonstrated that beams with fatigue crack propagation were a chaotic system. Wang L [16] applied the fractal theory to investigate the collective evolution of short fatigue cracks and proposed a Paris-type damage model. Zheng. G et al. [17] found that the crack paths in Si3N4 composite had a very obvious fractal characteristic. Carrillo. J and Avila. W [18] applied fractal dimension of cracking to assess the seismic damage of thin and lightly reinforced concrete walls. Wu. J et al. [19, 20] applied the Lyapunov exponent of Duffing oscillator based on ultrasonic guided waves for defect detection of pipes. According to those studies, the metal component with fatigue crack is a nonlinear dissipative system, the dynamic response of system would be influenced by fatigue crack propagation which leads to chaotic state. Therefore, metal components with fatigue crack can be acted as a chaotic system in the process of fatigue crack evolution.
When the ultrasonic wave propagates in metal components with fatigue crack or damage, the nonlinear interaction would be occurred, and high harmonics are generated. Therefore, the SHG signal is another nonlinear time series relating to the fatigue damage of metallic components. However, there is little information about applying the chaos and fractal theory to analyze the SHG signal in nonlinear ultrasonic technique. Thus, in order to effectively evaluate the fatigue damage of metallic components based on nonlinear analysis, the chaos and fractal theory are proposed to analyze the SHG signal, instead of the vibration signal, for fault diagnosis and feature extraction of nonlinear systems.
Therefore, in this paper, chaos and fractal theory are applied to extract the nonlinear properties of SHG signal. The higher harmonic experiments are conducted on two kinds of components to collect SHG signals, chaotic characteristics, such as Lyapunov exponent, Kolmogorov entropy and correlation dimension, are calculated from SHG signals to evaluate the fatigue states of metallic components. Chaotic characteristics could effectively characterize and evaluate the fatigue damage of metal components, especially the earlier fatigue damage.
2. Chaotic characteristics and its algorithms
Because chaotic characteristics are calculated from SHG signals to evaluate the nonlinearity of metallic components, thus the calculation methods are introduced in this section.
2.1. Lyapunov exponent
The basic feature of chaotic system is extremely sensitive to initial conditions, tracks generated by two close initial values separate exponentially with time, and the Lyapunov exponent studies this feature [11]. In n-dimensional phase space, the long-term evolution process of an infinitesimal n-sphere with initial condition is monitored, which the sphere would become an ellipsoid due to locally deformation. The th Lyapunov exponent is defined according to the length of ellipsoidal principal axis [21]:
The small data quantity method is commonly used to calculate the maximum Lyapunov exponent from time series [12]. If a time series with embedding dimension and time delay , the reconstructed phase space is:
The nearest neighboring point is searched for each point and the brief separation is limited, namely:
where is the average period of time series. For each pair of initial neighboring points, the distance after discrete steps is:
For each discrete step, is the average value of all :
where is the number of non-zero . The optimal fitting curve of is gotten using least square method which the slope of straight line is maximum Lyapunov exponent .
2.2. Kolmogorov entropy
Kolmogorov entropy describes the degree of how quickly information produced in nonlinear system and is an important characteristic of attractor which measures the randomness of system. The value of Kolmogorov entropy could reflect the complexity of nonlinear system. A continuous dynamical system in -dimensional phase space, the space is divided into many -dimensional boxes with length . If a trajectory is in the state space and the time interval is selected a small value . The joint probability indicates the trajectory is in box at initial time, then in box at , next in box at , then in box at , and finally in box at the time , therefore the definition of Kolmogorov entropy is:
The maximum likelihood method is usually applied to calculate Kolmogorov entropy from time series which is proposed by Schouten [22].
2.3. Correlation dimension
The fractal dimension is another important characteristic of attractor and widely used in quantitative description the nonlinear behavior of system. The correlation dimension is one of them which measures the complexity of attractors [16]. The G-P algorithm is applied to calculate the correlation dimension from time series proposed by Grassberger and Procaccia [23]. In -dimensional phase space, if the distance between two points and is less than a given value , the associated components are called for them [24, 25]. There are points in this space, the correlation integral is a proportion of relating vector number:
Here is the Heaviside unit function:
The correlation dimension is defined as:
The double logarithmic relationship between the given value and is taken and the curve is fitted using the least squares method, which the slope is correlation dimension .
According to the calculation methods of chaotic characteristics, the corresponding MATLAB programs are written to calculate Lyapunov exponent, Kolmogorov entropy and correlation dimension from SHG signals applying the small data quantity method, maximum likelihood method and G-P algorithm.
3. Experimental setup
In this study, there are two kinds of metal components for higher harmonic experiments: 45steel beams with different fatigue cycles and used connecting rods.
Firstly, in order to study the variation tendency of chaotic characteristics throughout the fatigue process, 45steel beams with different fatigue cycles are prepared. 45steel beams are machined from a piece of steel plate. The size is 130 mm×30 mm×15 mm, and there is a wire-cutting mechanical gap in the middle of beams to form the stress concentration region which the length is 5 mm and the width is 0.18 mm. The physical map of beams is shown in Fig. 1.
Fig. 1The physical map of 45steel beams
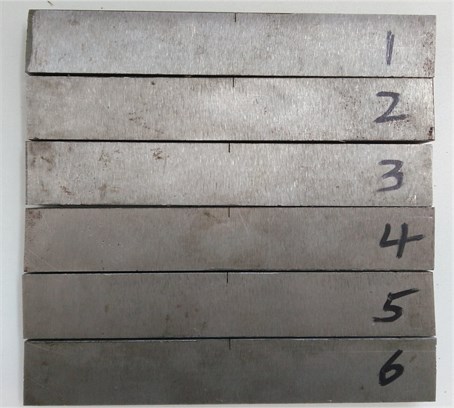
There are six beams numbered 1, 2, 3, 4, 5, and 6. Beams are performed the three-point bending fatigue test to obtain different fatigue state, which the schematic diagram is illustrated in Fig. 2. The span between two fulcrum points is 110 mm, the maximum loading force is –1.8 kN, the stress ratio is 10 and the loading frequency is adaptive which is about 130 Hz in this loading system. Beams 5 and 6 are firstly performed the fatigue test until failure which the fatigue life is 178 k and 185 k cycles, thus the fatigue life for this pair of beams is about 180 k cycles. According to the linear cumulative fatigue damage theory, Palmgren-Miner rule, the fatigue damage, D, is defined as the ratio of cyclic cycles, n, to the fatigue life of material, N, that is . Therefore, in this paper the fatigue damage state of beams can be contained according to the Palmgren-Miner rule. Because of the fatigue life of this pair of beams is about 180 k, when the experimental parameters and loading condition of fatigue test are the same, if the cyclic cycles of beams is 18 k, 36 k, 54 k, 72 k, 90 k, 108 k, 126 k, 144 k and 162 k, the fatigue damage of beams would be about 10 %, 20 %, 30 %, 40 %, 50 %, 60 %, 70 %, 80 % and 90 %. Therefore, beams with different fatigue states could be obtained according to three-point bending fatigue test. Secondly, the interrupted fatigue tests are carried on beams 1, 2, 3 and 4 until the failure of beams. When the cyclic cycles are reached, the fatigue experiment is interrupted to obtain different fatigue states of beams, then higher harmonic experiments are conducted on loaded beams to collect SHG signals.
Fig. 2The schematic diagram of three-point bending fatigue test for beams
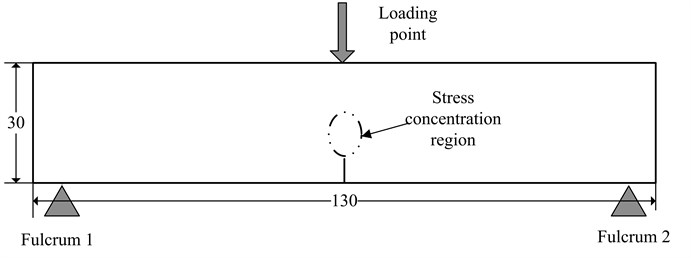
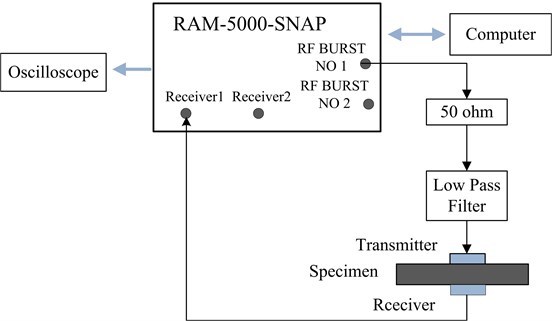
Fig. 3(a) shows the schematic diagram of higher harmonic experiments for beams. The driving signal is generated by RAM-5000-SNAP system, next passes through 50 ohm load for impedance matching. The low-pass filter is applied to decrease higher frequency interferences. Two longitudinal wave transducers with center frequencies of 5 MHz and 10 MHz are used as the transmitter and receiver, respectively. The position of transmitter locates at the tip of mechanical gap, as shown in Fig. 3(b), and the receiver is located at the same position of opposite side. The vaseline is evenly smeared the interfaces of beam and transducers to enhance the coupling. The receiving signal, that is SHG signal, is sent to the receiver1 channel of RAM-5000-SNAP system for frequency spectrum analysis. At the same time the SHG signal is recorded by an oscilloscope for chaotic analysis. In order to reduce the random error, each experiment is repeated eight times.
Furthermore, in order to verify the sensitivity of chaotic characteristics to earlier fatigue cumulative damage, the second pair of components is connecting rods removed from diesel engines which have same service conditions. There are three connecting rods which the service times is 0 h, 296 h and 450 h respectively, as shown in Fig. 4.
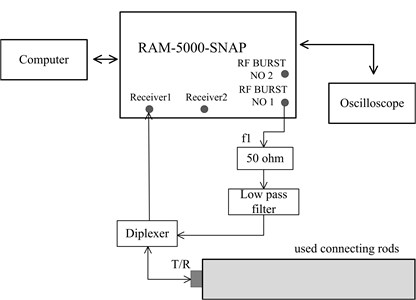
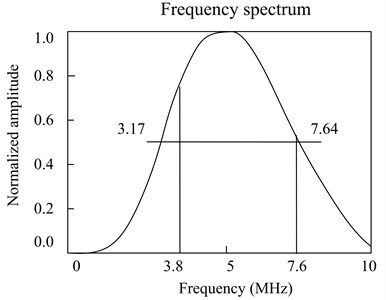
The schematic diagram of higher harmonic experiment for connecting rods is shown in Fig. 5(a). The longitudinal transducer with central frequency of 5 MHz is applied, which the type is A110S-RM made by olympus and the wafer diameter is 0.25 inch, and it is connected to diplexer acting as both transmitter and receiver in nonlinear ultrasonic experiment for connecting rods. Because the shape of connecting rod is irregular, in order to reduce the energy loss of ultrasonic, the transducer is placed on the bottom of big circle of connecting rod. According to the frequency response of transducer shown in Fig. 5(b) which is taken from the test certificate, if the driving frequency is 3.8 MHz, the transducer could perfectly receive the fundamental signal at 3.8 MHz and the second harmonic at 7.6 MHz. Therefore, in the higher harmonic experiment for connecting rods, the driving frequency is 3.8 MHz and the signal width is 8 us. The SHG signal is recorded by the oscilloscope, and then transferred to a computer for further signal processing.
Fig. 3a) schematic diagram of higher harmonic experiment for beams, b) planform of transmitter position
a)

b)
Fig. 4The physical map of connecting rods
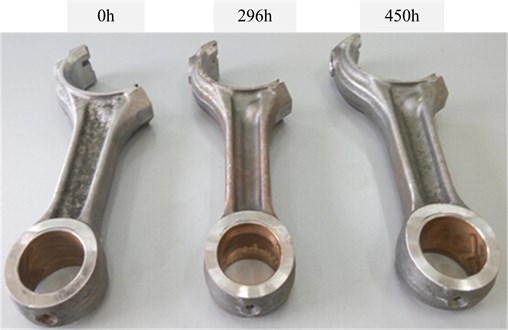
Fig. 5a) the schematic diagram of higher harmonic experiment for used connecting rods, b) the frequency spectrum of transducer
a)
b)
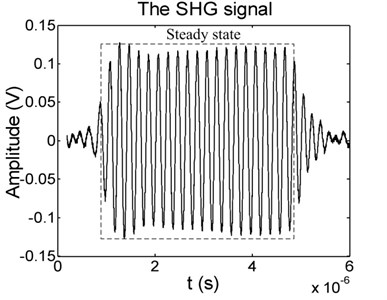
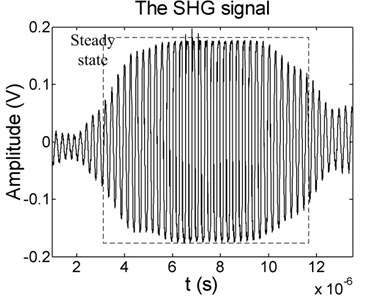
Fig. 6(a) shows the time domain waveform of SHG signal for beam1 with 30 % fatigue cycles when the driving frequency is 5 MHz and the signal width is 4 us, while Fig. 6(b) is the time domain waveform of connecting rods with 450 h service time which the driving frequency is 3.8 MHz and the signal width is 8 us. It can be seen from Fig. 6 that SHG signals contain a steady state in the middle part and transient parts at the beginning and end. In order to exactly analyze the variation rule of ultrasonic nonlinear parameter and chaotic characteristics, a rectangular window is applied to extract the steady state for further signal analysis which the Fast Fourier Transform and chaos theory are utilized to extract the nonlinear characteristics.
Fig. 6The SHG signal of receiver for: a) beam1 with 30 % fatigue cycles when the driving frequency is 5 MHz and the width is 4 us, b) connecting rod with 450 h service time when the driving frequency is 3.8 MHz and the width is 8 us
a)
b)
4. Results and discussion
4.1. Calculation chaotic characteristics from SHG signals
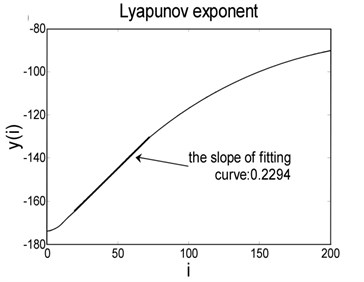
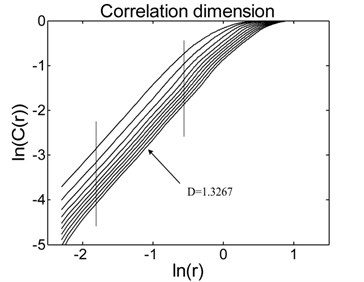
Based on collected SHG signals, the phase space reconstruction is firstly conducted on time series to calculate characteristic values of attractors, the optimal delay time and embedding dimension are gotten to reconstruct high-dimensional phase space. For the SHG signal shown in Fig. 6(a), 7 and 10 are obtained using C-C method [26]. In 10-dimensional phase space, the Lyapunov exponent , Kolmogorov entropy and correlation dimension of attractor are calculated. Fig. 7(a) and 7(b) display calculation results of Lyapunov exponent and correlation dimension.
Fig. 7Calculation results of: a) the Lyapunov exponent, b) correlation dimension for the SHG signal shown in Fig. 6(a)
a)
b)
When calculating the Lyapunov exponent from the SHG signal shown in Fig. 6(a), the relationship between discrete step and is gotten as displayed in Fig. 7(a). The least square method is applied to fit the straight part which the slope is Lyapunov exponent, therefore 0.2294 is the Lyapunov exponent of SHG signal shown in Fig. 6(a).
When estimating the correlation dimension of attractor, the double logarithmic relationship between given value and correlation integral is taken and curves are fitted using the least square method, then the slope is correlation dimension . Thus in Fig. 7(b), the correlation dimension of SHG signal shown in Fig. 6(a) is 1.3627.
4.2. Chaotic characteristics for beams with different fatigue state
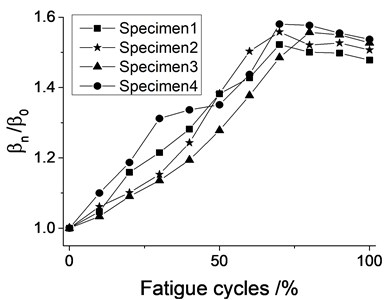
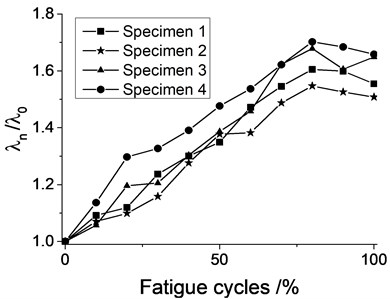
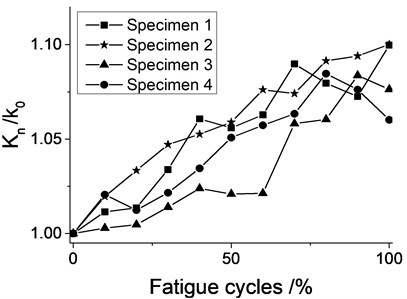
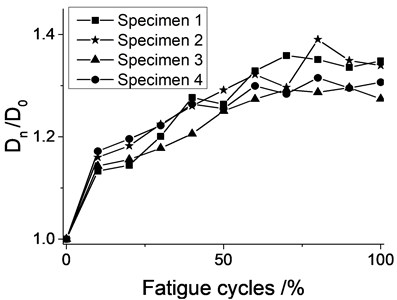
Based on SHG signals of 45steel beams, firstly the ultrasonic nonlinear parameter , Lyapunov exponent , Kolmogorov entropy and correlation dimension of undamaged beams are calculated applying the definition of ultrasonic nonlinear parameter , small data quantity method, maximum likelihood method and G-P algorithm. Then a series of ultrasonic nonlinear parameter and chaotic characteristics , , are calculated from SHG signals when the fatigue states of beams are 10 %, 20 %, 30 %, 40 %, 50 %, 60 %, 70 % ,80 %, 90 % and 100 %, where the subscript represents different fatigue state. At last the ultrasonic nonlinear parameter and chaotic characteristics are normalized according to , , , and . In the process of fatigue for beams, the variation trend of nonlinear parameter, Lyapunov exponent, Kolmogorov entropy and correlation dimension are drawn in Fig. 8.
Fig. 8Variation curves of four characteristic values when the fatigue cycles of beams increase from 0 % to 90 %: a) the ultrasonic nonlinear parameter, b) the Lyapunov exponent, c) Kolmogorov entropy, d) the correlation dimension
a)
b)
c)
d)
As can be seen from Fig. 8, the overall variation tendency of ultrasonic nonlinear parameter, Lyapunov exponent, Kolmogorov entropy and correlation dimension of four beams are similar although some differences are existed among them. With increase of fatigue cycles, the ultrasonic nonlinear parameter and chaotic characteristics increase gradually, which the related increments are about 60 %, 75 %, 10 % and 40 %, respectively. In addition, when the fatigue cycles are more than 70 %, four characteristic values tend to be stable. The variation trend of correlation dimension for fatigued beams is similar to Wang L’s results [16]. Throughout the fatigue process, chaotic characteristics have similar variation trend with ultrasonic nonlinear parameter, and the Lyapunov exponent is the most sensitive to fatigue of beams. The experiment results indicate that chaotic parameters could reasonably characterize and evaluate the fatigue state of beams.
Because the Lyaounov exponent indicates the chaotic degree of system, Kolmogorov entropy measures the randomness of nonlinear system, and correlation dimension represents the complexity of attractor. In the process of fatigue crack extension, the size, quantity, complexity and randomness of cracks and the microstructure of beams have been changing. Due to the beams with prefabricated mechanical gap, the tip of gap would firstly appear microscopic cracks by cyclic loading. The quantity of cracks increases, the size enlarges, and the microstructure of beams would become more complex with cyclic cycles, thus the complexity and randomness of cracks become big, and four characteristic values increase with fatigue cycles. When fatigue cycles are about 70 %, beams have appeared macroscopic crack, the ultrasonic nonlinear parameter, Lyapunov exponent, Kolmogorov entropy and correlation dimension reach a maximum value. When the macroscopic crack has been appeared, the attenuation of ultrasonic would become obvious especially the second harmonic, therefore the ultrasonic nonlinear parameter tends to be stable. At the late stage of fatigue crack extension, the size of cracks becomes bigger, the beam would fracture at any moment. However, the quantity of crack and the complexity of the crack extension path haven’t changed much, the Lyapunov exponent, Kolmogorov entropy and correlation dimension would become stable. Therefore, in the process of fatigue, chaotic characteristics could well evaluate the fatigue state of beams and reveal the complexity and randomness of fatigue crack propagation.
4.3. Chaotic characteristic analysis of used connecting rods
When the driving frequency is 3.8 MHz and the width of driving signal is 8 us, higher harmonic experiments are conducted on three connecting rods with service time of 0h, 296 h and 450 h, respectively, SHG signals are collected by an oscilloscope for analyzing the chaotic characteristics. The SHG signal of connecting rod with 450 h service time is shown in Fig. 6(b), and the corresponding frequency spectrogram is shown in Fig. 9.
Fig. 9Spectrum of SHG signal for used connecting rods when the driving frequency is 3.8 MHz
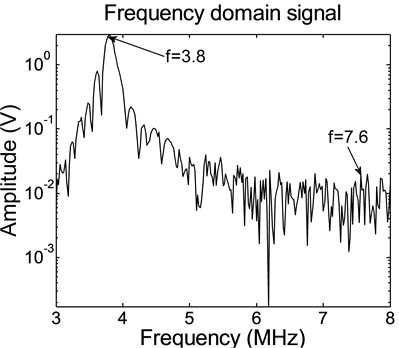
From the frequency spectrum shown in Fig. 9, there are strong signal at 3.8 MHz and very weak second harmonic at 7.6 MHz which couldn’t be distinguished from nearby signals. This illustrates the nonlinearity of connecting rods is very weak.
Based on SHG signals, the ultrasonic nonlinear parameter and chaotic characteristics of three connecting rods are calculated and listed in Table 1, where the values are the mean of four repeating experiments. The increments of four characteristics values are computed according to , where and indicate the ultrasonic nonlinear parameters and chaotic characteristics at 450h and 0h, respectively.
Table 1Four characteristics values of used connecting rods
Service time (h) | 0 | 296 | 450 | Increment (%) |
Nonlinear parameter (V-1) | 1.5206×10⁻³ | 1.5189×10⁻³ | 1.5293×10⁻³ | 0.57 |
Lyapunov exponent | 0.2227 | 0.2276 | 0.2294 | 1.66 |
Kolmogorov entropy | 0.5351 | 0.5382 | 0.5396 | 0.84 |
Correlation dimension | 1.1889 | 1.1937 | 1.2035 | 1.23 |
As shown in Table 1, ultrasonic nonlinear parameters of three connecting rods with 0 h, 296 h and 450 h service time are 1.5206×10⁻³V-1, 1.5215×10⁻³V-1 and 1.5293×10⁻³V-1. The increment of ultrasonic nonlinear parameter is only about 0.57 % when the service time increases to 450 h. According to ref [27], when the connecting rod of diesel engines made in china appears macroscopic cracks, it has worked about 24000 h. Furthermore, the fatigue life is about 80 % when the macroscopic cracks are emerged in actual engineering applications. Thus, the total fatigue life of connecting rods is about 30000 h. Due to the fact that the service time of used connecting rod are 296 h and 450 h respectively, the fatigue life is about 296 h/30000 h = 0.99 % and 450 h/30000 h = 1.5 %, which indicates the accumulation fatigue damage of connecting rods is very weak. Therefore, the ultrasonic nonlinear parameter calculated from the frequency spectrum of SHG signals is very small.
It also can be seen from Table 1, when the service time of connecting rods increases to 450 h, the Lyapunov exponent adds from 0.2227 to 0.2264 which the growth rate is 1.66 %, Kolmogorov entropy increases from 0.5351 to 0.5396 fortifying about 0.84 %, while the correlation dimension augments from 1.1889 to 1.2035 which increases about 1.23 %. It can be concluded that although the fatigue damage degree of connecting rods is very weak, the Lyapunov exponent, correlation dimension and Kolmogorov entropy still monotonously increase with service time. This illustrates the nonlinearity of connecting rods is ever-increasing.
Furthermore, comparing the ultrasonic nonlinear parameter and characteristics values shown in Table 1, the most obvious increment is Lyapunov exponent, then correlation dimension, followed by Kolmogorov entropy, and finally ultrasonic nonlinear parameter. Therefore, chaotic characteristics, especially the Lyapunov exponent, could well evaluate and characterize the earlier cumulative fatigue damage of used connecting rods, the chaos and fractal theory can effectively extract the nonlinearity of SHG signals which may provide an effective analysis method for nonlinear received signals in nonlinear ultrasonic technique.
5. Conclusions
In this paper the chaos and fractal theory are proposed to analyze SHG signal in higher harmonic experiments. For 45steel beams with different fatigue states, chaotic characteristics increase gradually with fatigue cycles which has a close relationship with fatigue crack propagation and could well reveal the fatigue state of beams, in particular, the Lyapunov exponent is very sensitive to fatigue degree of beams. For used connecting rods, due to the fact that the fatigue cumulative damage is very weak, the increment of ultrasonic nonlinear parameter is relatively small which is only about 0.59 %. Chaotic characteristics monotonously increase with service time which the increments of Lyapunov exponent, correlation dimension and Kolmogorov entropy are 1.66 %, 1.23 % and 0.84 %, respectively, this indicates chaotic characteristics, especially the Lyapunov exponent, can well evaluate and characterize the earlier fatigue damage of used connecting rods. Therefore, the chaos and fractal theory can efficiently extract the ultrasonic nonlinear signal in nonlinear ultrasonic experiments.
References
-
Buck O., Morris W. L., Richardson J. M. Acoustic harmonic generation at unbonded interfaces and fatigue cracks. Applied Physics Letters, Vol. 33, Issue 5, 1978, p. 371-373.
-
Morris W. L. Acoustic harmonic generation due to fatigue damage in high-strength aluminum. Journal of Applied Physics, Vol. 50, Issue 11, 1979, p. 6737-6741.
-
Chillara V. K., Lissenden C. J. Review of nonlinear ultrasonic guided wave nondestructive evaluation: theory, numerics, and experiments. Optical Engineering, Vol. 55, Issue 1, 2016, p. 11022.
-
Shui G. S., Wang Y. S., Huang P., et al. Nonlinear ultrasonic evaluation of the fatigue damage of adhesive joints. NDT & E International, Vol. 70, 2015, p. 9-15.
-
Kim J., Jacobs L. J., Qu J., et al. Experimental characterization of fatigue damage in a nickel-base superalloy using nonlinear ultrasonic waves. The Journal of the Acoustical Society of America, Vol. 120, 3, p. 2006-1266.
-
Balasubramaniam K., Valluri J. S., Prakash R. V. Creep damage characterization using a low amplitude nonlinear ultrasonic technique. Materials Characterization, Vol. 62, Issue 3, 2011, p. 275-286.
-
Lee T. H., Jhang K. Y. Experimental investigation of nonlinear acoustic effect at crack. NDT & E International, Vol. 42, Issue 8, 2009, p. 757-764.
-
Nussbaumer H. J. Fast Fourier Transform and Convolution Algorithms. Springer-Verlag, New York, 1982.
-
Seggie D. A., Hoddinott C. J., Leeman S., et al. Mapping ultrasound pulse-echo non-stationarity. Pattern Recognition and Acoustical Imaging, Vol. 768, 1987, p. 241-247.
-
Chen T. L., Que P. W., Zhang Q., et al. Ultrasonic signal identification by empirical mode decomposition and Hilbert transform. Review of Scientific Instruments, Vol. 76, Issue 8, 2005, p. 85101-85109.
-
Kantz H., Schreiber T. Nonlinear Time Series Analysis. Cambridge University Press, Cambridge, 1997.
-
Cohen M. E., Hudson D. L. Chaos Time Series Analysis. Wiley Encyclopedia of Electrical and Electronics Engineering, San Francisco, 1999.
-
Sun Z. Q., Chen C. Z., Gu Y. L., et al. Incipient fault diagnosis of large scale wind turbine gearbox based on chaos theory and sampling integral technology. Journal of Vibration and Shock, Vol. 32, Issue 9, 2013, p. 113-117.
-
Takuma M., Shinke N., Nishiura T., et al. Acoustic emission evaluation systems of tool life for shearing of piano and stainless wires. Journal of Acoustic Emission, Vol. 24, 2006, p. 52-66.
-
Foong C., Pavlovskaia E., Wiercigroch M., et al. Chaos caused by fatigue crack growth. Chaos, Solitons and Fractals, Vol. 16, 2003, p. 651-659.
-
Wang L., Wang Z., Xie W., et al. Fractal study on collective evolution of short fatigue cracks under complex stress conditions. International Journal of Fatigue, Vol. 45, 2012, p. 1-7.
-
Zheng G. M., Zhao J., Li L., et al. A fractal analysis of the crack extension paths in a Si3N4 ceramic tool composite. International Journal of Refractory Metals and Hard Materials, Vol. 51, 2015, p. 160-168.
-
Carrillo J., Avila W. Assessment of seismic damage of thin and lightly reinforced concrete walls using fractal dimension of cracking. Earthquake Engineering and Structural Dynamics, Vol. 46, Issue 4, 2017, p. 661-675.
-
Zhang W. W., Wu J., Ma H. W. Ultrasonic guided wave inspection method based on Lyapunov exponents. Journal of Vibration Measurement and Diagnosis, Vol. 35, Issue 2, 2015, p. 250-257.
-
Wu J., Wang Y., Zhang W. W., et al. Defect detection of pipes using Lyapunov dimension of Duffing oscillator based on ultrasonic guided waves. Mechanical Systems and Signal Processing, Vol. 82, 2016, p. 130-147.
-
Wolf A., Swift J. B., Swinney H. L., et al. Determining Lyapunov exponents from a time series. Physica D Nonlinear Phenomena, Vol. 16, Issue 3, 1985, p. 285-317.
-
Schouten J. C., Takens F., van den Bleek C. M. Maximun-likelihood estimation of the entropy of an attractor. Physical Review E, Vol. 49, Issue 1, 1994, p. 126-129.
-
Grassberger P., Procaccia I. Measuring the Strangeness of Strange Attractors. Springer, New York, 2004.
-
Carpinteri A. A fractal analysis of size effect on fatigue crack growth. International Journal of Fatigue, Vol. 26, Issue 2, 2004, p. 125-133.
-
Shayegh F., Sadri S., Amirfattahi R., et al. A model-based method for computation of correlation dimension, Lyapunov exponents and synchronization from depth-EEG signals. Computer Methods and Programs in Biomedicine, Vol. 113, Issue 1, 2014, p. 323-337.
-
Hu Y., Chen T. Phase-space reconstruction technology of chaotic attractor based on C-C method. Journal of Electronic Measurement and Instrument, Vol. 26, Issue 5, 2012, p. 425-430.
-
Jiang H., Ye J., Xiao Y., et al. Connecting rod fatigue life calculation based on dynamic simulation and FEA. Diesel Engine, Vol. 35, Issue 2, 2013, p. 22-25.
Cited by
About this article

This work was supported by the National Natural Science Foundation of China (Grant Numbers 51365006, 51445013), the Natural Science Foundation of Guangxi (Grant Number 2016GXNSFAA380119), the Manufacturing System and Advanced Manufacturing Technology of Guangxi Key Laboratory Project (Contact Number 14-045-15S05).
