Abstract
Structural analysis is mainly concerned with predicting the behaviour of a structure when subjected to any external excitation. Dynamic analysis of simple structures can be carried out using finite element analysis on various computing platforms such as MatLab. In the case of industrial applications, dynamic analysis is mainly carried out using simulations on softwares such as Ansys. The present paper compares mathematical and simulation analysis of cracked beam and the dynamic behaviour with respect to mode shape and crack position is reported.
1. Introduction
Structural design is one of the subjects in which researchers have shown profound interest over the past five decades. Dynamic analysis of structures is one among many topics in structural design. Simple beams such as cantilever and fixed-fixed beams form a basic beam structure. Establishing the dynamic characteristics of these simple structures enables the design process to be faster and more accurate. The most challenging step in any structural analysis is the construction of a mathematical model of the structure. This mathematical model consists of differential equations whose solutions describe the changes in the system, which can be expressed as a mathematical analytic function. This numerical technique is called as Finite Element Analysis (FEA). Finite element method helps the designer in reducing the number of prototypes used for experimentation and optimize the overall design process. Over the past few years, there has been a rise in emphasis towards performance and reliability of structures. This has led to the need for substantial enhancement in methods of dynamic analysis of structures. One such method is the use of simulation software’s. Simulation software in structural analysis is a set of algorithms that allows the designer to build a model of the structure, apply the various excitation conditions and simulate structural behaviour. It has been proved that the method of simulation of structures is faster, efficient and enables the designer to better understand the behaviours.
In the past decades, many researchers have extensively worked on the structural dynamics in finding natural frequencies and mode shapes for various beams with various boundary conditions. This has shown further interest towards beams with small discontinuities such as cracks.
Qian [1] established a finite element model of cracked beam and proposed a simple method for crack detection with respect to eigen couple. Deokar [2] performed experimental modal analysis (EMA) on uncracked and cracked beams and predicted crack parameters using natural frequencies. Bagal [3] carried out FEA using Ansys and experimental testing to study the depth of crack in cracked beams. Mazaheri [4] demonstrated the dynamic analysis of cracked concrete beams using experimental testing and FEA. Liu [5] analysed the modal parameters of cracked cantilever beams using perturbation methods and compared the computation results with experimental results.
Dynamic analysis approximations of cracked beam can be carried out using both analytical as well as simulation methods. Natural frequencies obtained by both methods will show a certain amount of deviation from each other for a given mode for various reasons.
The present paper demonstrates the trend in the natural frequency deviation between two methods, for a particular mode, with respect to position of the crack. In Section 2, the beam geometry and material properties are established, and the mathematical model used for Finite Element Analysis is constructed. Dynamic computation of analytical model is carried out in MatLab and various mode shapes are demonstrated. Section 3 explains the simulation process adopted with respect to various parameters in Ansys (Version 18.2). In Section 4, results obtained by both analytical and simulation methods are tabulated and significant observations in the deviation of natural frequency for cracked beam are made. The deduced trends can be used as a benchmark for further study of cracked beam dynamics using analytical and simulation approaches. It also widens scope for improved methods of analytical modelling and simulation of structures.
2. Analytical model
This section demonstrates the analytical model used for finite element analysis of an Aluminium (Grade 6082) cracked beam. In order to perform dynamic analysis, two boundary conditions are considered, namely fixed-fixed and cantilever beams. The material properties and dimensional parameters of the cracked beam considered are tabulated in Table 1. The formulation of the mathematical model i.e., FEA is carried out using Matlab.
Table 1Beam material property and geometry
Parameters | Notation | Value |
Breadth | 30 mm | |
Thickness | 6 mm | |
Crack width | 0.4 mm | |
Crack depth | 3 mm | |
Young’s modulus | 71 GPa | |
Density | 2710 kg/m3 | |
Poisson’s ratio | 0.3 |
2.1. Beam geometry
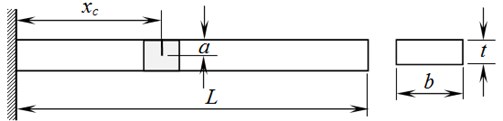
A rectangular cross-section beam of length , breadth and thickness are considered. The beam consists a crack of depth , located at a distance of from its fixed end, as shown in Fig. 1.
Fig. 1Cantilever beam with crack
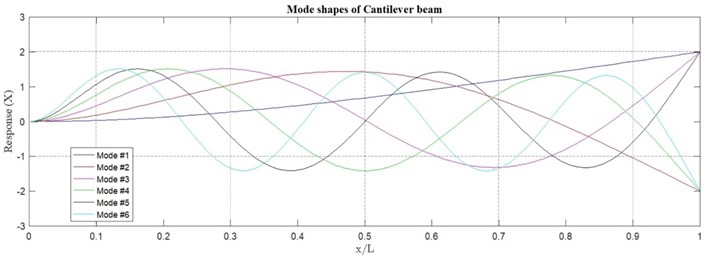
A MatLab script is developed to generate mode shapes of a fixed-fixed beam and cantilever beam as a reference as shown in Fig. 2 and Fig. 3 respectively.
2.2. Formulation
The beam is discretized into number of finite beam-elements. One-dimensional un-cracked beam-element with two nodes and two degrees-of-freedom per node is shown in Fig. 4. The degrees of freedom are: vertical deflection and rotation, with the slope of the elastic curve, at each node.
Equation of motion of a beam for free vibration in matrix form is given by:
In the Fig. 4, , are the shear forces and , are the bending moments at Node 1 and Node 2.
The stiffness matrix of the beam element is given by:
The mass matrix of the beam element is given by:
where is the length of beam element, is cross-sectional area of beam and is moment of inertia of rectangular beam.
Fig. 4Beam-element
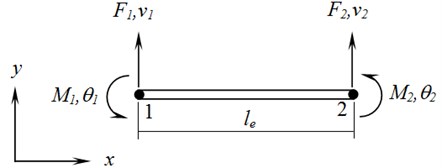
Fig. 2Mode shapes of fixed-fixed beam
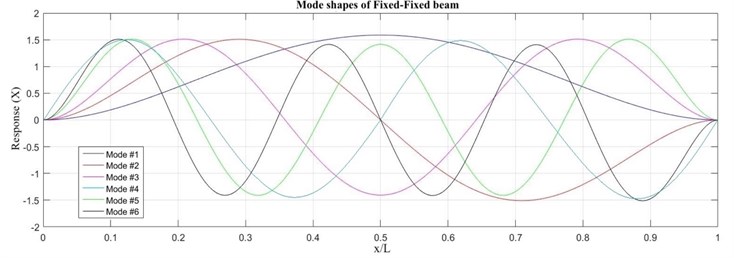
Fig. 3Mode shapes of cantilever beam
Using the above formulation, a MatLab script is developed to extract natural frequencies up to six modes for both boundary conditions of a cracked beam. The frequencies of fixed-fixed and cantilever beam are tabulated in Table 2 and Table 3 respectively.
3. Simulation method
In this section, the simulation process carried out is demonstrated. Aluminium cracked beam for both boundary conditions is simulated using Ansys (Version 18.2) to evaluate the natural frequencies for respective modes.
Various meshing types are considered, and simulation is carried out. It is observed that Hex-Dominant mesh takes the least computational time, without compromising the accuracy of the frequencies. The obtained natural frequencies from simulation of fixed-fixed and cantilever beam are tabulated in Table 2 and Table 3 respectively.
4. Results and discussion
For the considered cases, Finite Element Analysis and simulation is carried out and the natural frequencies up to six modes are evaluated. In this section, the obtained frequencies from both methods are tabulated and compared. A significant trend is observed and demonstrated for various cases with respect to mode shapes and the position of crack.
Natural frequencies of fixed-fixed beam of length 1 m, with varying crack position are tabulated in Table 2 and natural frequencies of cantilever beam of length 0.8 m are tabulated in Table 3.
Table 2Natural frequencies of fixed-fixed beam
Mode | Natural frequencies (Hz) | |||||||
0.0; 1 m | 0.5; 1 m | 0.33; 1 m | 0.25; 1 m | |||||
MatLab | Ansys | MatLab | Ansys | MatLab | Ansys | MatLab | Ansys | |
1 | 31.59 | 31.67 | 31.49 | 31.25 | 31.52 | 31.50 | 31.59 | 31.56 |
2 | 87.03 | 87.27 | 87.01 | 87.32 | 86.81 | 85.89 | 86.85 | 86.15 |
3 | 170.60 | 171.02 | 170.13 | 168.01 | 170.57 | 170.83 | 170.23 | 168.62 |
4 | 282.00 | 282.58 | 282.00 | 282.79 | 281.60 | 279.89 | 281.89 | 281.90 |
5 | 421.26 | 421.93 | 420.09 | 414.87 | 420.17 | 414.90 | 421.07 | 420.75 |
6 | 588.37 | 589.00 | 588.37 | 589.46 | 588.26 | 588.27 | 586.96 | 579.83 |
4.1. Trend in mode shapes
Results reflected in Table 2 are compared to observe a certain trend in mode shapes. As shown in Fig. 2, for 2nd, 4th and 6th mode shapes of fixed-fixed beam, there exists a node at mid-point of the beam i.e., 0.5, where is any point on the beam. When a crack is present at the mid-point i.e., 0.5, there is no response/deflection at the crack region for these particular modes. Accordingly, the natural frequency of the respective mode of a cracked beam remains unchanged when compared to that of an uncracked beam. Whereas in the case of 1st, 3rd and 5th modes, there is a reduction in natural frequencies of the cracked beam. This is due to the reduction in total stiffness of the cracked beam. Further, this trend is similarly observed in 3rd and 6th modes when a crack is present at one-third of the total length of fixed-fixed beam i.e., 0.33; and in 4th mode when a crack is present at one-fourth of the total length of fixed-fixed beam i.e., 0.25.
4.2. Comparison of results between MatLab and Ansys
However, by comparing the natural frequencies obtained from MatLab and Ansys, a significant trend is observed. In the case of an uncracked beam, it is observed that the natural frequencies obtained from Ansys is greater than the natural frequencies obtained from MatLab. But in the case of a cracked beam, MatLab produces a greater value than Ansys, except for the modes where the crack coincides with its node point. For example, in the case of a beam with crack at mid-point ( 0.5), it is seen that the natural frequencies of 1st, 3rd and 5th modes obtained from MatLab is greater than natural frequencies obtained from Ansys. But in the case of 2nd, 4th and 6th modes, Ansys produces greater values than Matlab due to its uncracked beam behaviour. A similar trend is seen in the case of a beam with crack at one-third of its length ( 0.33), at 3rd mode and 6th modes. The same trend is also seen to be following in the case of a beam with crack at one-fourth of its length ( 0.25), at 4th mode.
To validate the above trend, cantilever beam is considered and the natural frequencies up to six modes are tabulated in Table 3.
Table 3Natural frequencies of Cantilever beam
Mode | Natural frequencies (Hz) | |||
0.0; 0.8 m | 0.5; 0.8 m | |||
MatLab | Ansys | MatLab | Ansys | |
1 | 7.44 | 7.77 | 7.73 | 7.72 |
2 | 48.58 | 48.69 | 48.36 | 47.52 |
3 | 136.01 | 136.29 | 136.02 | 136.29 |
4 | 266.55 | 266.97 | 265.62 | 260.94 |
5 | 440.63 | 441.11 | 440.62 | 441.10 |
6 | 658.22 | 658.58 | 655.95 | 644.22 |
The mode shapes and respective node points of a cantilever beam is shown in Fig. 3. It is observed that 3rd and 5th modes consist a node at mid-point of the beam. Hence, for a cantilever beam with crack at its mid-point ( 0.5), the natural frequencies of 3rd and 5th mode remain unchanged from an uncracked cantilever beam.
Similarly, by comparing the natural frequencies of an uncracked cantilever beam obtained from MatLab and Ansys, it is observed that Ansys produces a greater value than MatLab. This trend is seen to be reversed in the case of a mid-cracked beam, except when the crack coincides with the node point of 3rd and 5th modes.
5. Conclusions
In the above sections, a mathematical model is derived for a simple beam structure and Finite Element Analysis is carried out using MatLab to obtain natural frequencies and mode shapes. Simulation process in Ansys is carried out and corresponding natural frequencies are extracted. It is found that the natural frequencies follow a certain trend with respect to mode shapes, node points and the crack position. It is concluded that whenever a crack coincides with the node point, the respective mode behaves similar to an uncracked beam. In performing dynamic analysis of cracked beam structures, the deviation between two analysis methods not only depends on the computational algorithms but also on the modal parameters with respect to orientation of cracks. Knowing these trends broadens scope for enhanced methods of analytical modelling and simulation process of cracked beam dynamics.
References
-
Qian G. L., Gu S. N., Jiang J. S. The dynamic behaviour and crack detection of a beam with a crack. Journal of Sound and Vibration, Vol. 138, Issue 2, 1990, p. 233-243.
-
Deokar A. A. V., Wakchaure B. V. D. Experimental Investigation of Crack Detection in Cantilever Beam Using Natural Frequency as Basic Criterion. Institute of Technology, Nirma University, Ahmedabad, 2011.
-
Ms Bagal S. B., Dr Pise C. P., Pawar Y. P., Kadam S. S. Vibration analysis of fixed-fixed beam with varying crack depth. International Journal of Engineering Trends and Technology, Vol. 47, Issue 7, 2017, p. 394-398.
-
Mazaheri Hamid, Rahami Hossein, Kheyroddin Ali. Static and dynamic analysis of cracked concrete beams using experimental study and finite element analysis. Periodica Polytechnica Civil Engineering, Vol. 62, Issue 2, 2018, p. 337-345.
-
Liu Long, Mei Xiao, Dong Dashan, Liu Haiyang. Perturbation methods for dynamic analysis of cracked beams. International Conference on Consumer Electronics, Communications and Networks, 2011.
About this article

