Abstract
In this paper, we analyze the case of structural integrity assessment when the beams have several cracks. The relationship between the location and the severity of one crack and the resulting frequency shift is known. That is why we can design databases containing many defects for which we can calculate precisely the frequency changes and the subsequent damage location coefficients. When the natural frequency evolution of several vibration modes is monitored, we can find alteration due to the crack. Comparing the results of the measurements with the values contained in the database, for instance by involving a bin-by-bin dissimilarity estimator, we can find the location and severity of the crack. For multiple cracks, this approach was not investigated. In this study, we design a database for two cracks affecting at the same time the beam. For these cracks, which have various severities and locations, we calculated the frequency changes by applying the superposition principle. Afterward, we find the frequency shifts for a test structure by means of the finite element method. The comparison between the damage location coefficients in the database and the signature of the damages achieved by simulation is made by the software we have developed in Visual Basic for Application in Excel. We succeed to find the severity and the location of the two cracks for all considered crack configurations.
1. Introduction
For decades, the evaluation of structural integrity based on vibration analysis is a major concern of the researchers. In this regard, numerous techniques that permit assessing the size and position of a crack in the beam exist. They consider either the change in the natural frequencies, mode shapes, modal curvatures or modal damping [1-4]. The most commonly used modal parameter is the natural frequency, which is easy to measure and does not require complex or sensitive equipment. The mathematical relationship between the damage parameters, i.e. the location and severity, and the frequency decrease is presented in the papers [5-7]. Several correction coefficients to be applied for changing environmental conditions as the temperature or moisture were also presented in the literature; see for instance references [8, 9]. Usually, the frequency change caused by cracks compares to those achieved by using theoretical models. If more vibration modes are involved, the comparison is made by using dissimilarity estimators that perform a bin-by-bin evaluation [10-12]. It is possible to separate the problem of finding the crack location and severity by applying two consecutive normalizations [13]. Initially, the location is determined involving the Damage Location Coefficients (DLC). Afterward, the severity is found for the crack for which the location is identified [14].
When the beam is harmed by more than one crack, directly using the DLC is not possible because the cracks can have different positions and severities. Studies dedicated to the detection of multiple cracks are present in the literature [15, 16]. The key finding is that the superposition principle applies for most damage locations, but not for close located cracks [17].
We propose in this paper an algorithm to find the location of multiple cracks and show how it can be implemented in Visual Basic for Application in Excel to automate the damage assessment process. The functionality of the algorithm is tested for the frequencies obtained by means of the finite element method (FEM) for the healthy beam and a series of simulated damages.
2. Theoretical background
Let us consider a beam with the left end fixed end the right end free, i.e. a cantilever beam. This beam has, for all transverse vibration modes 1, ..., , known natural frequencies . We can also calculate the modal curvatures at any distance . It was shown in [6] that the frequency of a beam with a transversal breathing crack can be calculated as:
where is the damage depth and the curvature is normalized by division with the value found at the location where it achieves the maxima. For the cantilever, this location is the fixed end. The term in Eq. (1) is the damage severity, calculated from the energy loss with the mathematical relation:
The frequency shift caused by the described crack can be deduced from Eq. (1), as:
and subsequently the Relative Frequency Shift (RFS) as:
when calculating values for the RFS of a damaged beam, we obtain the sequence:
We can observe that by dividing all terms in the row matrix with the biggest one of the sequence, the severity is eliminated and all terms achieve values lower than one:
We nominate the sequence in Eq. (6) as Damage Location Indicator (DLI) and the individual terms as Damage Location Coefficients (DLC). The DLI depend just on the crack position , therefore the problems of finding the crack location and its severity are separated. Knowing the mode shapes, it is easy to calculate the DLI for any location on the beam and develop a database with possible scenarios. If we measure periodically the natural frequencies of a beam and find alteration, we can calculate in a similar way the terms in Eq. (6). These values, achieved from experiments, are also free of information regarding the damage severity. We nominate these values, which clearly indicate the damage position, as Damage Signature (DS). By simply comparing the DS with the DLIs for a lot of locations , we find the two that fit and the corresponding distance which indicates the crack position.
3. The proposed algorithm
Separating the problems of finding the crack location and its severity is not possible if more cracks are present in the beam, because these can achieve different severities. We have shown in [18] that Eq. (1) can be applied twice when two cracks at locations and that have depths and affect the beam. This is based on the equivalent healthy beam theory we developed for single cracks. In fact, it is as we apply Eq. (1) to a healthy beam with the frequency . Therefore, we can write:
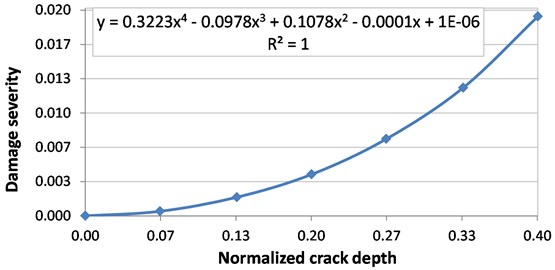
The algorithm we describe in this section has implemented Eq. (7). Based on this algorithm, we develop a database containing the frequencies for the first nine transverse vibration modes for the healthy beam and the beam with one and two cracks. These cracks, simulated in the beam with thickness , achieve depths , thus 1, ..., . We show in Fig. 1 the severity evolution with the normalized crack depth derived by means of FEM simulations that cover the range / 0/0.4. In this figure is also given the regression curve, which permits calculating the severity for any crack depth. This relationship is valid for all rectangular cross-sections, depending exclusively on the ratio /. To create the database, for all damage depths, the resulted cracks are removed along the beam with a step 0.005/, resulting in 200 crack locations. The index of an individual crack is denoted , which takes values 1, ..., .
Fig. 1Damage severity evolution with the crack depth growth
The database is developed using Visual Basic for Application in Excel. First, damage scenarios by considering just one crack with different severities and locations are created and one row is assigned in the database for each case. In addition, we insert rows for all possible combinations resulted when two cracks affect the beam. The frequencies for all cases are calculated with Eq. (7).
The first section of a row in the database, carrying the basic information about the damages and the predicted frequencies is presented in Table 1. The first column indicates the index of the damage case, 1, ..., , the next four columns describe the simulated cracks and the following nine columns indicate the resulted normalized frequencies for the nine vibration modes.
Supplementary, from the natural frequencies we calculate the RFS for all damage cases and vibration modes, by using the mathematical relation:
One observes that Eq. (4) is not anymore used, because we have more depths and curvatures. We can introduce in the application measured data in terms of frequencies and calculate the damage signatures with a mathematical relation similar to Eq. (8). A view on the second section of a row in the database is shown in Table 2. Note that, in the database each row contains other RFS but the same DS.
Table 1Example of a row contained in the database carrying basic information about the beam
Index of the damage cases | Normalized natural frequencies | ||||||
Index | Severity crack 1 | Position crack 1 | Severity crack 2 | Position crack 2 | |||
() | / | () | / | [Hz] | … | [Hz] | |
Table 2Example of a row contained in the database carrying information about the RFS
Relative frequency shifts | Damage signature | Dissimilarity estimation | ||||
[–] | … | [–] | [–] | … | [–] | DE |
Step by step comparison between all RFS and the DS is made involving the Euclidean distance that is, for the damage case , calculated as:
In the above equation, all combinations of crack depths and locations are considered for both cracks. The aim is finding the index for which the sequence attains the minima.
4. Numerical experiments
The reliability of the algorithm is tested for frequency responses obtained by means of FEM. The test specimen is a cantilever steel beam with the following geometry: length 1000 mm, width 50 and a thickness 5 mm. We carry out simulation using the ANSYS software. The mechanical properties are assigned for the cantilever beam from the ANSYS Workbench library and correspond to the structural steel. We present these values in Table 3.
Table 3Physical and mechanical properties of the structural steel
Mass density [kg/mm3] | Young modulus [N/m2] | Poisson ratio [–] | Yield strength [MPa] | Ultimate strength [MPa] |
7850 | 2·1011 | 0.3 | 250 | 460 |
To ensure results with a high degree of generality, we consider three damage cases:
– Case 1, with 160 mm and 1 mm, respectively 100 mm and 1 mm;
– Case 2, with 160 mm and 1 mm, respectively 100 mm and 1.67 mm;
– Case 3, with 160 mm and 1 mm, respectively 700 mm and 1 mm.
All cracks go through the whole beam width and have a 0.005 mm distance between the opposite faces, thus are open cracks. The discretization is made using hexahedral elements with maximum edge dimension 2 mm. The results achieved by simulation are presented in Table 4. For the mentioned crack locations, we performed modal analysis to find the first nine natural frequencies for the transverse vibrations.
Table 4Frequencies in Hz achieved by FEM simulation
Beam | Mode 1 | Mode 2 | Mode 3 | Mode 4 | Mode 5 | Mode 6 | Mode 7 | Mode 8 | Mode 9 |
Healthy | 4.0898 | 25.626 | 71.754 | 140.62 | 232.52 | 347.45 | 485.45 | 646.56 | 830.78 |
Case 1 | 4.0682 | 25.592 | 71.731 | 140.49 | 232.06 | 346.24 | 484.42 | 646.54 | 829.37 |
Case 2 | 4.0427 | 25.535 | 71.692 | 140.44 | 231.84 | 345.95 | 482.98 | 642.95 | 825.88 |
Case 3 | 4.0799 | 25.592 | 71.588 | 140.39 | 232.10 | 346.29 | 484.46 | 646.54 | 829.45 |
Next, we calculate the DS for the four damage cases and perform dissimilarity analyses by involving Eq. (9). For the calculus we used ten severities, associated with nine equidistantly distributed crack depths. We found the minima for the three damage cases, which indicate the crack parameters.
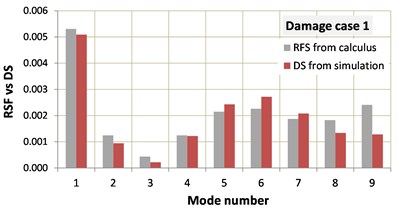
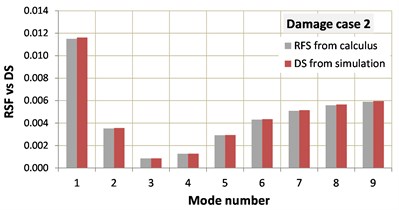
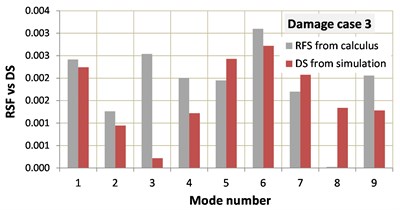
We also tested if the DS fit the identified RFS or the minimum found by the dissimilarity test does not correspond to the real damage scenario. This is made by comparing the graphical representation of the RFS with the DS. Based on the diagrams in Fig. 3, we conclude that all damage parameters are correctly identified, except the location of one crack which is found with a 1 % error.
Fig. 3Comparison of the identified RFS with the DS of the three damage scenarios
a)
b)
c)
5. Conclusions
The paper proposes and algorithm to assess multiple cracks in beams based on the analysis of the frequency shifts. Three damage scenarios involving cracks with different location and depth are selected to test its reliability. By applying the tests, we succeed to correctly assess all cracks, the achieved positions being indicated with an error less than 1 %, which means 10 mm.
By performing numerous tests, we also found that it is sufficient to take one hundred crack locations for constructing the database. This resolution ensures a sufficiently high precision in the location of cracks. On the other hand, increasing number of damage severities taken to create the database increase the precision of the cracks depth. Future research will be focused on optimizing the minima searching algorithm to reduce the time used for calculus.
References
-
Rizos P. F., Aspragathos N., Dimarogonas A. D. Identification of crack location and magnitude in a cantilever beam from the vibration modes. Journal of Sound and Vibration, Vol. 138, Issue 3, 1990, p. 381-388.
-
Song Y. Z., Bowen C. R., Kim A. H., Nassehi A., Padget J., Gathercole N. Virtual visual sensors and their application in structural health monitoring. Structural Health Monitoring, Vol. 13, Issue 3, 2014, p. 251-264.
-
Gillich G. R., Gillich N., Birdeanu E. D., Iancu V. Detection of damages in simple elements. Annals of DAAAM and Proceedings of the International DAAAM Symposium, Vol. 20, 2009, p. 623-624.
-
Sinha J. K., Friswell M. I., Edwards S. Simplified models for the location of cracks in beam structures using measured vibration data. Journal of Sound and Vibration, Vol. 251, Issue 1, 2002, p. 13-38.
-
Chondros T. J., Dimarogonas A. D., Yao J. A continuous cracked beam vibration theory. Journal of Sound and Vibration, Vol. 215, Issue 1, 1998, p. 17-34.
-
Gillich G. R., Tufoi M., Korka Z. I., Stanciu E., Petrica A. The relations between deflection, stored energy and natural frequencies, with application in damage detection. Romanian Journal of Acoustics and Vibration, Vol. 13, Issue 2, 2016, p. 87-93.
-
Ostachowicz W. M., Krawczuk C. Analysis of the effect of cracks on the natural frequencies of a cantilever beam. Journal of Sound and Vibration, Vol. 150, Issue 2, 1991, p. 191-201.
-
Gillich G. R., Furdui H., Wahab M. A., Korka Z. I. A robust damage detection method based on multi-modal analysis in variable temperature conditions. Mechanical Systems and Signal Processing, Vol. 115, 2019, p. 361-379.
-
Hios J. D., Fassois S. D. A global statistical model based approach for vibration response-only damage detection under various temperatures: a proof-of-concept study. Mechanical Systems and Signal Processing, Vol. 49, Issues 1-2, 2014, p. 77-94.
-
Minda P. F., Praisach Z. I., Minda A. A., Gillich G. R. Methods of interpreting the results of vibration measurements to locate damages in beams. Applied Mechanics and Materials, Vol. 430, 2013, p. 84-89.
-
Minda P. F., Praisach Z. I., Gillich N., Minda A. A., Gillich G. R. On the efficiency of different dissimilarity estimators used in damage detection. Romanian Journal of Acoustics and Vibration, Vol. 10, Issue 1, 2013, p. 15-18.
-
Chioncel C. P., Gillich G. R., Mituletu I. C., Gillich N., Pelea I. Visual method to recognize breathing cracks from frequency change. Romanian Journal of Acoustics and Vibration, Vol. 12, Issue 2, 2015, p. 151-154.
-
Gillich G. R., Maia N., Mituletu I. C., Praisach Z. I., Tufoi M., Negru I. Early structural damage assessment by using an improved frequency evaluation algorithm. Latin American Journal of Solids and Structures, Vol. 12, Issue 12, 2015, p. 2311-2329.
-
Praisach Z. I., Gillich G. R., Protocsil C., Muntean F. Evaluation of crack depth in beams for known damage location based on vibration modes analysis. Applied Mechanics and Materials, Vol. 430, 2013, p. 90-94.
-
Altunışık A. C., Okur F. Y., Kahya V. Modal parameter identification and vibration based damage detection of a multiple cracked cantilever beam. Engineering Failure Analysis, Vol. 79, 2017, p. 154-170.
-
Zhang K., Yan X. Multi-cracks identification method for cantilever beam structure with variable cross-sections based on measured natural frequency changes. Journal of Sound and Vibration, Vol. 387, 2017, p. 53-65.
-
Praisach Z. I., Negru I., Gillich G. R. Application of superposition principle to detect damages in beams by using natural frequencies. Romanian Journal of Acoustics and Vibration, Vol. 9, Issue 1, 2012, p. 23-28.
Cited by
About this article

