Abstract
Traditionally, gear faults can be classified with the ignorance of the sample uncertainty. In this paper, a novel approach is proposed for the problem diagnosis of uncertain gear interval faults. First, a statistical property interval feature vector composed of mean, standard deviation, skewness, kurtosis, etc. is proposed. Then, the native Bayes uncertain classification (NBU) is used for the diagnostics of these uncertain gear interval faults. Conventionally, the NBU utilizes all the attributes to distinguish fault types. However, each fault type has its own distinct classification accuracy for different feature vector attributes. Thus, the particle swarm optimization (PSO) is used to select the optimal feature vector attributes for each fault type in the NBU (NBU_PSO_EACH). The experimental results show: (1) the accuracy of the proposed method is better than that of NBU1, NBU2 or FBC; (2) in terms of accuracy, the proposed method is also more advanced than the method which selects the same optimal attributes for all fault types based on the PSO (NBU_PSO); (3) the proposed method can reduce the physical size of feature vectors.
1. Introduction
As an important part of the mechanical system, gear box causes a disorder for fatigue wear and other failures. It will seriously affect the safety and reliability of mechanical system. Therefore, the fault diagnosis of gear box is of extremely important practical significance in engineering. These years, many scholars have done depth researches and obtained many achievements in the field of gear fault diagnosis [1-8]. However, the uncertainty of fault samples should never be overlooked. When a mechanical system is running, the contact clearance and adhesion of various components will dramatically change. For this reason, the gear structure stability demonstrates a significant uncertainty. Therefore, it is very hard to describe the gear parameters accurately in case of a failure of the gear system. However, the traditional fault diagnosis methods are useless in the fault diagnosis of this case, because these methods are mainly aimed at deterministic fault samples. During these years, researching of uncertain data classification is very popular, among them the attribute level uncertain data classification method, which is the focus of recent study, shall be noted. A classification method for uncertain data (TSVC) is studied based on the SVM [9]. The method is built with a random data model of uncertain data. A super sphere model is applied to replace the random data model, which was used to design the uncertain data classification model. Due to the oversimplification of the uncertain data model, this model can hardly describe the uncertainty characteristics effectively. Based on the TSVC method, the USVC method, which is also built with a random data model, is further proposed [10]. The data uncertainty is described by the Gauss distribution model. In this classification model, the fuzzy chance constrained problem is transformed into the two-order-cone problem. The classification model is more accurate in the description of the uncertain data, but the two-order-cone problem is very complicated. The formula-based Bayes classifier (FBC), proposed by Ren etc. [11] assumes uncertain interval data to meet the Gauss distribution. The non-parametric estimation of the Parzen window method is utilized to calculate the type of the class conditional probability density function of interval samples. However, the FBC algorithm is a kind of lazy learning method. Both the computational complexity and memory requirements of this method are too large to be offered in time. According to the literature survey, the problem of decision-tree classification based on the attribute level uncertain data has been profoundly studied [12]. This method uses the mean value of the uncertain data as a training sample so that the uncertain data can become more definite with the help of the deterministic data classification method.
Native Bias is a widely used classification method for deterministic samples. Qin et al. created the NBU [13]. Based on the Gauss distribution assumption, this method applies the parameter estimation to calculate the class conditional probability density function of uncertain data. Through the NBU, the interval data can be classified as having more performance stability as compared with the existing extended Native Bayesian method. Gear interval faults diagnosis problem consists in a typical Multi-fault classification. Qin et al. used all interval feature vectors attributes in the NBU. However, on one hand, each fault has its own distinct classification accuracy for different feature vector attributes. On the other hand, to obtain higher classification accuracy whilst reducing the physical size of feature vectors, a method of attributes selection must be used, because it is capable of selecting the most significant attributes. Xu et al. [14] used the LDA to delete some redundant attributes and to reduce the dimensions of the sample features. Jack et al. [15] applied the genetic algorithm (GA) to obtain the most significant features. The PSO algorithm is different from the GA, etc., because it does not use genetic operators but the cooperation and competition among particles allows reaching the optimal classification accuracy. The PSO advantages are its fast convergence speed, simple operation and easy implementation etc. [16]. Therefore, in this paper, the NBU_PSO_EACH is proposed to select the optimal feature vector attributes for each fault type in the NBU. In this method, the particle dimension is equal to the number of fault types in order to present different feature vector attributes for different fault types. Attribute selection is defined as the particle value. The NBU fault classification accuracy is selected as the fitness function. Through moving the process forward and obtaining the optimal classification accuracy, particles will find the most significant attributes for each fault type as the solution. Therefore, the accuracy of the proposed method is better than that of NBU, etc., because some redundant and disturbance attributes are deleted, while the most significant attributes are obtained in the NBU_PSO_EACH. These disturbance attributes will seriously reduce the interval fault classification accuracy.
This paper is organized as follows: the NBU is described in Section 2. Section 3 proposes the optimal feature vector attributes selected by NBU_PSO_EACH. Section 4 analyzes the classification results of UCI data and gear faults, as well as the comparison results with other methods. Finally, the conclusions are presented in Section 5.
2. NBU theory
Since the NBU method is constructed on the basis of the Native Bayes, this paper introduces the Native Bayes firstly.
2.1. Native Bayes basis
The naive Bayes (NB) basis is used to calculate the class-conditional probability. is set as the class label, 1, 2,…, . The conditional independence assumption is illustrated by the following equation:
where every attribute set consists of attributes. With Eq. (1), the NB classifier can calculate the posterior probability for all the classes :
Then, the pattern of can be obtained by the equation as follows Eq. (3):
If an attribute is numerical, it is likely to be a Gaussian distribution, which is presented as the following equation:
As compared with Eq. (4) for numerical attributes, the continuous attributes can be obtained by Eq. (5):
where is a small constant.
2.2. NBU theorem
As mentioned above, when the attribute is an uncertain number, a Gaussian distribution also exists. For this reason, the research focuses in the NBU in order to calculate and for uncertain numerical data.
After Setting as an interval variable, the parameters of Gaussian distribution can be reached by Theorem 1.
Theorem 1: The interval variable is , 1,…, . and are set as the minimal and maximal values of the sample interval. presents the following distribution:
The empirical mean is calculated by Eq. (7):
One can use two well-known equations and 0 to obtain the integral value. Through the substitution , can be reached then:
In the same way, the sample variance obtained by the Eq. (9):
3. Feature vector attributes selected by NBU_PSO_EACH
3.1. PSO algorithm
The PSO algorithm, proposed by Eberhart and Kennedy in 1995, is a kind of global optimization evolutionary algorithm. As a parallel optimization algorithm, which is derived from the simulation of foraging behavior of birds and fish populations, the PSO can be applied to solve the optimization of a large number of nonlinear, non-differentiable and multi-peak complex problems. Nowadays, the PSO has been extensively utilized in the fields of science and engineering, such as the function optimization, neural network training, pattern classification and fuzzy system control.
Similar to the genetic algorithm, the PSO is based on two concepts of population and fitness. Each particle has two descriptions of position and velocity, and the objective function value corresponding to the particle position coordinate can be used as the particle fitness. The fitness is used to measure the particle. The PSO algorithm, different from the genetic algorithm, is not evolved by genetic operators but it is used in the cooperation and competition among individuals. In the early stage of evolution, the PSO has many advantages, especially of its fast convergence speed, simple operation and easy implementation, without genetic algorithm coding and decoding, selection, crossover, mutation and so on. Because of the above mentioned advantages, the PSO has always attracted many researchers in the field of evolutionary computation.
According to the research, the algorithm of PSO can be summarized as follows:
Step 1: particles are initialized with random positions , 1,…, and velocities . 1,…, , where is the punishing parameter;
Step 2: Fitness value of each particle is evaluated by the fitness function;
Step 3: If the maximum iteration time is met, the optimal particle is outputted. Otherwise, go back to Step (4).
Step 4: new particles of PSO are generated from the current particles using the equation:
where is the current step number, is the th particle dimension, is the inertia weight, and are the acceleration constants, is a random number within the range [0,1], is the current position of the th particle at iteration , is the current velocity of the th particle at iteration , is the best one of the solution that the particle has reached, is the best one of the solution that all the particles have reached.
Step 5: 1 and go to step 2.
3.2. NBU_PSO_EACH algorithm
The feature vectors with a high recognition rate may vary for each fault class. In the other words, each type of fault has its own distinctive classification accuracy for different feature vector attributes. Thus, this paper proposes the NBU_PSO_EACH algorithm. In this method, the particle swarm optimization (PSO) is put forward to select different optimal feature vector attributes for different fault types in NBU. This paper also draws a flow chart of the diagnostic program based on NBU_PSO_EACH in Fig. 1. In this method, attribute selection is defined as the value of particle. For this reason, the value of particle is defined as a binary number where 1 represents the attribute selection, 0 represents the attribute deselection. The NBU fault classification accuracy is selected as the fitness function. Through moving process forward and obtaining the optimal classification accuracy, particles will find the most significant attributes for each fault type as the solution. The optimal accuracy for all kinds of fault classes is the mean value of all the fault types.
Fig. 1Flow chart of diagnostic program based NBU_PSO_EACH
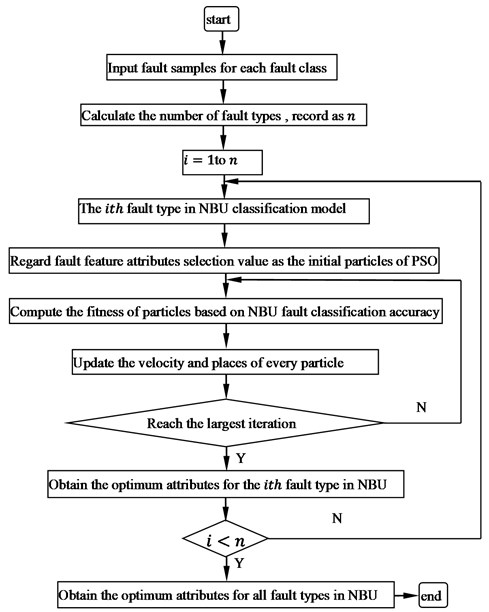
Fig. 2Flow chart of diagnostic program based on NBU_PSO
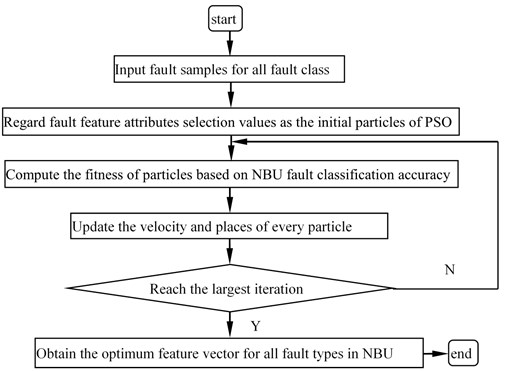
In order to demonstrate the performance of the proposed method, this paper has also implemented an optimal diagnostic procedure program based on NBU_PSO which selects the same feature vector attributes for all fault types by PSO, as shown in Fig. 2. The NBU_PSO cannot present different feature vector attributes for different fault type although each fault has its own distinct classification accuracy for different attributes.
4. Experiment
4.1. UCI data classification
In this experiment, UCI data [17] sets are used to compare the effectiveness of NBU, NBU-PSO and NBU_PSO_EACH. Since there is not a set of standard uncertain data in the UCI, this experiment introduces uncertainty information on the UCI data sets. The detail method [18] for adding uncertain information is as follows:
For any UCI samples , 1,…, , one can add the interval uncertain information to each feature vector. The interval feature vector is listed as follows:
where is the interval radius. It can be obtained as follows:
The difference between and indicates the range of the sample set on the dimension . is a parameter that controls the size of the interval noise. For example: if 1, the distribution range of each attribute is added to 10 % noise. The Iris interval samples are shown in Table 1.
The proposed NBU_PSO_EACH has been implemented in MATLAB 2012. The experiment is made on a 3.2G GHz Core (TM)2 i3 CPU PC with 2.0G memory. The operation system is Microsoft Windows 7. The detail content of NBU_PSO_EACH for Iris data is as follows:
Step 1: Initialization:
1) Number of particles: 30;
2) The maximal iterative number: 50;
3) Inertia weight of PSO: 0.7298;
4) Positive acceleration constants: 1.4962, 1.4962.
Step 2: Take the attributes selection value as particles and initialize particles with position and velocity ; Particle dimension is equal to the number of sample types;
Step 4: the NBU classification accuracy is selected as the fitness function;
Step 5: If a stopping criterion is satisfied, the optimal particle is selected having the NBU attribute parameters. Otherwise, go back to Step (6);
Step 6: Based on the current particles and the Eq. (10), new particles are generated. Then, go to step 3.
Table 1Interval samples of iris
Iris | Sepal.Length | Sepal.Width | Petal.Length | Petal.Width |
Iris Setosa | [5.05, 5.15] [4.85, 4.95] | [3.45, 3.55] [2.95, 3.05] | [1.38, 1.42] [1.38, 1.42] | [0.185, 0.215] [0.185, 0.215] |
Iris Versicolour | [6.395, 6.605] [5.595, 5.805] | [2.75, 2.85] [2.75, 2.85] | [4.52, 4.68] [4.42, 4.58] | [1.47, 1.53] [1.27, 1.33] |
Iris Virginica | [6.565, 6.835] [7.065, 7.335] | [2.445, 2.555] [3.545, 3.655] | [5.695, 5.905] [5.995, 6.205] | [1.76, 1.84] [2.46, 2.54] |
In the Iris data set, there are three sample types. Each type of sample vectors has four attributes. For this reason, the value of particle is defined as [(0000)2, (1111)2] where 1 represents the attribute selection, 0 represents the attribute deselection, that is, if then and similarly for . So, the particle cannot move out of this range in each dimension. In order to ensure the stability, this paper uses 90 % of cross validation (10-fold Cross validation) estimation. The data sets are randomly divided into 10 groups. One group contains taken turns to be chosen as the test set and the other 9 groups contain the training sets. Through averaging 10 times as the result of the final estimation accuracy, this paper demonstrates the classification results to analyze the performance of NBU, NBU-PSO and NBU_PSO_EACH in table 2.
According to Table 2, the NBU uses all attributes of the feature vectors. The accuracy of NBU is 100 %, 95 %, 92.5 % for Iris Setosa, Iris Versicolour and Iris Virginica. In NBU_PSO, only the third attribute (Petal.Length) and the fourth attribute (Petal.Width) are selected for all the Iris types by PSO. The classification accuracy of NBU_PSO is the same as that of NBU but with the reduction of the physical size of feature vectors. In NBU_PSO_EACH, the PSO selects different attributes of feature vectors for different Iris types. The third attribute (Petal.Length) and fourth attribute (Petal.Width) are selected for Iris Setosa. The first attribute (Sepal.Length), third attribute (Petal.Length) and fourth attribute are selected for Iris Versicolour. The second attribute (Sepal.Width) and third attribute (Petal.Length) are selected for Iris Virginica. The classification accuracy of NBU_PSO_EACH is 5 % higher than that of NBU_PSO in the Iris Virginica type. For all three Iris types, the accuracy of NBU_PSO_EACH is 96.67 %. The accuracy of NBU_PSO and NBU is only 95.83 %.
To further illustrate the effectiveness of NBU_PSO_EACH, this paper uses other 5 UCI data sets. The classification results can be listed in Table 3. Every cell represents the average accuracy in this table.
Table 3 shows that the classifier built by NBU_PSO_EACH can be more accurate than that of the NB and NBU_PSO for all 5 data sets. For instance, the Wine data set has 3 types and 13 attributes for each feature vector. The NBU uses all attributes of the feature vectors for the Wine data set. The classification accuracy of NBU is 84.42 %. NBU_PSO uses the 2th, 5th to 9th attribute of feature vectors for all wine types; its classification accuracy reaches 88.96 %. NBU_PSO_EACH selects different attributes of feature vectors for different wine types. For the first wine types, NBU_PSO_EACH selects the 4th, 6th-8th, 12th attributes of feature vectors. For the second wine type, NBU_PSO_EACH selects the 2th, 4th, 7th, 8th, 10th to12th attributes of feature vectors. For the third wine type, NBU_PSO_EACH selects the 1th, 2th, 4th to 6th, 10th, 12th attributes of feature vectors. The classification accuracy of NBU_PSO_EACH is 90.91 %.
Table 2Classification results comparison of NBU, NBU-PSO and NBU_PSO_EACH for Iris
Iris types | NBU feature selection | NBU_PSO feature selection | NBU_PSO_EACH feature selection | NBU accuracy | NBU_PSO accuracy | NBU _PSO_EACH accuracy |
Setosa | 1111 | 1100 | 1100 | 100 % | 100 % | 100 % |
Versicolour | 1111 | 1100 | 1101 | 95 % | 95 % | 92.5 % |
Virginica | 1111 | 1100 | 0110 | 92.5 % | 92.5 % | 97.5 % |
Table 3Classification accuracy comparison of NBU, NBU-PSO and NBU_PSO_EACH
NBU | NBU_PSO | NBU_PSO_EACH | |
Wine | 84.42 % | 88.96 % | 90.91 % |
Breast | 96.05 % | 96.05 % | 96.49 % |
German | 70.33 % | 70.33 % | 70.35 % |
Heart | 79.13 % | 80 % | 81.3 % |
Inosphere | 52.24 % | 52.24 % | 71.04 % |
4.2. Fault diagnosis for gear
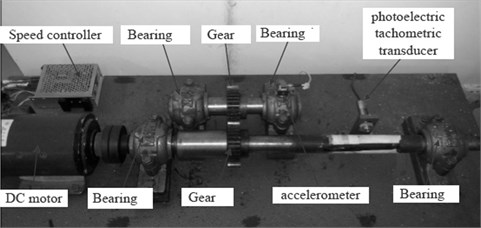
To demonstrate the effectiveness of NBU_PSO_EACH, experiments are carried out on a motor-drive-gear fault test platform in Fig. 3. The speed of DC motor can reach 1450 rpm. By using a coupling, a shaft is attached to the motor. With the help of the shaft, the motion is transmitted to the gear. The various defect gears are produced in this experiment platform. The accelerometer is connected as the signal detection unit. Fault vibration signals can be stored digitally in a computer through an amplifier and analogue-to-digital converter. The fault vibration signals are then obtained and extracted to different features. The vibration signals are acquired with a sampling rate of 5120 Hz.
Fig. 3Motor-drive-gear fault test platform
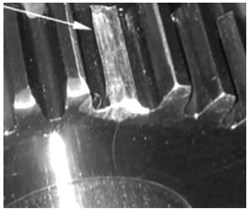
Various defect gears are within the scope of this research. Different gear faults i.e., wear fault, pitting fault, broken tooth fault, broken and wear fault are used to examine the proposed approach. The test gears are mounted on the main shaft. Some defect gears are shown in Fig. 4
Fig. 4a) broken tooth gear, b) wear gear
a)
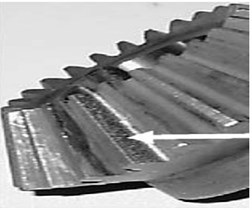
b)
Through the gear fault test platform, 50 groups of gear signals for each fault type are produced. Each fault vibration signal is composed of 2048 points. Two groups of fault vibration signals are shown in Fig 5.
Fig. 5Two groups of fault vibration signals
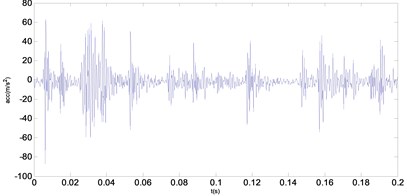
a) Wear fault signal
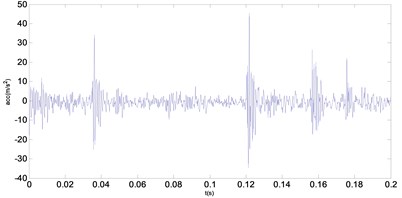
b) Broken tooth fault signal
4.2.1. Uncertain interval feature vectors acquisition
For each fault signal, 18 feature vectors are chosen as the fault samples in the time domain and frequency domain. The time domain features consist of 12 feature vectors, such as: mean, standard deviation, max, min, kurtosis, skewness, variance, root mean square etc. Sometime domain features are presented as follows:
The mean value of signal is determined as follows:
The standard deviation of signal is defined as below:
As a measure of the heaviness of tails in the distribution of signal , Kurtosis can be used to establish an effective statistical test in identifying the signal changes:
As a measure of the data asymmetry around the mean value, the skewness is determined as follows:
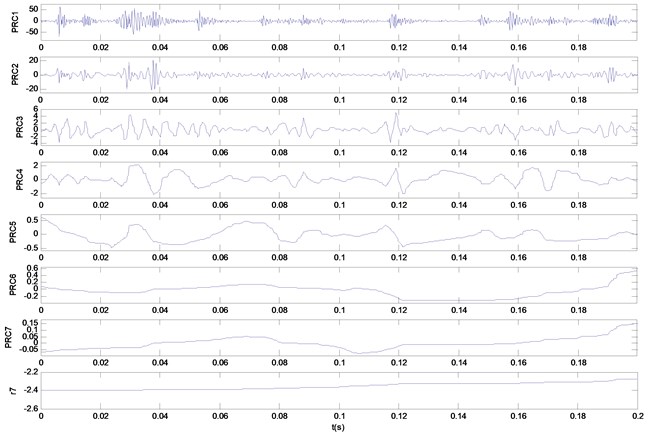
The feature of frequency domain contains 6 vectors in total. In this paper, 6 feature vectors can be obtained by the ITD method [19]. Each group of gear fault signals composed of 2048 points is decomposed by the ITD method to obtain a set of proper rotation components and a base component.
The first three groups of these proper rotation components are chosen in this experiment so that their instantaneous amplitude and frequency can be calculated. Then, the sample entropy of the instantaneous amplitudes and frequencies is further calculated as 6 feature vectors mentioned at the beginning. Fault data of specific features extraction steps are shown as:
1) Fault vibration data is obtained from the gear sensor.
2) Through ITD, the fault vibration data is decomposed of a set of rotation components and a baseline component. The decomposition results are given in Fig. 6.
3) The first 3 groups of rotation components of instantaneous amplitude and frequency are calculated.
4) The sample entropy of the instantaneous amplitude and frequency is calculated.
By this means, each kind of fault signals can obtain 50 samples. In order to get uncertain gear faults, this research introduces uncertain information on the gear fault samples. The detailed method of adding uncertain information is the same as the UCI mentioned above. A part of attributes of the uncertain gear interval fault samples are shown in table 4. The amplitude entropy 1 represents the first rotation component of instantaneous amplitude sample entropy. The other amplitude entropies are represented in a similar way as shown in Table 4.
4.2.2. Comparative analysis of classification accuracy
In order to compare the NBU, NBU-PSO and NBU_PSO_EACH methods for the classification accuracy of uncertain gear interval fault data, this paper utilizes 90 % of cross validation (10-fold Cross validation) estimation. The classification results are listed in Tables 5-6 to analyze the performance of NBU, NBU-PSO and NBU_PSO_EACH. From Tables 5-6, the NBU uses all 18 attributes of the feature vectors. However, the classification accuracy is only 35 % in detecting a composite fault, broken & wear fault. Obviously, this classification accuracy is far away from the satisfactory one. The average accuracy of 4 gear fault types only reaches 80 % in the NBU. The same attributes of feature vectors for all gear fault types are selected by the NBU_PSO. The average accuracy of NBU_PSO gets to 81.875 % which is better than that of NBU. Unfortunately, for a composite fault, the effect of NBU_PSO is also poor. NBU_PSO_EACH selects different attributes of feature vectors for different gear fault types. The average accuracy is 85.62 %. The classification effect of NBU_PSO_EACH is much better than that of NBU and NBU_PSO. Moreover, for a composite fault, the accuracy of NBU_PSO_EACH is 40 % higher than that of NBU.
Fig. 6Decomposition results gained by ITD for five kinds of bearing vibration signals: a) decomposition result of wear condition; b) decomposition result of broken tooth condition
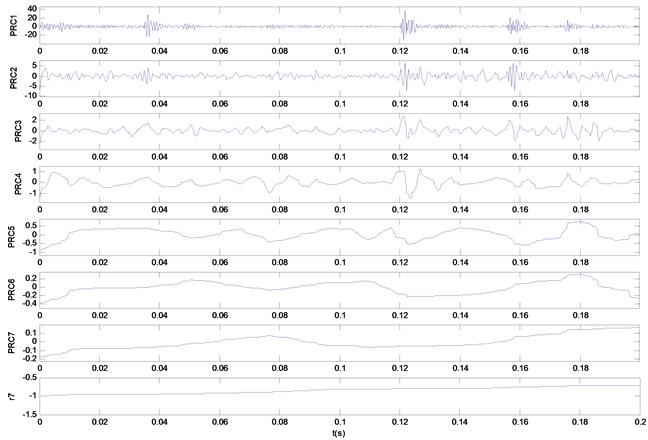
a)
b)
Table 4Part of attributes of the uncertain interval gear fault samples
Fault types | Mean | Kurtosis | Skenwness | Amplitude entropy 1 | Frequency entropy 1 |
Wear | [0.3635,0.3928] [0.1707, 0.2000] | [0.1482, 0.1555] [0.0914, 0.0987] | [1.1852,1.1940] [1.1053, 1.1141] | [158.73,182.83] [160.16, 184.26] | [1.5883,1.6335] [1.8097, 1.8549] |
Pitting | [0.6404,0.6736] [0.4093, 0.4425] | [0.1467,0.1505] [0.1238, 0.1276] | [1.1507, 1.1687] [1.0982, 1.1162] | [13.5928,16.93] [24.549,27.887] | [1.3052, 1.6231] [1.4385, 1.4743] |
Broken tooth | [0.2820,0.3189] [0.1887, 0.2256] | [0.1459 ,0.1522] [0.1276, 0.1340] | [1.1516 ,1.1610] [1.2061, 1.2155] | [27.142,32.348] [62.4147,67.62] | [1.6435,1.6855] [1.7299, 1.7719] |
Broken and wear | [0.3949, 0.4158] [0.3237, 0.3445] | [0.1595, 0.1650] [0.1474, 0.1529 | [1.1631, 1.1727] [1.1904, 1.2000] | [60.557, 68.339] [70.2447, 78.03] | [1.6047, 1.6231] [1.6203, 1.6387] |
Table 5Feature vectors selection results for each fault types of gear
Fault types | NBU | NBU_PSO | NBU_PSO_EACH |
Wear | 111111111111111111 | 11010100111111110 | 101011011101010000 |
Pitting | 111111111111111111 | 11010100111111110 | 100010100110110111 |
Broken tooth | 111111111111111111 | 11010100111111110 | 011100101100100010 |
Broken & wear | 111111111111111111 | 11010100111111110 | 000001100110011010 |
Table 6Classification accuracy of NBU, NBU-PSO and NBU_PSO_EACH
Fault types | NBU | NBU_PSO | NBU_PSO_EACH |
Wear | 100 % | 100 % | 90 % |
Pitting | 100 % | 100 % | 87.5 % |
Broken tooth | 82.5 % | 87.5 % | 87.5 % |
Broken and wear | 37.5 % | 40 % | 77.5 % |
5. Conclusions
The NBU can obtain a high accuracy and good robustness in solving the uncertain gear interval fault classification problem. However, the NBU needs all attributes of fault feature vectors. To solve this problem, the NBU_PSO and NBU_PSO_EACH are proposed to obtain the higher classification accuracy and lower physical size of feature vectors in this paper. In NBU_PSO, the same attributes are selected for all the types of faults by PSO. But, in NBU_PSO_EACH, different attributes of feature vectors are selected for different fault types. Experiment results show that the NBU_PSO_EACH algorithm has higher classification accuracy than NBU and NBU-PSO. Moreover, the physical size of feature vectors is reduced through the PSO optimization process.
References
-
Liu B., Riemenschneider S., Xu Y. Gearbox fault diagnosis using empirical mode decomposition and Hilbert spectrum. Mechanical Systems and Signal Processing, Vol. 20, Issue 3, 2006, p. 718-734.
-
Yang Y., He Y. G., Cheng J. S., Yu D. J. A gear fault diagnosis using Hilbert spectrum based on MODWPT and comparison with EMD approach. Measurement, Vol. 42, Issue 4, 2009, p. 542-551.
-
Parey A., Pachori R. B. Variable cosine windowing of intrinsic mode functions: application to gear fault diagnosis. Measurement, Vol. 45, Issue 1, 2012, p. 415-426.
-
Tang B., Song T., Li F., et al. Fault diagnosis for a wind turbine transmission system based on manifold learning and Shannon wavelet support vector machine. Renewable Energy, Vol. 62, Issue 1, 2014, p. 1-9.
-
Yin J., Wang W., Man Z., Khoo S. Statistical modeling of gear vibration signals and its application to detecting and diagnosing gear faults. Information. Science, Vol. 259, Issue 1, 2014, p. 295-303.
-
Parey A., Badaoui M. E., Guillet F., Tandon N. Dynamic modeling of spur gear pair and application of empirical mode decomposition-based statistical analysis for early detection of localized tooth defect. Journal of Sound and Vibration, Vol. 294, Issue 1, 2006, p. 547-561.
-
Parey A., Tandon N. Impact velocity modeling and signal processing of spur gear vibration for the estimation of defect size. Mechanical Systems and Signal Processing, Vol. 21, Issue 1, 2007, p. 234-243.
-
Pandya Y., Parey A. Failure path based modified gear mesh stiffness for spur gear with tooth root crack. Engineering Failure Analysis, Vol. 27, Issue 1, 2013, p. 286-296.
-
Jinbo B., Zhang T. Support vector classification with input data uncertain. Advances in Neural Information Processing Systems, Vol. 17, Issue 1, 2005, p. 161-168.
-
Yang J., Gunn S. R. Exploiting uncertain data in support vector classification. Knowledge Based Intelligent Information and Engineering Systems, Vol. 4694, Issue 1, 2007, p. 148-155.
-
Ren J., Lee S. D., Chen X. L., et al. Naive Bayes classification of uncertain data. Proceedings of the 9th IEEE International Conference on Data Mining, 2009.
-
Tsang S., Kao B., Yip K. Y., et al. Decision trees for uncertain data. IEEE Transactions on Knowledge and Data Engineering, Vol. 23, Issue 1, 2009, p. 64-78.
-
Qin B., Xia Y., Wang S., et al. A novel Bayesian classification for uncertain data. Knowledge-Based Systems, Vol. 24, Issue 8, 2011, p. 1151-1158.
-
Xu L. J., Huang J. G., Wang H. J., Long B. A novel method for the diagnosis of the incipient faults in analog circuits based on LDA and HMM. Circuits, Systems and Signal Processing, Vol. 29, Issue 1, 2010, p. 577-600.
-
Jack L. B., Nandi A. K. Genetic algorithms for feature selection in machine condition monitoring with vibration signals. IEEE Proceeding – Visual, Image and Signal Process, Vol. 147, Issue 1, 2010, p. 205-212.
-
Kennedy J., Eberhart R. Particle swarm optimization. IEEE Conference on Neural Networks, Vol. 1, Issue 1, 1995, p. 1492-1948.
-
Center for Machine Learning and Intelligent Systems, http://archive.ics.uci.edu/ml/datasets.html.
-
Li W. J., Xiong X. F., Mao Y. M. Classification method for interval uncertain data based on improved naive Baye. Journal of Computer Applications, Vol. 11, Issue 10, 2014, p. 3268-3272.
-
Frei M. G., Osorio I. Intrinsic time scale decomposition time-frequency-energy analysis and real-time filtering of non-stationary signals. Proceedings of Mathematical, Physical and Engineering Sciences, Vol. 463, Issue 10, 2007, p. 321-342.
About this article

This research is supported by Zhejiang Provincial Natural Science Foundation of China under Grant No. LY16E050001, sponsored by K. C. Wong Magna Fund in Ningbo University.
