Abstract
In order to overcome the shortcomings of traditional reliability analysis based on large samples and statistical methods, a reliability evaluation method of the turboprop engine based on subspace similarity is proposed. The state matrix of vibration signals of the turboprop engine is obtained by the wavelet packet. The subspace of state matrix is constructed by kernel principal component analysis (KPCA). The kernel of the subspace inner product matrix is obtained based on singular value decomposition (SVD). The normalized first nuclear protagonist is treated as the operational reliability index. The method is validated by using the measured data of turboprop engines form an aircraft machinery factory. And it shows that the proposed method is reasonable and feasible, which provides an effective means for the reliability evaluation of machinery under the small sample condition.
1. Introduction
Aero-engine, a complex non-stationary system, is the power source of aircraft flight. Aero-engines complete the scheduled task safely and reliably, which is an important guarantee for aircraft safety flight [1]. It is necessary to assess the reliability of the aero-engine during operation to reduce the incidence of major safety incidents and to ensure the safe flight of the aircraft.
The operational status information of the equipment is a direct reflection of its dynamic and performance. Liao [2] conducted a study of reliability and useful life of rolling bearings combining with time domain statistical index, proportional failure rate model and Logistic model in 2006. Caesarendra [3] evaluated the reliability of the bearing signal based on evaluation models of proportional failure rate, vector machine theory and Logistic regression in 2011. A reliability evaluation model which could evaluate the reliability of the tool based on proportional failure rate is proposed, and the reliability curve which could explained effectively the reliability degradation process is given in 2011 [4]. These researches establish the evaluation model of the running status information and the dynamic reliability index of the equipment, which overcomes the shortcomings of the traditional reliability assessment methods to a certain extent. However, the accuracy of the evaluation depends on the size of the sample, and it is still necessary to study the construction method of reliability index to fit the actual situation of small sample data.
In this paper, the vibration signal of the aero-engine is obtained, and the pre-signal data collected is taken as the normal state signal in the new machine state. The new machine late data, the long test machine data and the fault machine data as the current status signal. The wavelet packet method, the kernel principal component analysis, and the singular value decomposition method are used to calculate the normal state subspace and the current state subspace. The normalization of the first nuclear protagonist is defined as the operational reliability index. The experimental results show that the proposed reliability evaluation model can well evaluate the reliability of the current running time of the engine under the condition of small sample.
2. Reliability evaluation methodology based on subspace similarity
2.1. Construction of state characteristic matrix
On the basis of wavelet transform, Wavelet packet transform can decompose the high and low frequency information of the signal at the same time, which makes the reconstructed decomposed signal closer to the original signal and preserves the time-frequency characteristic of the signal to a great extent [5].
The signal is decomposed in the equal frequency range through the wavelet packet method, and the band energy of the signal is output. The wavelet packet energy spectrum is obtained, and its size is equal to the square sum of the decomposed signals in each band after the wavelet packet method. The result of wavelet packet method is expressed by , and the energy of the signal in each frequency band is expressed as:
where: the length of the original signal is , and the wavelet packet energy spectrum is composed of all .
The state characteristic matrix is composed of the wavelet packet energy spectrum normalized, and the expression is expressed as:
where: the state feature matrix is , the feature vectors is , the number of features is , the number of feature vectors is .
2.2. Constructing state subspaces based on KPCA
Because of the different characteristics of different state signals, the eigenvalues of the wavelet packet are different, and the state feature matrix is different, so the state subspace of state feature matrix is extracted by kernel principal component analysis (KPCA) in this paper [6].
The mapping process of KPCA is expressed as:
where: the state feature matrix is , and the nonlinear feature vectors is , .
The formula for the covariance is expressed as:
The corresponding characteristic equation is expressed as:
where: the eigenvalue is and the corresponding eigenvector is . The number of eigenvalues and eigenvectors is . In the feature space,can be represented by linearly:
where: the weight vector is . The Eqs. (4) and (6) are substituted into Eq. (5):
where: the kernel matrix is , and the Gaussian kernel function is used in this paper, and its form is expressed as:
where: the kernel function parameters is .
After a series of calculations, the form of state subspace constructed is as follows:
where: the state subspace is , and dimension is , and its size is determined by the cumulative contribution rate.
2.3. Parameter selection of state subspace
In the process of constructing the state subspace by the kernel principal component analysis, the kernel function parameter is and the cumulative contribution rate is , and these two parameters need to be assigned in this paper. Among them, the effect of the kernel matrix is affected by , and the number of the selected principal component is determined by . is taken between 1 and 10, and is between 60 % and 95 % in this paper. The search step of is 1, and the search step of is 0.05. The combination of the two parameters is shown in Fig. 1.
Fig. 1A schematic diagram of a vibration separator
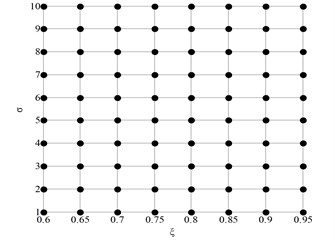
Each point corresponds to a combination of parameters in Fig. 1. There are 10×8 combinations of and , and 80 state subspaces are obtained based on KPCA at each moment.
2.4. Singular value of the inner product matrix of subspace
The state moments of and is given, and the corresponding subspaces of and represent the following from the Eq. (9):
where: the weight of the base vector of is , , and the weight of the base vector of is , . The number of base vectors is .
The formula of the state matrix of is shown below:
, . The formula of the inner product matrix of subspaces is shown below:
where: the element of is .
The singular value vector of is obtained by SVD method in this paper [7].
2.5. Definition of the reliability index
The kernel of the inner product matrix corresponds to the singular value of the inner product matrix. The first kernels protagonist of the inner kernel represents the maximum singular value of the inner product in the subspace, and it represents the most important similarity information in the two subspaces. The smaller singular values represent the secondary components the similar information of the two subspaces. Compared with other kernel main angle, the first kernel is more representative of the similarity of the subspaces. Therefore, the first nuclear protagonist normalized is defined as the reliability index.
2.6. Evaluation process of operational reliability
Combined with wavelet packet technology, kernel principal component analysis, singular value decomposition, the operational reliability evaluation method proposed mainly includes the following 10 steps in this paper. Step 1: The measured signal is collected; Step 2: Feature Extraction; Step 3: Two parameters and their steps are given; Step 4: The subspace of normal and the current state evaluated is constructed by KPCA; Step 5: The core of the inner product matrix is calculated; Step 6: The singular value diagonal is extracted as the kernel principal vector of the two subspaces; Step 7: The reliability index is defined; Step 8: The reliability of the corresponding time is obtained; Step 9: he optimal combination of parameters is selected; Step 10: The optimal parameter combination corresponding to the reliability curve is as the engine operating reliability curve of the current state.
3. Example analysis
In this paper, the data of the example analysis comes from a aircraft machinery factory, and the vibration test was carried out on the engine test bench in the field. The vibration signal data under three states including the fault engine state, new engine state and long test engine state (new engine has been running 600 h) is collected, and DT9837 data acquisition instrument is used [8]. The engine speed is 12300 r/min and the sampling frequency is 20 kHz. The 270 s data collected in the fault engine state, the 320 s data collected in the new engine state and the 190 s data collected in the long test engine state are analyzed. Time domain diagram of the first 150 s of the engine signal under three states is shown in Fig. 2.
The signals for every 10 s in three current states is decomposed into 3 layers based on the db4 wavelet packet, and the 8 bands signal is obtained. Then, the normalized energy value of each band signal, the state feature matrix, is calculated. Normalized wavelet packet energy distribution histogram for the first 10 s in the three states is shown from Fig. 3 to Fig. 5.
Fig. 2Time domain diagram of the first 150 s of the engine signal under three states
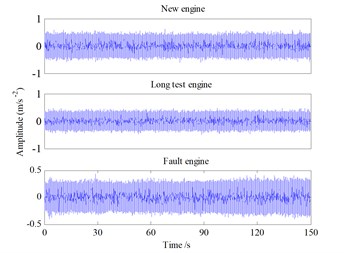
Fig. 3Normalized wavelet packet energy distribution histogram under the fault engine state
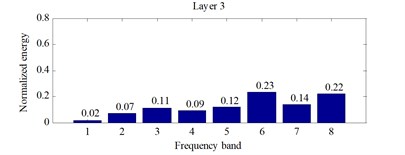
Fig. 4Normalized wavelet packet energy distribution histogram under the new engine state
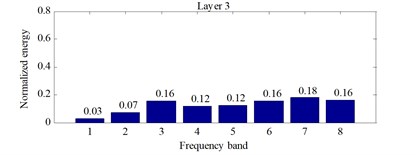
Fig. 5Normalized wavelet packet energy distribution histogram under the long test engine state
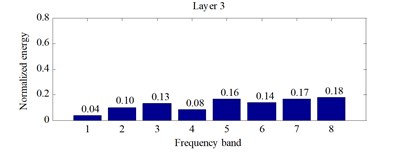
It can be seen that the energy of the eight bands changes accordingly, but the change is not obvious from Fig. 3, Fig. 4 and Fig. 5.
On the basis of feature extraction based on the wavelet packet method, the reliability is evaluated according to the evaluation process. The monotonic measure of the monotonic curve is denoted by , and , and the overall downward trend of the operational reliability index is reflected. of the fault engine is shown in Fig. 6. It can be seen that the minimum of the operational reliability index is 0.015846 in fault engine when is taken 2 and is 0.6, and the corresponding reliability curve is the fastest.
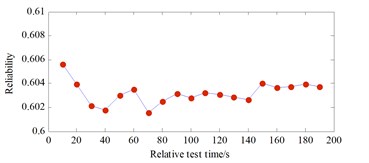
The reliability curve of in fault engine is shown in Fig. 7. Similarly, of the new machine is shown in Fig. 8, and results of parameter selection are that takes 3 and takes [0.6, 0.7], and the corresponding reliability curve of new machine is shown in Fig. 9. The of the long test engine is shown in Fig. 10, and the result of the parameter selection is that takes 1 and takes [0.6, 0.8], and the corresponding reliability curve of long test engine is shown in Fig. 11. The reliability of the fault engine, the new engine and the long test engine are shown in Table 1.
Table 1The reliability of engines under three states
The state of engine | Reliability | ||
Max | Mean | Min | |
The fault engine | 0.6505 | 0.5610 | 0.5444 |
The new engine | 0.9900 | 0.9706 | 0.9634 |
The long test engine | 0.6056 | 0.6034 | 0.6015 |
It can be seen that the reliability fluctuates between 0.54 and 0.66 during the run of the fault engine 270 s., and the reliability fluctuates between 0.96 and 1 during the run of the new engine 320 s, and the reliability fluctuates between 0.601 and 0.606 during the run of the long test engine 190 s from Fig. 7, Fig. 9 and Fig. 11. It can be seen that the maximum, minimum and average reliability in the fault engine state are 0.6505, 0.5444 and 0.5610. The maximum, minimum and average reliability in the new state engine are 0.99, 0.9634 and 0.9706; and the maximum, minimum and average reliability in the long test engine are 0.6056, 0.6015 and 0.6034 from Table 1.
Fig. 6The monotonic measure in fault engine state under different parameters
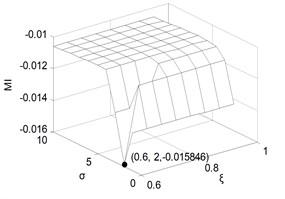
Fig. 7Reliability curve in fault engine state
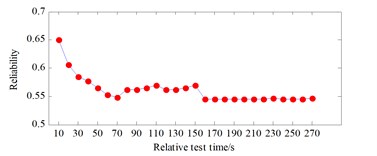
Fig. 8The monotonic measure in new engine state under different parameters
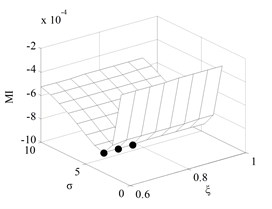
Fig. 9Reliability curve in new engine state
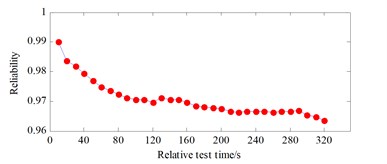
Fig. 10The monotonic measure in long test engine state under different parameters
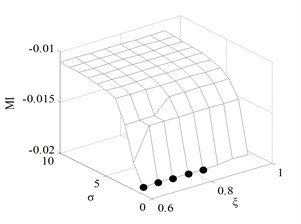
Fig. 11Reliability curve in long test engine state
4. Conclusions
In this paper, the vibration signal of the turboprop engine in three states is taken as the study object. The wavelet packet technique is used to extract the feature, and this method that can fully reflect the characteristics of the signal is simple and easy to operate. The first nuclear protagonist normalized between 0 and 1 is defined as the operational reliability index, which reflects effectively the degree of similarity between the state information. The optimal kernel function and the cumulative contribution rate are selected based on the minimization criterion of monotonic measure of the reliability index, and the reliability curve declining in the fastest that could avoid the results inaccuracy is obtained. Compared with the traditional reliability method, the defined reliability index based on the first core protagonist does not need large sample and historical failure data in this paper. This method is effective to evaluate the operation reliability of the individual engine under the small sample conditions. It can be used in aviation, electricity, machinery and other fields widely.
References
-
Wang Huawei, Gao Jun, Wu Haiqiao Reliability analysis on aero-engine using Bayesian modal averaging. Journal of Aerospace Power, Vol. 2, 2014, p. 305-313.
-
Liao H., Zhao W., Guo H. Predicting remaining useful life of an individual unit using proportional hazards model and logistic regression model. Reliability and Maintainability Symposium, 2006, p. 127-132.
-
Caesarendra W., Widodo A., Thom P. H., et al. Combined probability approach and indirect data-driven method for bearing degradation prognostics. IEEE Transactions on Reliability, Vol. 60, Issue 1, 2011, p. 14-20.
-
Ding F., He Z. Cutting tool wear monitoring for reliability analysis using proportional hazards model. The International Journal of Advanced Manufacturing Technology, Vol. 57, Issue 5, 2011, p. 565-574.
-
Gokhale M. Y., Daljeet Kaur Khanduja Time domain signal analysis use wavelet packet decomposition approach. Communications, Network and System Sciences, Vol. 3, 2010, p. 321-329.
-
Yang Shengkai Research on Feature Transformation Based on Kernel Principal Component Analysis. Zhejiang University, Hangzhou, 2014.
-
Zhang Xianda Matrix Analysis and Application. Tsinghua University Press, Beijing, 2004.
-
Cheng Li, Qu Ke, Chen Wei, et al. Vibration monitoring threshold of turboprop engine reducer. Journal of Vibration and Shock, Vol. 18, 2015, p. 136-141.
About this article

This research is financially supported by the National Science Foundation of China (Grant No. 51275374).
