Abstract
Gearbox is subject to damage or malfunctions by complicated factors such as installation position and operation condition, meanwhile, accompanied by some nonlinear behaviors, which increase the difficulty of fault diagnosis and identification. Kernel principal component analysis (KPCA) is a commonly used method to realize nonlinear mapping via kernel function for feature extraction. However, choosing an appropriate kernel function and the proper setting of its parameter are decisive to obtain a high performance of the kernel methods. In this paper, we present a novel approach combining PSO and KPCA to enhance the fault classification performance. The standard particle swarm optimization (WPSO) was used to regularize kernel function parameter of KPCA instead of the empirical value. In particular, in view of the thought of Fisher Discriminate Analysis (FDA) in pattern recognition, the optimal mathematical model of kernel parameter was constructed, and its global optimal solution was searched by WPSO. The effectiveness of the method was proven using the Iris data set classification and gearbox faults classification. In the process, gearbox fault experiments were carried out, and the vibration signals in different conditions have been tested and processed, and the fault feature parameters were extracted. At last the analysis results of gearbox fault recognition was obtained by KPCA and compared with PCA. The results show that the separability of failure patterns in the feature space is improved after kernel parameter optimized by WPSO-FDA. The problems of single failure and compound fault recognition have been effectively solved by the optimized KPCA.
1. Introduction
In the case of failure of mechanical equipment, there are many faint messages of failure and they are often accompanied by the occurrence of nonlinear behavior, so the fault features extraction and the diverse failure modes recognition become an issue. Signal feature extraction is a critical step to its condition monitoring and fault diagnosis. Principal component analysis (PCA) is a commonly used feature extraction method, but it is only suitable for solving the problem of linear relationship in the data. When the signal characteristics of mechanical equipment have large nonlinear relations, the method does not meet the requirements. Kernel principal component analysis (KPCA) presented by Schölkopf may carry out nonlinear mapping via kernel function [1]. It maps the input vector into a high-dimensional feature space to keep as much information as possible in terms of variance and find directions that have minimal reconstruction error. Fully using ideas of kernel, KPCA has more superiority to solve nonlinear problems.
Currently, KPCA has been widely applied into condition recognition and fault diagnosis, and has obtained good results. Bernal-de-Lázaro [2] used KPCA to improve the detection of small-magnitude faults. Zhang [3] put forward a novel ant-based clustering algorithm using the kernel method. Kuang [4] discussed a novel hybrid KPCA and SVM with GA model for intrusion detection. Deng [5] studied nonlinear process fault pattern recognition using statistics kernel PCA similarity factor. Bernal-de-Lázaro [6] used optimizing kernel methods to reduce dimensionality in fault diagnosis of industrial systems. However, for given data sets, the parameter of kernel function itself influences the classification of KPCA. Consequently, it is very important to correctly set kernel function parameter (called kernel parameter). At present, it is mainly determined by experiment data or by crossing tests method, which is lack of scientific theoretical basis [7]. So, it is very significant to study kernel parameters optimization method by theory for improving performance of KPCA in feature extraction and fault recognition.
Particle swarm optimization (PSO) [8] is a novel global parallel optimization algorithm, which is inspired by the biological and sociological behavior of animal swarms searching for food. More recently, various PSO and improved PSO algorithms as a type of novel evolutionary computation techniques have been developed and applied to a wide range of optimization problems [9, 10], such as function optimization [11], automatic controlling [12], robotic learning, artificial life [13] and other fields [14, 15]. Compared with genetic algorithm (GA), the PSO algorithm has no complicated evolutionary operators such as crossover and mutation so that it can be computed efficiently and implemented conveniently. Hence, it has been widely used as a more effective and competitive searching method than GA.
This paper investigates how the fault feature extraction technique with KPCA improves the effectiveness of classification algorithms, then a thought of solving the optimization problem of kernel parameter is presented. At first, an optimization mathematical model of kernel parameter based on the thought of Fisher Discriminate Analysis (FDA) is established, and the standard particle swarm optimization algorithm (namely WPSO) is used to search its global optimal solution. Simulation analysis of the Iris data set will verify effectiveness of the method. Then, experiments on gearbox fault are carried out, and vibration signals of six significant measuring points are tested and processed to investigate gearbox fault type, bearing fault type and their combination fault, and frequency domain analysis and power spectral density analysis of their signals are processed. The feature parameters in time domain and frequency domain are collected. The optimization values of kernel parameter between different fault types will be found. Thirdly, KPCA after kernel parameter optimization is applied in gearbox fault classification to maximize the separability of failure patterns in the feature space. In particular, the effectiveness to distinguish the gearbox different fault types with KPCA is analyzed, and the results obtained by KPCA are compared with PCA. Finally, the conclusion and future works are drawn in the last section.
2. Fundamentals of KPCA and kernel parameter optimal model
2.1. Principle of KPCA
The idea of KPCA is to perform PCA in a high-dimensional feature space for acquiring more intrinsic information content of the original data [16], and it is described as follows.
Given a set of training samples , , ..., in and a nonlinear mapping : , , assuming 0, the following covariance matrix is given by:
and it can be found that eigenvalues 0 and eigenvectors satisfies . Since all solutions with 0 lie in the span of , ..., , there exist coefficients , 1, 2, ..., , such that:
Meanwhile, consider the equivalent equation:
Substituting Eqs. (1)-(2) into Eq. (3):
Define a matrix by with the Mercer kernel; the following compact form is:
where the squared matrix denotes the product of with itself. In the following, the following dual equivalent form can be:
Let denote the eigenvalues of the matrix , that is , 1, 2, ..., where is the th eigenvalue of the covariance matrix . Thus Eq. (6) takes the standard form:
Eq. (7) is solved for nonzero eigenvalues and coefficient eigenvectors and the solutions are normalized by requiring that the eigenvectors of the covariance matrix are normalized to unit length, that is:
where it is assumed that the eigenvalues of are arranged in decreasing order, with being the corresponding smallest nonzero eigenvalue. Combining Eqs. (2) and (7), the normalization condition of Eq. (8) is equivalent to:
Finally, for the extraction of principal components, projections on eigenvectors : 1, 2, ..., are computed in the feature space to acquire the principal components of input data by KPCA. Consequently, let be a testing point with an image in , then:
where is the th coefficient of eigenvector associated with the th eigenvalue of the matrix , and is the th extracted principal component.
2.2. Kernel parameter
KPCA is a kernel-based learning algorithm, it is crucial to choose an appropriate kernel because the geometric structure of the mapped samples is determined by the selected kernel and its parameters. By choosing different forms of kernel functions, KPCA can deal with many nonlinear problems [17, 18]. For kernel method, most of kernel functions researched currently mainly contain different features, such as polynomial kernel function, Radial Basis Function (RBF) kernel function and neural network kernel function. The choice of kernel function has an important influence on the results. Here RBF kernel function is taken as researched objective and it is defined by:
where the parameter is called width, and indicates the degree of smoothness of the function. The width must be varied very carefully. If is overestimated, the exponential tends to a linear behavior, and its projection in high-dimensional space loses its ability to separate non-linear data. On the contrary, when is underestimated, the result is highly sensitive to noise in the information of training. So, the choice of the appropriate function width is the result of a trade-off between the two, and a scientific method is required to guide through the selection process of the optimal value.
2.3. Establishment of the optimization model of kernel parameter by means of thought of FDA
The main advantage of KPCA stems from the mapping of input data into a high dimensional feature space, which may use linear algorithms despite of the nonlinearity in the original data. In pattern recognition, the idea of FDA is to find an optimal projection direction, along which the input data is projected into a straight line to distinguish better. That is to say, it can make intra class scatter as minimum as possible and the class space as much as possible. Therefore, an optimal method of kernel parameters based on the thought of FDA [19] can be proposed.
The mathematical model of kernel parameter based on Fisher norm is as follows.
Assume that two kinds of characteristic samples in a feature space are (, , …, ), (, , …, ), 1, 2, 3,…, , 1, 2, 3, …, .
The mean vectors of them are respectively as follows:
The square of the distance between classes is:
The square of the inner-class discrete degree is:
According to idea of FDA, the optimized objective function by PSO is set up [20]:
The minimal value of can be solved to realize that the between-class scatter is the maximal whereas the within-class scatter is minimal. The parameter is set as the minimum point of Fisher discriminate function. Many experiments in references proved that for entirely non-linearly separable problem, the minimum point exists, while for linearly separable or almost linearly separable problem, the value of is sharply decreased and then becomes steady with changing from the large to the little. At the same time the parameter can be , and can change to be steady in the end. For the multiclass problems, they can be transformed into two-class problems.
3. Particle swarm optimization algorithm
3.1. Principle of standard PSO
In the PSO algorithm, the process of searching for the best solution is imitating the movement and flocking of birds. Each particle stands for a potential solution which consists of a position and a velocity. At each iteration, the particle adjusts the velocity and position based on itself optimal location and the global optimal location in population. The equations WPSO are written as follows [8, 9]:
where is the dimension of search space, is the total number of particles, and denote the position and velocity of the particle, respectively; is current optimal position of the particle , and is whole population’s optimal position; and are acceleration constants with positive values, and usually set as 0-2; and are random numbers within the range [0 1]; is current flying velocity of the particle within the range , where is maximum particle velocity, being a non-negative number; is called inertia weight, which decreases linearly with the iteration:
where is the maximum and is the minimum of , and typically, 0.9-1.4, 0.4, is current iteration number, and is the maximum number of iterations.
3.2. The steps optimized by WPSO-FDA for best solution
According to Eqs. (17) (18) and (19), the optimized steps and processes of the kernel parameter are as follows:
1) Calculate the square of the distance between the two classes and the square of intra-class scatter , by Eqs. (14), (15) and (16);
2) Construct Fisher discriminate function by Eq. (17), and regard it as a fitness for WPSO;
3) Give initial parameters such as the value range of the parameter (, ), population size of WPSO, maximum iterative step , constants and , and maximum velocity limit ;
4) Randomly create initial population , then calculate the value of individual fitness of each particle and the global fitness value of the whole population ;
5) Carry out the particle’s velocity and location updating according to Eqs. (18) and (19);
6) Judge whether the termination condition of evolution is satisfied. If , steps (4)-(6) will be repeated until termination condition is satisfied. Or else, the current solution will be output as the optimal solution , and the evolutionary computation is ended.
3.3. Simulation analysis of Iris data set by KPCA optimized by WPSO-FDA
The Iris data set is a typical test case for many statistical classification techniques, and it is selected in this paper as the test data for simulation analysis. In the data set, each group of data contains four properties of an Iris flower, i.e. sepal length, sepal width, petals length and petals width. Among three different types of flowers, the first and the other two types of flowers are linearly separable, but the latter two types of flower are nonlinear [20, 21]. 50 sets of data selected from each flower were used to simulation analysis. So, 150 groups of data from the three types of flowers can be divided into training set and test set, each containing 75 groups of data.
In the classification process of the Iris data by KPCA, it firstly maps the input vector into a high-dimensional feature space. Then, the mapping data in the feature space are analyzed, and their projections on the nonlinear principal component are obtained. This method firstly computes a vector in feature space called the first kernel principal component (KPC1) used to describe the maximum change direction of the data, and the second kernel principal component (KPC2) is orthogonal to the first principal component and describes the maximum of residual change direction. KPCA projections for Iris data with different kernel parameter width are shown in Fig. 1(a), (b), (c) and (d). When is too small, as shown in Fig. 1(a) and (b), where is set to 0.387 and 0.707, respectively, the projections appear “and” phenomenon, namely they have mixed together and cannot be separated into samples 2 and 3. In Fig. 1(c), when is 1.41, the latter two classes aliasing are less than that in Fig. 1(a) and (b), but it is still difficult to distinguish between them. In Fig. 1(d), when is 2.499, the output response range of the sample widens for the group, but there are some samples belonged to the 2nd type and the 3rd crossing together. So, it is necessary to optimize the regular parameter by WPSO-FDA.
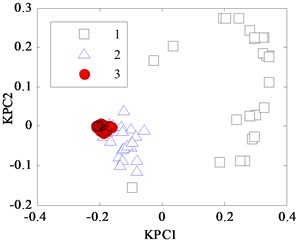
According to the steps optimized by WPSO-FDA described in section 3.2, the kernel parameter has been searched, and its evolution curve is displayed in Fig. 2(a). The width achieves the optimized value as being 1.064 after iteration steps and the fitness function becomes steady. Iris data set classification by KPCA with is displayed in Fig. 2(b). It can be seen that the three types flowers projections are in a different location, which is related to the three different categories.
Fig. 1KPCA projection diagram for Iris data with different width w
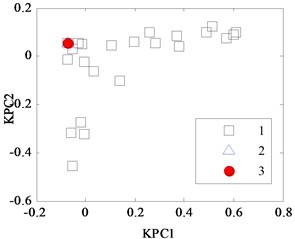
a) 0.387
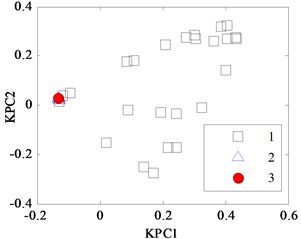
b) 0.707
c) 1.414
d) 2.449
Fig. 2KPCA analysis results for Iris data
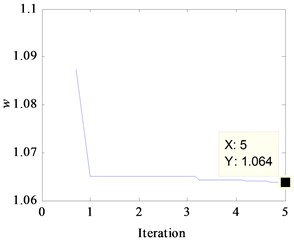
a) Kernel parameter evolution curve
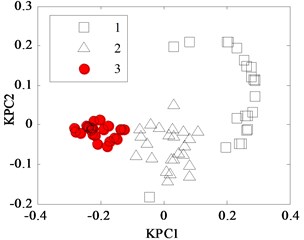
b) KPCA projection diagram, 1.064
4. The gearbox fault diagnosis experiment and features extraction
Gearbox is a part of common mechanical equipment. Due to the poor working environments, it is subject to damage or malfunctions. It is complicated that gearbox feature extraction and fault recognition because the internal components such as gears, bearings, and shafts are influenced by complicated factors such as installation position and operating condition, among which the relationship between the fault and symptom is a nonlinear mapping relation. Gearbox fault experiments were carried out, and the vibration signals in different conditions have been tested and processed. KPCA was used to extract nonlinear characteristics of gearbox vibration signal and to identify failure pattern [22, 23].
4.1. Fault simulation experiment of gearbox
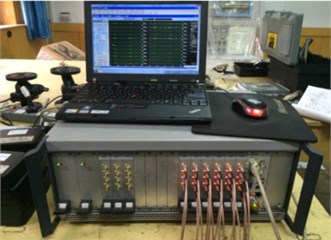
The gearbox faults simulation experiment was carried out in the vibration lab of North University of China. The gearbox (JZQ-250 type) shown in Fig. 3 is composed of two pairs of gears, three shafts (input shaft, intermediate shaft and output shaft), three pairs of bearings and housing. Motor and magnetic powder brake are coupled with input shaft and output shaft, respectively. The experimental setup was composed of 36 channels dynamic signal data acquisition analysis system from Beijing Oriental Vibration Noise Institute, three-way accelerometer (piezoelectric), laptop computers, as shown in Fig. 4.
Fig. 3The gearbox fault diagnosis experimental system
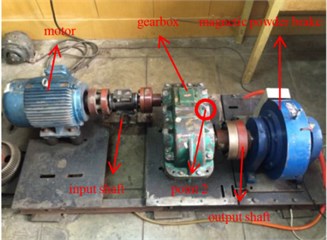
Fig. 4The gearbox fault diagnosis test system
4.2. Faults of gearbox set up and its characteristic parameters
In the gearbox fault diagnosis experiment, the following simulation failures were set up besides normal working condition of gearbox: bearing outer ring crack, bearing cage fracture, gear broken tooth and gear broken tooth combined with bearing outer ring fracture. The three fault types are shown in Fig. 5.
Fig. 5The fault tested in the experiment
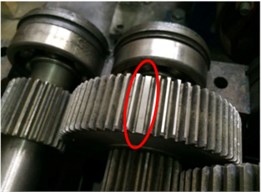
a) Gear broken tooth
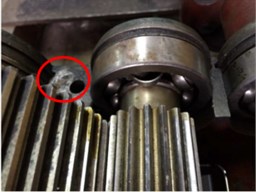
b) Bearing cage fracture
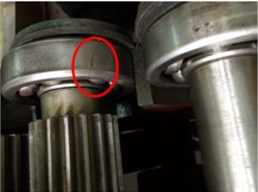
c) Bearing outer ring crack
4.3. Vibration analysis of gearbox in different conditions
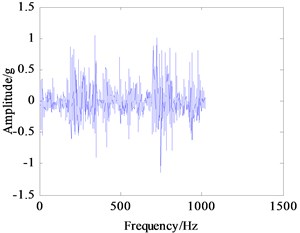
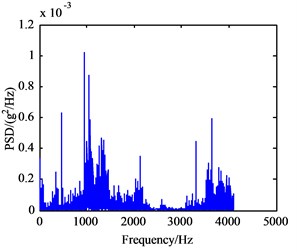
In this experiment, the input shaft speed was set to 1200 r/min, and the sampling frequency was 5120 Hz. Vibration signals of the normal working condition of the gearbox (A mode), bearing outer ring crack in intermediate shaft (B mode), bearing cage fracture (C mode), gear broken tooth (D mode), and gear broken tooth combined with bearing outer ring fracture (E mode) were acquired. The bearing characteristic frequencies of the five working states above are listed in Table 1 and include the rotating frequency of bearings mounted on three shafts, and the bearing theoretical failure frequency in every shaft are listed Table 2. The vibration signals under five conditions have been collected and processed. Their frequency spectrum curves are shown in Fig. 6, and their power spectrum density (PSD) curves are shown in Fig. 7.
Seen from Fig. 6(a)-(e), there are no big differences among the five frequency spectrum curves of vibration signal, and the amplitudes in characteristic frequencies are large, namely their vibrations are strong at this frequency. The frequency spectrum curves of B and C mode are very similar, so they cannot be used to differentiate between fault modes. In fact, the vibration signal on each measured point is not from a single component, which is the sum of different vibration signals from shafts, bearing and meshing gears in the gearbox. Therefore, it can be concluded that the curves only show the intrinsic characteristics of gearbox itself. From Fig. 7(a)-(e), the PSD curves in the case of failure are consistent with the frequency spectrum curves of the gearbox. Since the fault modes of gearbox cannot be determined to judge the gearbox fault status accurately only through the frequency curves, the further extraction of feature parameters in the time and frequency domain of vibration signals is required.
Table 1The bearing characteristic frequencies
Installation location | Bearing type | Outer ring | Inner ring | Cage | Rolling element |
Input shaft | 6406 | 40.95 | 79.05 | 6.83 | 28.32 |
Intermediate shaft | 6406 | 17.81 | 34.37 | 2.97 | 12.31 |
Output shaft | 6312 | 6.0 | 9.46 | 0.74 | 3.91 |
Table 2The bearing theoretical failure frequency in every axis
Frequency | One times / Hz | Two times / Hz | Three times / Hz |
Input shaft | 20 | 40 | 60 |
Intermediate shaft | 8.69 | 17.38 | 26.09 |
Output shaft | 1.93 | 3.86 | 5.79 |
Gear(1,2) meshing | 600 | 1200 | 1800 |
Gear(3,4) meshing | 156.25 | 312.5 | 468.7 |
Fig. 6Frequency spectrum curves of vibration signals
a) A mode
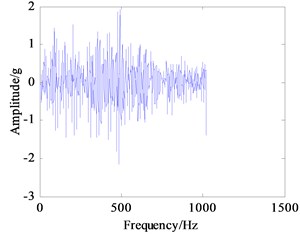
b) B mode
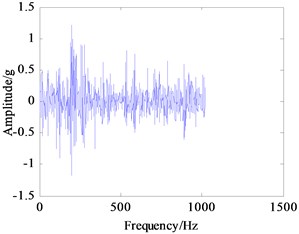
c) C mode
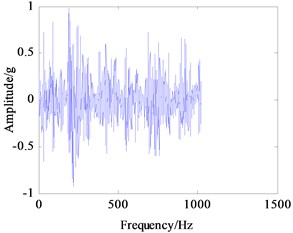
d) D mode
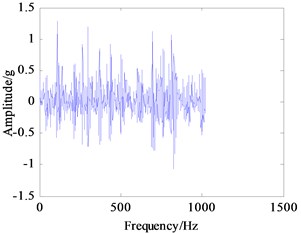
e) E mode
Fig. 7Power spectrum density curves of vibration signal
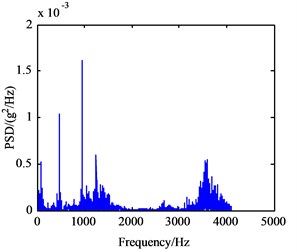
a) A mode
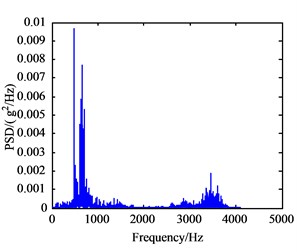
b) B mode
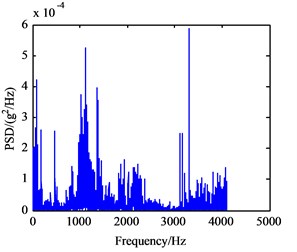
c) C mode
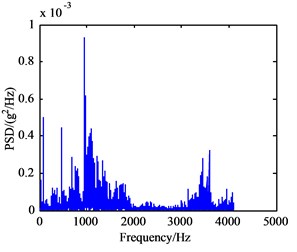
d) D mode
e) E mode
4.4. Construction of gearbox feature parameter set
The collected signals were processed, and in particular, the data of the measuring point 2 shown in Fig. 3 were analyzed. The original feature parameters set extracted from time domain and frequency domain are summarized in Table 3. The time-domain features include dimensional and dimensionless parameters, such as the mean value, skewness, kurtosis, waveform index and peak index. The frequency-domain features include only dimensional parameters such as frequency domain variance and correlation factor. 60 groups of feature samples were extracted under five working conditions, and half of them are training samples and the others are test samples. They were applied to KPCA for fault identification and classification of gearbox [24, 25].
5. Kernel parameters optimization and faults classification of gearbox
5.1. Kernel parameters optimization based on WPSO-FDA
When KPCA is applied, the kernel parameter of the Radial Basis Function is a key to maintain good performance of nuclear study. Excessively large width will bring about the result that the influence spheres of a sample may be so large that irrelevant training samples will interfere the new test samples to make the right judgment; while too small value will result in the consequence that nuclear learning with only memory is unable to make a judgment to new sample [7]. Therefore, for training samples, kernel parameters optimization based on WPSO-FDA was conducted, and the parameter settings of WPSO are summarized in Table 4. The process of fitness function optimization with iteration under different conditions of gearbox is shown in Fig. 8. The width values of RBF between different fault states were obtained by WPSO-FDA optimization, and the optimization results are shown in Table 5. From Fig. 8 the width can be stabilized at an optimum value within the 50 iterations of fitness function evaluation. For example, for bearing outer ring crack and gear broken tooth, optimal parameter values can be stabilized at a width of 2.660. The optimal values are used in the parameters setting of KPCA for gearbox fault classification.
Fig. 8Fitness function evolution curves based on WPSO
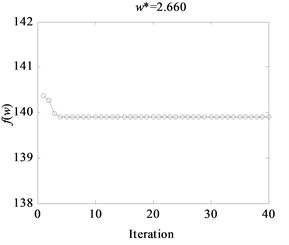
a) Bearing outer ring crack and gear broken tooth
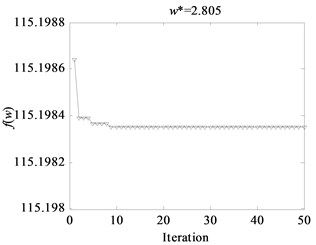
b) Bearing cage fracture and gear broken tooth combined with bearing outer ring crack
Table 3Feature parameters in time-domain and frequency-domain
Domain category | Dimensional parameter | Dimensionless parameter |
Time-domain | Mean value, root mean square, variance, kurtosis, skewness, mean square value, root square amplitude, absolute average amplitude | Waveform index, peak index, margin index, kurtosis index, skewness index, bias-normal distribution index, eight-order moments coefficient, sixteen-order moment coefficient |
Frequency-domain | Correlation factor, mean-square spectrum, harmonic factor, power and gravity centre index, frequency domain variance, origin moment of spectrum | – |
Table 4Parameters set in WPSO
WPSO | |||||||
Parameters | 20 | 1.2 | 0.4 | 2 | 2 | 60 | 1 |
Table 5The optimization results of Kernel parameter in five models samples
Fault model | |
Bearing outer ring crack and gear broken tooth (B and D) | 2.660 |
Bearing outer ring crack and bearing cage fracture (B and C) | 0.556 |
Bearing cage fracture and gear broken tooth combined with bearing outer ring crack (C and E) | 2.805 |
Bearing outer ring crack and gear broken tooth combined with bearing outer ring fracture (D and E) | 1.078 |
5.2. Fault classification of KPCA based on WPSO-FDA
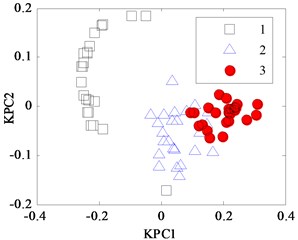
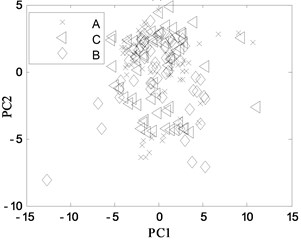
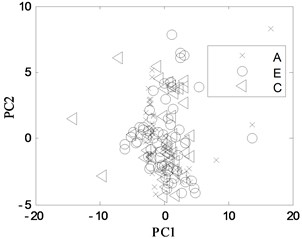
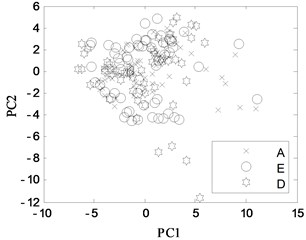
First, 30 groups of original feature sets drawn from normal condition were trained, then tests were carried through 30 groups of data from four fault modes such as bearing outer ring crack, bearing cage fracture, gear broken tooth and gear broken tooth combined with bearing outer ring fracture. Finally, for the same fault modes, the fault recognition results obtained by KPCA and PCA were analyzed, as shown in Fig. 9 and Fig. 10, respectively.
Fig. 9KPCA projection in different conditions
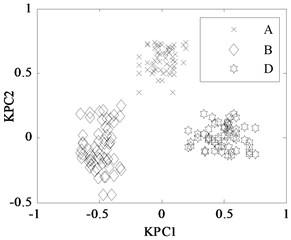
a) A, B, and D modes
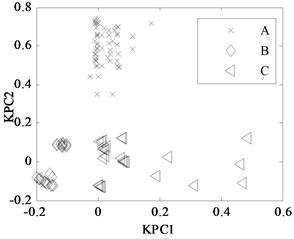
b) A, B, and C modes
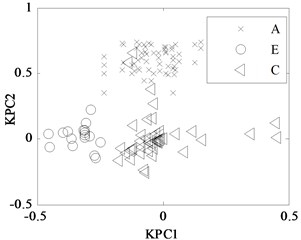
c) A, E and C modes
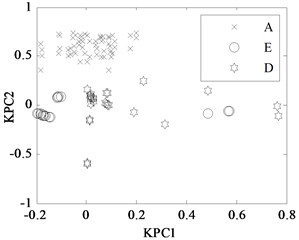
d) A, E and D modes
Fig. 10PCA projection in different conditions
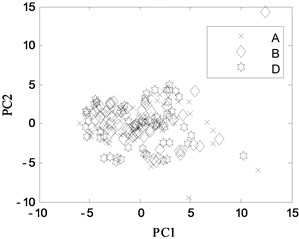
a) A, B and D modes
b) A, B and C modes
c) A, E and C modes
d) A, E and D modes
The KPCA projections from the first kernel principal component (KPC1) to the second kernel principal component (KPC2) in feature space are displayed in Fig. 9, and the PCA projections in original space are shown in Fig. 10. Observed from the Fig. 9, KPCA projections can clearly distinguish the various fault modes. The principal component projections from five modes conditions show obviously self-aggregation behaviours. Especially, the normal condition (A mode) can focus on a centre, while the bearing cage fracture (C mode) are relatively dispersed, but far from the normal cluster centre, apparently belong to different classes. From Fig. 9(c), there are a few crossing points between D mode and E mode, as a whole, the intra-class space of KPCA is little, whereas the space of different classes of KPCA is much. From Fig. 10, the PCA projections are mixed together, and normal condition cannot be clearly distinguished with the fault modes, and several faults cannot be separated from each other due to their nonlinearity. Therefore, the KPCA performance optimized by WPSO-FDA has obviously improved in the non-linear analysis, and accurately identifies not only single fault modes of gearbox but also the compound fault.
6. Conclusions
KPCA is usually used to feature extraction for fault recognition and classification because it extracts the principal components by adopting a nonlinear kernel method and remain good divisibility. But How to reasonably set the kernel function parameter is the key to obtain good performance. This paper presented a systematic method to optimize a RBF kernel parameter of KPCA through WPSO and used example analysis of gearbox fault diagnosis to demonstrate its effectiveness. It is relying on a theoretical model of kernel parameters established by means of thought of FDA, and the WPSO is applied to optimize it for reducing the kernel parameter blindness in a set. The classification results for Iris data set show that the method improved the KPCA classification performance. At last, the KPCA is used multi-fault classification in gearbox. The results show that fault classifications are effective by KPCA after the kernel parameter is optimized by WPSO-FDA, that is to say, within-class scatter of feature samples in every condition realizes as minimum as possible and between-class scatter of feature samples in different condition types as much as possible. It is concluded that non-linear mapping performance of KPCA after its kernel parameter regularized by WPSO-FDA is greatly improved in nonlinear feature extraction and the proposed method fits for single mechanical fault classification and compound fault classification. However, how to effectively address a large number of diversity compound faults diagnosis of mechanical equipment in real applications still requires further work.
References
-
Twining C. J., Taylor C. J. The use of kernel principal component analysis to model data distributions. Pattern Recognition, Vol. 36, Issue 1, 2003, p. 217-227.
-
Bernal De Lázaro J.-M., Llanes Santiago O., Prieto Moreno A., et al. Enhanced dynamic approach to improve the detection of small-magnitude faults. Chemical Engineering Science, Vol. 146, 2016, p. 166-179.
-
Zhang L., Cao Q. A novel ant-based clustering algorithm using the kernel method. Information Sciences, Vol. 181, Issue 20, 2011, p. 4658-4672.
-
Kuang F., Xu W., Zhang S. A novel hybrid KPCA and SVM with GA model for intrusion detection. Applied Soft Computing Journal, Vol. 18, 2014, p. 178-184.
-
Deng X., Tian X. Nonlinear process fault pattern recognition using statistics kernel PCA similarity factor. Neurocomputing, Vol. 121, 2013, p. 298-308.
-
Bernal De Lázaro J. M., Prieto Moreno A., Llanes Santiago O., et al. Optimizing kernel methods to reduce dimensionality in fault diagnosis of industrial systems. Computers and Industrial Engineering, Vol. 87, 2015, p. 140-149.
-
Wang X., Qiu J., Liu G. Kernel function optimization in kernel principle component analysis and its application to feature extraction of gear faults. Journal of Vibration, Measurement and Diagnosis, Vol. 27, Issue 1, 2007, p. 62-64, (in Chinese).
-
Kennedy J., Eberhart R. Particle swarm optimization. IEEE International Conference on Neural Networks, Vol. 4, 1995, p. 1942-1948.
-
Shi Y., Eberhart R. A modified particle swarm optimizer. Applied Mathematics and Computation, Vol. 189, Issue 5, 1998, p. 69-73.
-
Gou J., Lei Y.-X., Guo W.-P., et al. A novel improved particle swarm optimization algorithm based on individual difference evolution. Applied Soft Computing, Vol. 57, 2017, p. 468-481.
-
Delgarm N., Sajadi B., Kowsary F., et al. Multi-objective optimization of the building energy performance: A simulation-based approach by means of particle swarm optimization (PSO). Applied Energy, Vol. 170, 2016, p. 293-303.
-
Eswaran T., Kumar V. S. Particle swarm optimization (PSO)-based tuning technique for PI controller for management of a distributed static synchronous compensator (DSTATCOM) for improved dynamic response and power quality. Journal of Applied Research and Technology, Vol. 15, Issue 2, 2017, p. 173-189.
-
Rastegar S., Araújo R., Mendes J. Online identification of Takagi-Sugeno fuzzy models based on self-adaptive hierarchical particle swarm optimization algorithm. Applied Mathematical Modelling, Vol. 45, 2017, p. 606-620.
-
Beigvand S. D., Abdi H., La Scala M. Hybrid gravitational search algorithm-particle swarm optimization with time varying acceleration coefficients for large scale CHPED problem. Energy, Vol. 126, 2017, p. 841-853.
-
Ansari Z., Almasganj F. Implementing PCA-based speaker adaptation methods in a Persian ASR system. 5th International Symposium on Telecommunications, Vol. 32, 2010, p. 769-774.
-
Schölkopf B., Smola A., Müller K.-R. Nonlinear component analysis as a Kernel eigenvalue problem. Neural Computation, Vol. 10, Issue 5, 1998, p. 1299-1319.
-
Zhang Y., Zuo H., Bai F. Classification of fault location and performance degradation of a roller bearing. Journal of the International Measurement Confederation, Vol. 46, Issue 3, 2013, p. 1178-1189.
-
Shao R., Hu W., Wang Y., et al. The fault feature extraction and classification of gear using principal component analysis and kernel principal component analysis based on the wavelet packet transform. Measurement, Vol. 54, 2014, p. 118-132.
-
Pan H., Wei X., Huang J. Fault feature extraction based on KPCA optimized by PSO algorithm. IEEE International Conference on Industrial Informatics, 2010, p. 102-107.
-
Wei X., Pan H., Wang F. Feature extraction based on kernel principal component analysis optimized by particle swarm optimization algorithm. Journal of Vibration, Measurement and Diagnosis, Vol. 29, Issue 9, 2009, p. 162-166, (in Chinese).
-
Xiao Y., Feng L. A novel neural-network approach of analog fault diagnosis based on kernel discriminant analysis and particle swarm optimization. Applied Soft Computing, Vol. 12, Issue 2, 2012, p. 904-920.
-
Shi H., Liu J., Zhang Y. An optimized kernel principal component analysis algorithm for fault detection. Compute, Vol. 42, Issue 6, 2009, p. 846-851.
-
Zhu Z. B., Song Z. H. A novel fault diagnosis system using pattern classification on kernel FDA subspace. Expert Systems with Applications, Vol. 38, Issue 6, 2011, p. 6895-6905.
-
Reddy K. N., Ravi V. Differential evolution trained kernel principal component WNN and kernel binary quantile regression: application to banking. Knowledge-Based Systems, Vol. 39, 2013, p. 45-56.
-
Cheng G., Chen X., Li H., et al. Study on planetary gear fault diagnosis based on entropy feature fusion of ensemble empirical mode decomposition. Measurement, Vol. 91, 2016, p. 140-154.
Cited by
About this article

This work was supported by The Key Research and Development Program of Shanxi Province under Grant No. 2016-33.
