Abstract
The vibration signals provide useful information about the state of rolling bearing and the diagnosis of the faults requires an accurate analysis of these signals. Several methods have been developed for diagnosing rolling bearing faults by vibration signal analysis. In this paper, we present an improvement of the technique Complete Ensemble Empirical Mode Decomposition with Adaptive Noise (CEEMDAN), this technique is combined with the Minimum Entropy Deconvolution (MED) and the correlation coefficient to diagnose defects. First, the vibration signal was decomposed by the improved CEEMDAN decomposition into several oscillatory modes called Intrinsic Mode Function (IMF). After calculation of the correlation coefficients between the original signal and their IMFs, the modes with higher coefficients are selected as the relevant modes. Secondly, the MED technique is applied to the selected modes in order to improve the sensitivity of the scalar and frequency indicators of faults detection. Finally, kurtosis and envelope analysis are used to detect and locate the defect position. The simulation is carried out using the Case Western University data base and the results obtained show that the proposed method provides very good results for the early detection and diagnosis of defects and can efficiently extract the defective characteristics of the rolling bearing.
1. Introduction
Vibration signal analysis is a very important tool in fault diagnosis and monitoring of rotating machines. The vibration signal of rotating machines is generally non-stationary, non-linear and noisy; therefore, the extraction of the defect characteristics is difficult. Appropriate processing of the vibration signal is necessary to eliminate signals from other sources in the machine and to improve the quality of the useful signal. Empirical Mode Decomposition (EMD) is a signal processing tool used to analyze non-stationary, nonlinear signals [1-5]. It was first presented by Huang et al. [3]. EMD decompose the signal into several intrinsic mode functions (IMF), from the highest frequencies to the low frequencies. Mode mixing is a major problem of the EMD. Wu and Huang [6] proposes an improved version of EMD called Ensemble Empirical Mode Decomposition (EEMD) to solve this problem. The idea of EEMD is based on the addition of Gaussian white noise to the original signal to generate an ensemble of noisy signal and decomposition is performed on the ensemble. The final IMFs are calculated by the average of the IMFs of all copies. The disadvantage of EEMD method appears in the reconstructed signal that it contains a residual noise and the different realizations of the noisy signal can produce a different number of modes and which makes it difficult to averages. Jia-Rong Yeh, et al. [7] present the Complementary EEMD to solve the problem of reconstruction, based on the addition of set of noise pairs (positive and negative) to the original signal to generate two sets [8]. The problem of number of the modes of the different realizations still exists. The Complete Ensemble Empirical Mode Decomposition with Adaptive Noise (CEEMDAN) is presented by Torres M. E., et al. [9] to solve the problem of reconstruction and production the number of modes for the different copies of noisy signal in EEMD [8, 10]. In this work, an improvement of the CEEMADN is presented to reduce the residual noise in the modes and solve the problem of the appearance of the parasitic modes [8]. The improved CEEMDAN is combined with Minimum Entropy Deconvolution (MED) and correlation coefficients to select the relevant modes and increase sensitivity to the defect detection indicator. This paper is organized as follow: Section 2 introduce the basic of EMD and their versions. Section 3 presents the improved CEEMDAN method. In Section 4, we introduce the technique of selecting the relevant modes by the calculation of correlation coefficient. Minimum Entropy Deconvolution (MED) is presented in Section 5. The hybrid method based on improved CEEMDAN, correlation coefficient and MED technique and their application to the measured data are presented in Sections 6, 7 respectively and in Section 8 the conclusion.
2. The EMD and its improved versions
2.1. The EMD algorithm
The EMD method decomposes a signal into several intrinsic mode functions (IMF) and a residual, where the IMF should meet the following two conditions [1-5]:
1) The number of extremes and the number of zero crossings must be equal or differ at most by one.
2) The average value of the envelope of local maxima and local minima is zero.
For a given signal , the EMD algorithm is described in the following steps:
Step 1: define all the local extrema of , and connect all the local maxima (resp. minima) by a cubic spline line to find the upper envelope (resp lower envelope ).
Step 2: calculate the mean envelope: .
Step 3: calculate the difference between the signal and : .
Step 4: if is an IMF?
Yes: save as and compute the residue , do , then treat as input data in step 2.
No: treat as input data in step 2.
Step 5: Continue until the final residue satisfies predefined stopping criterion.
The stopping condition (SD) is calculated from the two consecutive sifting results, namely and as:
The process (step 2 to 5) requires certain number of iterations called the sifting process to extract each mode.
The sifting process is terminated when the SD value is greater than a certain threshold.
The signal can be expressed as follows:
where the final residue, the number of IMF.
2.2. The EEMD method
The Problem of EMD is the appearance of mode mixing effect. Wu and Huang [6] propose ensemble empirical mode decomposition (EEMD) to avoid mixing mode, thus algorithm is described as follows [6, 11].
Step 1. Generate , where ( 1, …, ) is a zero mean unit variance white noise realization, and noise standard deviation 0.
Step 2. Decompose ( 1, …, ) by EMD to obtain the modes , where 1, …, .
Step 3. Compute the th mode of by averaging the corresponding modes:
The relationship among the amplitude of added white noise and the number of ensemble trials is given by:
where is the amplitude of the added noise, and is the final standard deviation of error.
It ca be seen some disadvantages in the EEMD such as [8]:
1) The decomposition is not complete.
2) The different realizations of the noisy signal can produce different number of modes.
2.3. The complementary EEMD
In EEMD, the problems of white noise are not totally eliminated, and the disadvantages of this technique are the interaction between the signal and the noise. The complementary EEMD has been presented to solve this problem [7]. The idea of this technique is to add positive and negative white Gaussian noises to the original signal to generate two sets of IMF [8]. The complementary EEMD algorithm is summarized in the following steps [12-14]:
Step 1: Add in pairs the white noise to the original signal and construct two new data sets and :
Step 2: decompose and by EMD and obtain , from those positive mixtures and negative mixtures respectively.
Step 3: Repeat the above step times to obtain two sets, , the th IMF obtained with addition of the th positive mixtures and negative mixtures respectively.
Step 4: the final IMF is calculated by:
The original signal can be expressed by:
2.4. Complete ensemble empirical mode of decomposition with adaptive noise (CEEMDAN)
The problem of decomposition complementary EEMD is the high computational cost and there is no guarantee that and will produce the same number of modes. To solve these problems and retain the characteristics of complementary EEMD (elimination of mode mixing) [7, 12], an algorithm called CEEMDAN was presented in the following steps [8, 10]:
Step 1: Decompose by EMD realizations of ( 1, …, ) to obtain its first modes and calculate:
Step 2: Calculate the first residue: .
Step 3: Decompose by EMD , 1, …, to obtain its first modes and define the second CEEMDAN mode as:
Step 4: for 2, …, calculate the th residue:
Step 5: Decompose the realizations 1, …, by EMD and define the ()th CEEMDAN mode as follows:
where is a function to extract the th IMF decomposed by EMD.
Step 6: Go to step 4 for the next .
Step 7: Iterate the steps 4 to 6 until the obtained residue cannot be further decomposed by EMD. The final residue is given by:
So, the given signal can be expressed as:
where the total number of modes, the amplitude of the added white noise, and is the white noise with unit variance.
3. Improved complete ensemble empirical mode of decomposition with adaptive noise (ICEEMDAN)
In the original CEEMDAN, we decompose the various realizations to extract the ()th mode, which produces a strong overlap in the scales and consequently we notice spurious modes and a residual noise in the modes. To reduce this overlap, we do not directly use the white noise but use to extract the mode th. We use the operators and which produce the local mean of the applied signal and denotes the action of the average during the realizations. In EEMD and original CEEMDAN, the first mode is given by [7]:
So, to reduce the noise present in modes, we compute only the local mean and calculate the first mode as:
The improved CEEMDAN algorithm is given by following steps [8]:
Step 1. using EMD to calculate the local means of realizations ( 1, 2, …, ) and obtain the first residue:
Step 2. Calculate the first mode : .
Step 3. Calculate the second residue by averaging of local means of the realizations and define the second mode as:
Step 4. calculate the th residue as:
where 3, …,.
Step 5. Compute the th mode as:
Step 6. Go to step 4 for next .
The coefficients make it possible to select the SNR at each stage. Wu and Huang [6] have suggested to use small amplitude values for data dominated by high frequency signals and vice versa. In this paper, we used a few hundred realizations and the same SNR for all stages.
4. Selection the relevant modes
The important step is to find the relevant modes which contain the useful signal. The correlation coefficient is a powerful tool to select the relevant modes. For a given time series , the correlation coefficient between the original signal and its IMFs obtained by improved CEEMDAN is given by the following equation [15, 16]:
where denotes the length of data, and 1, 2, …, number of IMFs.
5. Minimum entropy deconvolution technique
The Minimum Entropy Deconvolution (MED) was first presented by Ralph Wiggins [17]. The objective of MED is to reduce the randomness of a signal by minimizing its entropy and reconstruct the output signal with maximum value of kurtosis. The original signal , where denotes the fault impulse, denotes the noise, and denotes the fault impulses in original form. The deconvolution MED search to find the coefficients of the inverse filter which achieves the output is approximately equal to [18-20].
The objective function is given by the following equation:
The optimal filtering parameters are obtained when the objective function achieves:
Fig. 1Deconvolution MED process

The general filter is given by:
Using the formula , and pervious Eqs. (22), (23), we get:
Eq. (24) can be written in matrix form:
where is Toeplitz autocorrelation matrix, is the column vector of inverse filter coefficients, is filter input and output cross-correlation matrix, , is expressed as:
The solution for the optimum inverse filter is summarized in following steps [19-22]:
Step 1: Calculate the autocorrelation matrix .
Step 2: Initialization the value of inverse filter coefficients .
Step 3: Calculate the output signal using the input signal and initial value of inverse filter coefficients .
Step 4: Calculate using and input .
Step 5: Solve for new filter coefficients .
Step 6: Calculate the error criterion:
If tolerance, the iteration is finishes, else tolerance, update the filter coefficient and repeated the process.
6. Bearing fault diagnosis using hybrid method based on improved CEEMDAN and MED technique
The process of bearing fault diagnosis using hybrid method based on improved CEEMDAN and MED technique is summarized in the following steps:
Step 1: Using improved CEEMDAN algorithm to decompose the measured vibration signal.
Step 2: Estimate the correlation coefficient between each IMFs and the original signal.
Step 3: Select the IMFs with a high correlation coefficient as the relevant modes.
Step 4: Applied MED technique to the selected IMFs.
Step 5: Calculate the kurtosis of signal obtained by the application of the MED technique to detect the defect.
Step 6: Using envelope analysis to locate the location of the defect if it exists.
7. Application to experimental signals
The effectiveness of the proposed method is investigated by using the experimental data set of the electrical engineering laboratory of Case Western Reserve University [24]. The data is acquired from the test stand shown in Fig. 2, where it consists of a 2 hp motor, a torque transducer/encoder, dynamometer and control electronics. The test bearing supports the motor shaft which is the deep groove ball bearing with type of 6205-2RSJEM SKF. Vibration data was collected at 48,000 samples per second using accelerometers, which are attached to the housing with magnetic bases. Motor bearings were seeded with faults using electro-discharge machining. Defects with a diameter 0.007, 0.014, 0.021 inches were introduced separately at the inner raceway, outer raceway and ball. Faulted bearings were reinstalled into the test motor and vibration data was recorded with motor speeds 1797 RPM, 1772 RPM, 1750 RPM and 1730 RPM.
Fig. 2The bearing tests stand [24]
![The bearing tests stand [24]](https://static-01.extrica.com/articles/18762/18762-img2.jpg)
The information of bearing is given in Table 1. The type of defect can be determined by identifying the characteristic frequency. These characteristic frequencies are given by the following equations [23]:
Pass frequency of inner race is:
Pass frequency of outer race is:
Pass frequency of ball is:
where is intermediate diameter (mm), is ball diameter (mm), is rolling element number, contact angle (rad), is rotating frequency (Hz).
According to the parameters in Table 1 and the equations above, calculated pass frequencies are shown in Table 2.
Table 1The parameter of bearing
Contents | Parameters |
Bearing specification | 6205-2RSJEM SKF |
Inside diameter | 25 mm |
Outside diameter | 52 mm |
thickness | 15 mm |
Intermediate diameter | 39 mm |
Ball diameter | 8 mm |
Rolling element number | 9 |
Contact angle | 0 rad |
Table 2The calculated pass frequencies
Rotational speed | Inner race (Hz) | Outer race (Hz) | Ball (Hz) |
1797 | 162.44 | 107.10 | 139.86 |
1772 | 160.18 | 105.61 | 137.91 |
1750 | 158.20 | 104.30 | 136.20 |
1730 | 156.36 | 102.93 | 134.64 |
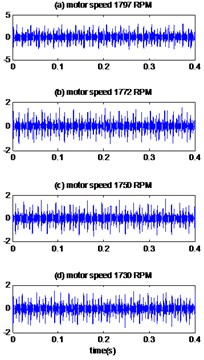
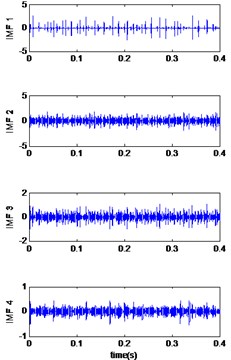
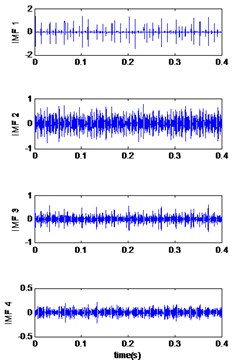
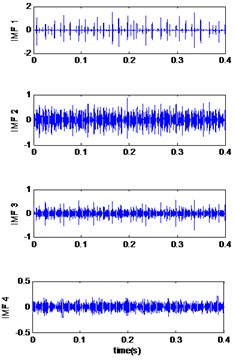
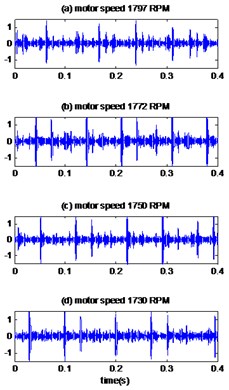
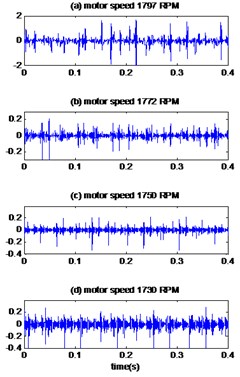
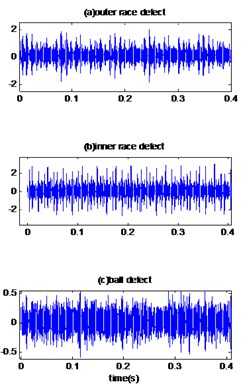
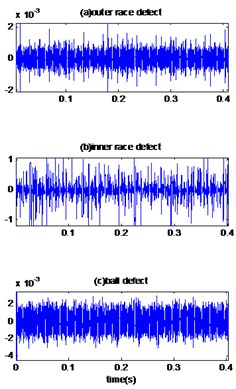
7.1. Case 1: bearing with inner race defect
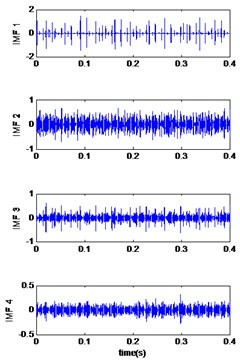
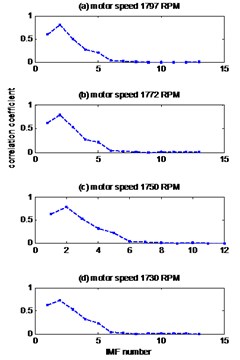
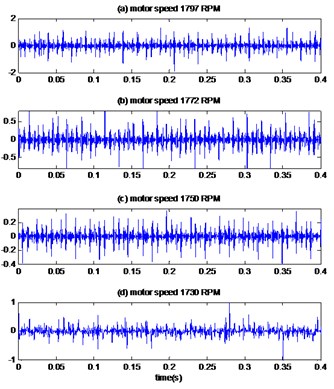
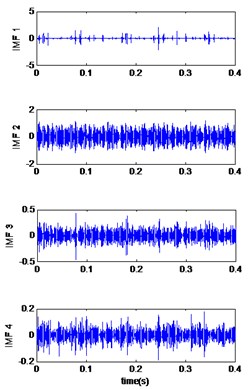
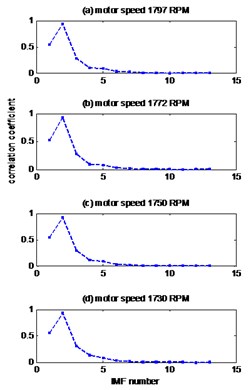
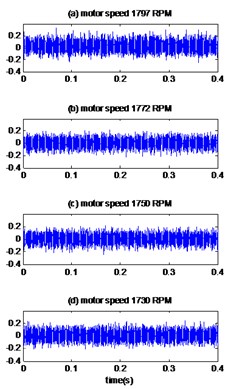
In the first case, the vibrations signals of the bearing with inner race fault are studied. The measured vibrations of defect diameter 0.007 inches are displayed in Fig. 3(a). The improved CEEMDAN is applied to decompose the vibrations data and the first four IMFs are plotted in Fig. 3(b-d) and (e)). After calculating the correlation coefficient between the original signal and its IMFs (Fig. 3(f)), it is can be seen that the first two IMFs have a higher correlation coefficient, so these are relevant modes, then we applied the MED technique to selected modes and the results is shown in Fig. 4(a). Table 3 compares the Kurtosis values of the measured signals, the reconstructed signals for each bearing condition by EMD-MED method [20] and the proposed method. For the bearing with an inner race defect, the kurtosis of the measured vibrations is 6.10, 7.40, 7.39 and 5.95 for the motor speeds 1797 RPM, 1772 RPM, 1750 RPM and 1730 RPM respectively, the kurtosis of obtained signals by EMD-MED method are 8.70, 9.84, 10.65 and 10.60 for the motor speeds 1797 RPM, 1772 RPM, 1750 RPM and 1730 RPM. These values increase by the application the proposed method to 12.52, 17.01, 13.17 and 12.91 for the motor speeds 1797 RPM, 1772 RPM, 1750 RPM and 1730 RPM respectively. We can see that the effect of the proposed method on kurtosis is obviously superior to the other method.
Table 3Kurtosis values of measured vibration and reconstructed signal (defect diameter = 0.007 inches)
Kurtosis | ||||||
Signal | Inner race fault | Outer race fault | ||||
Rotational speed | Measured vibration | EMD-MED | Proposed method | Measured vibration | EMD-MED [20] | Proposed method |
1797 | 6.10 | 8.70 | 12.52 | 4.25 | 6.42 | 13.61 |
1772 | 7.40 | 9.84 | 17.01 | 4.00 | 10.60 | 11.47 |
1750 | 7.39 | 10.65 | 13.17 | 4.36 | 7.86 | 15.74 |
1730 | 6.95 | 10.60 | 12.91 | 4.039 | 7.70 | 11.01 |
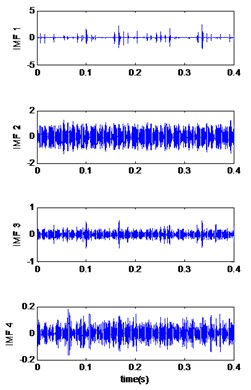
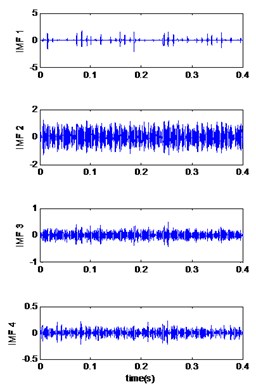
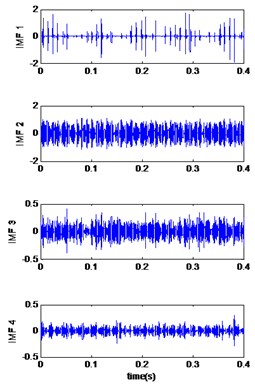
Fig. 3Signals of bearing inner race defect with diameter 0.007 inches: a) the measured signal, b) IMFs signal with speed motor 1797, c) IMFs signal with speed motor 1772, d) IMFs signal with speed motor 1750, e) IMFs signal with speed motor 1730, f) The coefficient correlation between the signal original and its IMFs
a)
b)
c)
d)
e)
f)
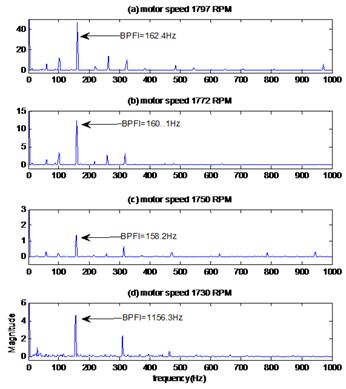
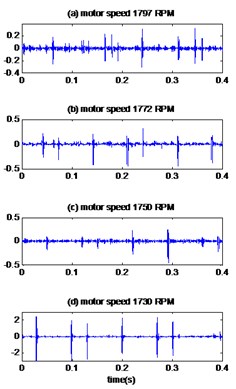
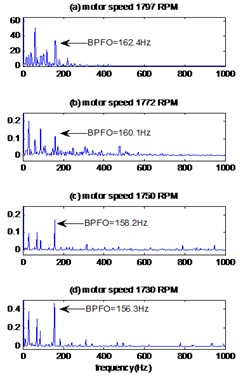
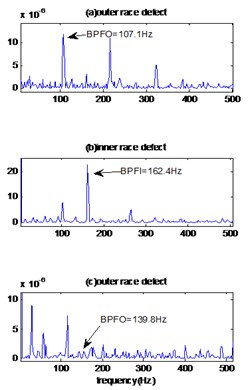
The envelopes spectrums are plotted in Fig. 4(b). The characteristic frequencies 162.44 Hz, 160.18 Hz, 158.2 Hz and 156.36 Hz for motor speeds 1797 RPM, 1772 RPM, 1750 RPM and 1730 RPM respectively can be clearly observed which is very close to the calculated inner race pass frequency in Table 2. Therefore, it is identified as the inner race defect. Fig. 13 represents the reconstructed signal obtained by the EMD-MED method and their envelope spectrums of vibration signal of bearing defect with diameter 0.007 inches and speed motor 1797 RPM. As we see, the EMD-MED method also identifies the frequency of the inner race defects at 162.4 Hz, whereas the proposed technique shows these frequencies more clearly and with higher amplitudes.
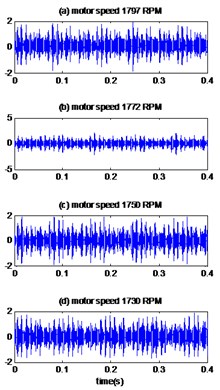
Similar observations are made for the results obtained by applying the proposed method to measured vibration signals of bearing with inner race defect with diameter 0.014 and 0.021 inches. Fig. 5(a), 6(a) shows the measured signals of bearing with inner race defect with diameter 0.014 and 0.021 inches respectively and the results are presented in Fig. 5(b), 6(b). The kurtosis values of the vibrations signals with the defect diameter 0.014 inch and 0.021 inches are presented in Table 4 and Table 5 respectively for different motor speeds. We thus see that the proposed method is better than the EMD-MED method to improve the value of kurtosis and thus the early detection of defects.
Fig. 4The reconstruction signals by the proposed method of bearing with inner race defect with diameter 0.007 inches: a) time signals, b) envelopes spectrums
a)
b)
Fig. 5The signals of bearing with inner race defect with diameter 0.014 inches: a) the measured signals, b) the reconstructed signal, c) the envelopes spectrum
a)
b)
c)
Table 4Kurtosis values of measured vibration and reconstructed signal (defect diameter = 0.014 inches)
Kurtosis | ||||||
Signal | Inner race fault | Outer race fault | ||||
Rotational speed | Measured vibration | EMD-MED [36] | Proposed method | Measured vibration | EMD-MED | Proposed method |
1797 | 11.91 | 13.62 | 20.02 | 3.13 | 10.26 | 10.31 |
1772 | 18.80 | 30.08 | 40.26 | 3.21 | 9.95 | 10.09 |
1750 | 21.04 | 31.80 | 50.86 | 3.04 | 4.79 | 7.94 |
1730 | 20.06 | 26.69 | 32.67 | 3.19 | 6.03 | 10.10 |
The envelopes spectrums are showed in Fig. 5(c), 6(c) for fault diameter 0.014 and 0.021 inches respectively. It can be clearly seen for the two cases of diameter the frequency of motor rotation and its harmonics and also other frequencies can be observed at 162.44 Hz, 160.18 Hz, 158.2 Hz and 156.36 Hz for the motor speeds 1797 RPM, 1772 RPM, 1750 RPM and 1730 RPM respectively which are equals the fault frequency at the inner ring calculated in Table 2, so it can be concluded that the defect has been detected at the inner ring.
Table 5Kurtosis values of measured vibration and reconstructed signal (defect diameter = 0.021 inches)
Kurtosis | |||||||
Signal | Inner race fault | Outer race fault | |||||
Rotational speed | Measured vibration | EMD-MED | Proposed method | Measured vibration | EMD-MED | Proposed method | |
1797 | 4.01 | 13.25 | 14.19 | 24.12 | 57.13 | 62.09 | |
1772 | 3.4 | 12.69 | 14.77 | 21.59 | 34.82 | 30.72 | |
1750 | 3.85 | 10.49 | 22.16 | 26.03 | 38.08 | 42.83 | |
1730 | 3.44 | 10.79 | 14.46 | 22.68 | 40.70 | 43.75 | |
Fig. 6The signals of bearing with inner race defect with diameter 0.021 inches: a) the measured signals, b) the reconstructed signal, c) the envelopes spectrum
a)
b)
c)
7.2. Case 2: bearing with outer race defect
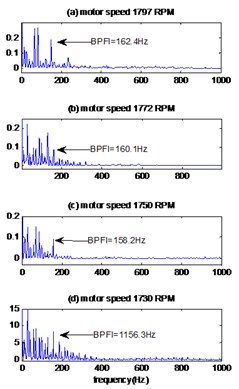
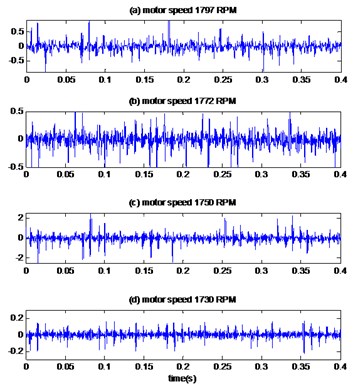
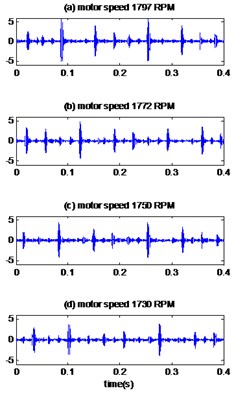
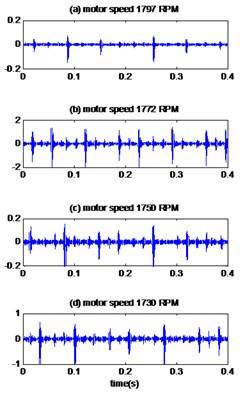
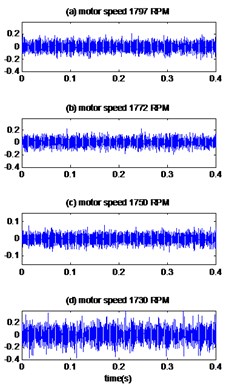
In the second case, the measured vibrations of the bearing with a defect diameter 0.007 inches located on the outer race are displayed in Fig. 7(a) and the first four IMFs obtained by the improved CEEMDAN decomposition are presented in Fig. 7(b-d and e) for the motor speeds 1797 RPM, 1772 RPM, 1750 RPM and 1730 RPM respectively. The curves in Fig. 7(f) represent the values of the correlation coefficient between the original signal and its IMFs for different motor speeds. The first tow IMFs have higher correlation coefficients, so they are selected as relevant modes. The results of applying the MED technique to the selected IMFs are shows in Fig. 8(a). The kurtosis values of the measured vibrations are 4.25, 4, 4.36 and 4.03 for the motor speeds 1797 RPM, 1772 RPM, 1750 RPM and 1730 RPM respectively, after application of the proposed method; the kurtosis values increased remarkably to 13.61, 11.47, 15.74 and 11.01 for the motor speeds 1797 RPM, 1772 RPM, 1750 RPM and 1730 RPM respectively. As see in Table 3, the proposed method gives the best results for enhancement of sensitivity of kurtosis and therefore better detection than EMD-MED.
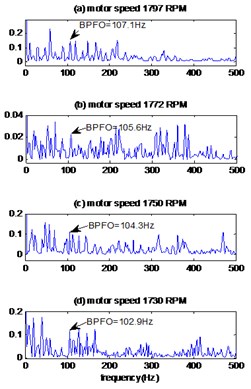
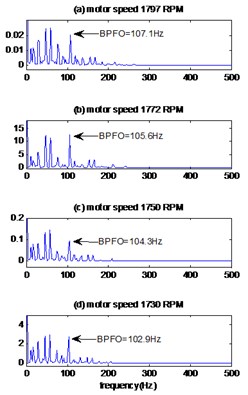
The envelope method (Fig 8(b)) distinguishes the harmonics at frequencies 107.10 Hz, 105.61 Hz, 104.30 Hz and 102.9 Hz for the motor speeds 1797 RPM, 1772 RPM, 1750 RPM and 1730 RPM respectively, these frequencies are similar to the calculated values of the outer race pass frequencies (Table 2); therefore, it can be judged that the fault is located at the outer race of bearing. For a comparison, the signal of bearing defect with diameter 0.007 inches and motor speed 1797 RPM is treated by EMD-MED method and the result is shown in Fig. 13. We can see more interfering noise component than the corresponding result obtained by the proposed method. This makes the proposed method better than EMD-MED method for the diagnosis of defects.
Fig. 7Signals of bearing with outer race defect with diameter 0.007 inches: a) the measured signal, b) IMFs signal with speed motor 1797, c) IMFs signal with speed motor 1772, d) IMFs signal with speed motor 1750, e) IMFs signal with speed motor 1730, f) The coefficient correlation between the signal original and its IMFs
a)
b)
c)
d)
e)
f)
For fault diameter 0.014 and 0.021 inches, the measured vibrations are showed in Fig. 9(a), 10(a) respectively and the result of the proposed method are plotted in Fig. 9(b), 10(b). As shown in Table 4, the kurtosis values of the vibratory signals of the bearing having a defect diameter of 0.014 inches are 3.13, 3.21, 3.04, and 3.19 for motor speeds 1797 RPM, 1772 RPM, 1750 RPM and 1730 RPM respectively, these values are increased by the EMD-MED method to 10.26, 9.95, 4.79 and 6.03 for motor speeds 1797 RPM, 1772 RPM, 1750 RPM and 1730 RPM. When we apply the proposed method the values of kurtosis become 10.31, 10.09, 7.94, and 10.10 for motor speeds 1797 RPM, 1772 RPM, 1750 RPM and 1730 RPM respectively. Therefore, it can be found the effect in kurtosis of the proposed method is obviously superior to the other method.
Similar observations for the signals of bearing with fault diameter 0.021 inches; the kurtosis increases to a remarkable degree when the proposed method is applied (Table 5) and gives better results than the EMD-MED method. The envelopes spectrum of obtained signals by proposed method are showed in Fig. 9(c), 10(c) for signals of fault diameter 0.014 and 0.021 inches respectively. We can be clearly detected in two case of fault diameter the frequencies 107.10 Hz, 105.61 Hz, 104.30 Hz and 102.9 Hz for the motor speeds 1797 RPM, 1772 RPM, 1750 RPM and 1730 RPM respectively, which are equal to the theoretical values of frequency of outer race fault calculated in Table 2. Therefore, we locate the defect on the outer ring.
Fig. 8The reconstruction signals by the proposed method of bearing with outer race defect with diameter 0.007 inches: a) time signals, b) envelopes spectrums
a)
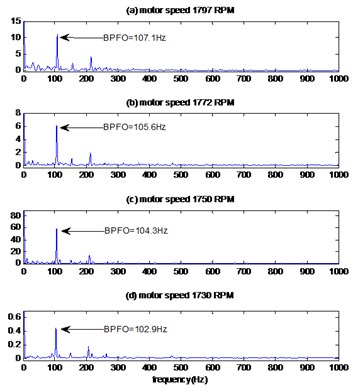
b)
Fig. 9The signals of bearing with outer race defect with diameter 0.014 inches: a) the measured signals, b) the reconstructed signal, c) the envelopes spectrum
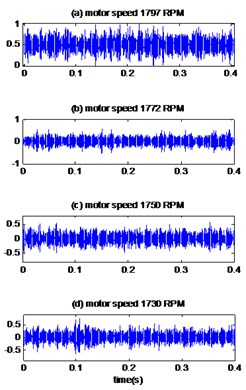
a)
b)
c)
7.3. Case 3: bearing with ball defect
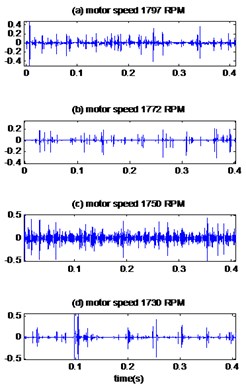
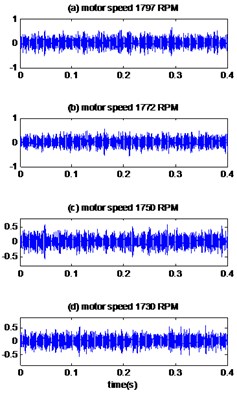
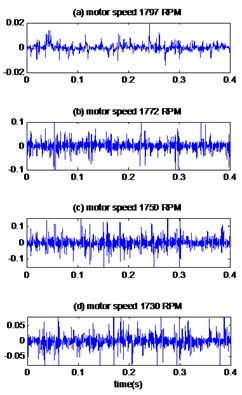
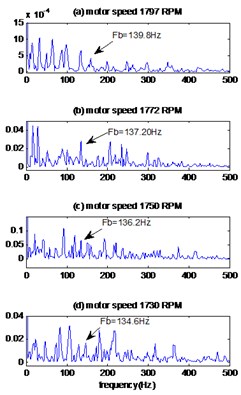
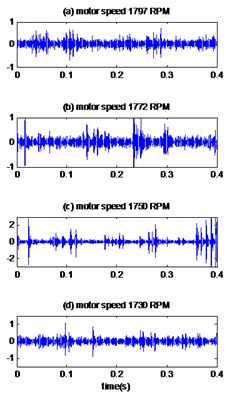
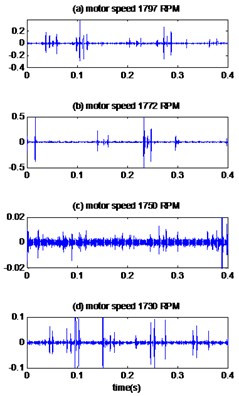
The measured signals are plotted in Fig. 11(a), 12(a) for different motor speeds and defects diameter 0.007, 0.014 inches respectively. The results obtained by the proposed method are displayed in Fig. 11(b), 12(b) for different defect diameter and the kurtosis values of measured signals, EMD-MED method and proposed method are presented in Table 6. We can see that there is a significant increase in kurtosis according to the proposed method than the EMD-MED method and consequently a better detection.
Fig. 10The signals of bearing with outer race defect with diameter 0.021 inches: a) the measured signals, b) the reconstructed signal, c) the envelopes spectrum
a)
b)
c)
Fig. 11The signals of bearing with ball defect with diameter 0.007 inches: a) the measured signals, b) the reconstructed signal, c) the envelopes spectrum
a)
b)
c)
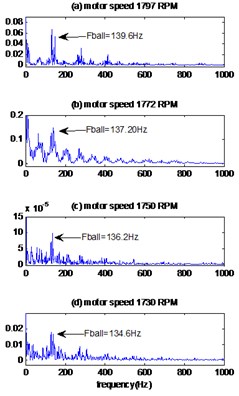
The envelopes spectrums of the signals obtained by the proposed method are shown in Fig. 11(c), 12(c) for different motor speeds and defect diameters. We note the existence of the frequencies 139.8 Hz, 137.9 Hz, 136.2 Hz, 134.6 Hz which are equal to the theoretical frequencies of ball defect calculated in the Table 2 and these mean that the defect is located at the ball of bearing. By comparing these results with those obtained by the EMD-MED method, we note that the peak of the fault frequency is unclear and with amplitude less than the proposed method.
Fig. 12The signals of bearing with ball defect with diameter 0.014inches: a) the measured signals, b) the reconstructed signal, c) the envelopes spectrum
a)
b)
c)
Table 6Kurtosis values of measured vibration and reconstructed signal of bearing with ball defect
Signal | Kurtosis | |||
Motor speed (RPM) | Diameter | Measured vibration | EMD-MED | Proposed method |
1797 | 0.007 | 3.12 | 5.17 | 12.73 |
0.014 | 5.67 | 17.47 | 20.19 | |
1772 | 0.007 | 3.0021 | 7.71 | 8.69 |
0.014 | 22.64 | 10.40 | 35.2 | |
1750 | 0.007 | 3.19 | 4.28 | 9.25 |
0.014 | 26.58 | 29.33 | 30.12 | |
1730 | 0.007 | 3.05 | 4.47 | 8.30 |
0.014 | 6.95 | 17.15 | 21.88 | |
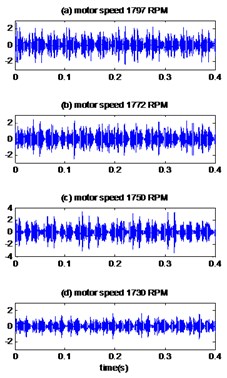
7.4. Case 4: healthy bearing
The measured vibration signals of healthy bearing are displayed in Fig. 14(a) for different motor speeds and the results of proposed method are showed in Fig. 14(b). As we see in Table 7, we notice that the kurtosis remains almost to the same value before and after the application of the proposed method which means there is no defect in the bearing.
Table 7Kurtosis values of measured vibration and reconstructed signal of healthy bearing
Signal | Kurtosis | |
Rotational speed | Measured vibration | Proposed method |
1797 | 2.76 | 3.08 |
1772 | 2.92 | 3.10 |
1750 | 2.90 | 3.12 |
1730 | 2.94 | 3.13 |
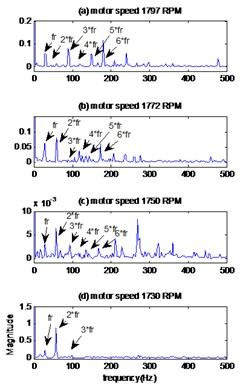
The envelopes spectrums clearly show (Fig. 14(c)) the rotation frequencies and its harmonics 29.9 Hz, 29.5 Hz, 29.1 Hz, 28.3 Hz for the motor speeds 1797 RPM, 1772 RPM, 1750 RPM and 1730 RPM respectively. We note that there is no other peak and therefore there is no fault in the bearing.
Fig. 13The reconstruction signals by EMD-MED method of bearing with defect diameter 0.007 inches and speed motor 1797 RPM: a) original signals, b) reconstructed signals, c) envelopes spectrums
a)
b)
c)
Fig. 14The reconstruction signals by the proposed method of healthy bearing: a) original signals, b) reconstructed signal, c) envelopes spectrums signals
a)
b)
c)
8. Conclusions
This paper presents a novel rolling bearing fault diagnosis method based on improved CEEMDAN combined with correlation coefficient and MED technique. The avoidance of the spurious modes and the reduction in the amount of noise contained in the modes are important features were improved by the novel version of CEEMDAN. The relevant modes are selected by estimation of coefficients correlation between the original signal and its IMFs obtained by improved CEEMDAN. Before to reconstruct the signal, MED technique is applied to selected modes to reduce the noise and improve the kurtosis value. The bearing fault at early stage of its development was detected by using the kurtosis analysis. The precise nature of the bearing fault was defined by the spectral analysis of envelope. The results indicated that the proposed method can effectively to extract the fault characteristics and enhance the precision of fault diagnosis of rolling bearing compared with other method.
References
-
Rabah Abdelkader, Ziane Derouiche, Abdelhafid Kaddour, Mourad Zergoug Rolling bearing faults diagnosis based on empirical mode decomposition: Optimized threshold de-noising method. IEEE International Conference on Modelling, Identification and Control (ICMIC), 2016, p. 186-191.
-
Issaoui Hadhami, Bouzid Aicha Speech signal enhancement using empirical mode decomposition and adaptive method based on the signal for noise ratio objective evaluation. International Review on Computers and Software (IRECOS), Vol. 9, Issue 8, 2014, p. 1461-1467.
-
Huang N., Shen Z., Long S., Wu M., Shih H., Zheng Q., Yen N., Tung C., Liu H. The Empirical mode decomposition and the Hilbert spectrum for nonlinear and non-stationary time series analysis. Proceedings of the Royal Society, Vol. 454, 1998, p. 903-995.
-
Jiang Fan, Zhu Zhencai, Li Wei, Zhou Gongbo, Chen Guoan Fault diagnosis of rotating machinery based on noise reduction using empirical mode decomposition and singular value decomposition. Journal of Vibroengineering, Vol. 17, Issue 1, 2015, p. 164-174.
-
Yaguo Lei, Jing Lin, Zhengjia He, Ming Zuo J. A review on empirical mode decomposition in fault diagnosis of rotating machinery. Mechanical Systems and Signal Processing, Vol. 35, 2013, p. 108-126.
-
Wu Z., Huang N. E. Ensemble empirical mode decomposition: a noise-assisted data analysis method. Advances in Adaptive Data Analysis, Vol. 1, Issue 1, 2009, https://doi.org/10.1142/S1793536909000047.
-
Jia-Rong Yeh, Jiann-Shing Shieh, Norden E.Huang Complementary ensemble empirical mode decomposition: a novel noise enhanced data analysis method. Advances in Adaptive Data Analysis, Vol. 2, Issue 2, 2010, https://doi.org/10.1142/S1793536910000422.
-
Colominas Marcelo A., Schlotthauer Gastón, Torres María E. Improved complete ensemble EMD: A suitable tool for biomedical signal processing. Biomedical Signal Processing and Control, Vol. 14, 2014, p. 19-29.
-
Torres M. E., Colominas M. A., Schlotthauer G., Flandrin P. A complete ensemble empirical mode decomposition with adaptive noise. IEEE International Conference on Acoustics, Speech and Signal Processing (ICASSP), Prague, Czech Republic, 2011, p. 4144-4147.
-
Elouaham S., Dliou A., Latif R., Laaboubi M. Filtering of biomedical signals by using complete ensemble empirical mode decomposition with adaptive noise. International Journal of Computer Application, Vol. 149, Issue 7, 2016, https://doi.org/10.5120/ijca2016911515.
-
Lei Y., He Z., Zi Y. application of the EEMD method to rotor fault diagnosis of rotating machinery. Mechanical Systems and Signal Processing, Vol. 23, Issue 4, 2009, p. 1327-1338.
-
Lei Yaguo, Liu Zongyao, Ouazri Julien, Lin Jing A fault diagnosis method of rolling element bearings based on CEEMDAN. Journal of Mechanical Engineering Science, Vol. 231, Issue 10, 2015, p. 1804-1815.
-
Imaouchen Y., Kedadouche M., Alkama R., Thomas M. A Frequency-Weighted Energy Operator and complementary ensemble empirical mode decomposition for bearing fault detection. Mechanical Systems and Signal Processing, Vol. 82, Issue 1, 2017, p. 103-116.
-
Xue Xiaoming, Zhou Jianzhong N., Xu Yanhe, Zhu Wenlong, Li Chaoshun An adaptively fast ensemble empirical mode decomposition method and its applications to rolling element bearing fault diagnosis. Mechanical Systems and Signal Processing, Vol. 62, Issue 63, 2015, p. 444-459.
-
Mahgoun Hafida, Bekka Rais Elhadi, Felkaoui Ahmed Gearbox fault detection using a new denoising method based on ensemble empirical mode decomposition and FFT. International Conference Surveillance, France, 2013.
-
Bao Guangqing, Chang Yong, He Ting An EMD threshold-based denoising method for bearing fault vibration signal analysis. Journal of Computational Information Systems, Vol. 10, Issue 17, 2014, p. 7645-7652.
-
Wiggins R. A. Minimum entropy deconvolution. Geoexploration, Vol. 16, 1978, p. 21-35.
-
Endo H., Randall R. Enhancement of autoregressive model based gear tooth fault detection technique by the use of minimum entropy deconvolution filter. Mechanical Systems and Signal Processing, Vol. 21, 2007, p. 906-919.
-
Sawalhi N., Randall R. B., Endo H. The enhancement of fault detection and diagnosis in rolling element bearings using minimum entropy deconvolution combined with spectral kurtosis. Mechanical Systems and Signal Processing, Vol. 21, 2007, p. 2616-2633.
-
Zhang Z., Entezami M., Stewart E., Roberts C. Enhanced fault diagnosis of roller bearing elements using a combination of empirical mode decomposition and minimum entropy deconvolution. Journal of Mechanical Engineering Science, Vol. 231, Issue 4, 2015, p. 655-671.
-
Ricci R., Borghesani P., Chatterton S., Pennacchi P. The combination of empirical mode decomposition and minimum entropy deconvolution for roller bearing diagnostics in non-stationary operation. 24th Conference on Mechanical Vibration and Noise, Parts A and B Chicago, Illinois, USA, 2012.
-
Kedadouche Mourad, Thomas Marc, Tahan Antoine Monitoring machines by using a hybrid method combining MED, EMD, and TKEO. Advances in Acoustics and Vibration, 2014, p. 592080.
-
Wei Guo, Tse Peter W., Djordjevich Alexandar Faulty bearing signal recovery from large noise using a hybrid method based on spectral kurtosis and ensemble empirical mode decomposition. Measurement, Vol. 45, 2012, p. 1308-1322.
-
Bearing Data Center – Case Western Reserve university. http://csegroups.case.edu /bearingdatacenter/pages/welcome-case-western-reserve-university-bearing-data-center-website
Cited by
About this article

