Abstract
The paper presents the problem of transport impact on the environment in terms of sustainable development. Technical and technological conditions of environmental impact assessment of transport was presented. In order to assess road transport in the context of environmental impact, the indicator of harmful exhaust gas emission levels was developed. Mathematical formulas describing criteria for the environmental impact assessment of transport were presented. In order to assess the impact of transport on the environment an/the EMITRANSYS model was developed.
1. Introduction
The growing number of vehicles and rapidly rising levels of pollution in the world require an increase in emission reduction requirements. The transport sector alone significantly contributes to environmental degradation and negatively impacts human health. The European Union generates almost 54 % of total nitrogen oxide emissions, 45 % carbon monoxide, 23 % non-methane volatile organic compounds, and 23 % PM10 and 28 % PM2.5 (particulate matter 10 and 2.5 μm respectively). The transport sector is also responsible for over 41 % of tropospheric ozone precursor emissions, 23 % CO2 emissions and almost 20 % of other greenhouse gases.
The driving factor for technological development in all areas of industry, especially the sustainable development of transport, is to reduce the negative impact on the environment. There is increasing awareness about the dangers of harmful emissions related to transport.
The negative transport impact on the environment refers to [1-6]:
– GHG emissions contributing to climate change,
– emission of air pollutants affecting human health and the natural environment,
– developing valuable natural areas and fragmenting them with newly constructed technical infrastructure which contributes to the loss of biodiversity,
– generating noise detrimental to human health.
2. Technical and technological conditions of environmental impact assessment of transport
For the sake of clarity, it is assumed that each transport relation of the MEST transport network is characterized by a specific transport demand denoted by . Due to the subject and scope of the study, the traffic organization determines the decision variables which are interpreted as the number of the th type vehicles completing the th path in the relation .
Given the type of transport, these variables can be written in two ways:
– , elements of this matrix are interpreted as the number of th type vehicles on the th path in relation , which carry passengers,
– , elements of this matrix are interpreted as the number of th type vehicles on the th path in relation , which carry cargo,
The model takes into account additional variables, such as which represents the number of th type vehicles in the relation that meet the -emission standard and are equipped with the th type motor.
In order to calculate the number of vehicles, it is assumed that the maximum capacities of the transport means are known, which are dependent on maximal payload , capacity and parameters of transported cargo characteristic for given demand segments i.e. . Additionally, considering the average maximum capacity utilization indicators of the transport means , flow of people and cargo loaded into the individual elements of the transport system structure and are converted into in the model as follows:
Taking into account the additive state of traffic, the traffic flow for each transport connection marked with the symbol is expressed as follows:
where is the set of route numbers in the transport relation that passes through the th section of the transport network.
Furthermore, the model includes the dependence of harmful emissions on the distance of transport (the shortest trips generate the largest emissions), which is expressed below:
where: – total emissions of the th harmful exhaust gas component by the th transport subsystem (kg), – the number of th type of vehicles on the th path in relation , which are equipped with th type motor and meet , the emission standard, – the length of the transport network section (km), – speed of traffic flow on the transport network section (km/h), – unit emission level of th harmful exhaust compound identified for an th type vehicle equipped with an th motor type that meets the th emission standards, and moves on the section of the transport network in mg/s/veh. , – an indicator of the transport route length effect on the unit emissions level.
3. The assessment criteria for the environmental impact of transport with regard to transport work
Considering the permissible transport impact standards on people and the environment, it is necessary to compare transport system options with regard to the probability and scale of exceeding emission limits [3, 7]. In this case, probability indicators for admissible emissions of individual exhaust gas components were formulated. A sample indicator is written as follows:
where: – the maximum emissions of the th harmful exhaust component in %, – the total emission of the th harmful exhaust component by the th transport subsystem at the transport network section (kg), – the total emission of the th harmful exhaust component along the th transport network section (kg), – the permissible emission standard of the th harmful exhaust component determined for th transport network section (kg).
The total emission is determined as follows:
The relationship criterion between the costs incurred by society, for example the treatment of diseases and efforts to save the environment from damage caused by air pollution, and the expenses associated with improving the environmental performance of the transport system is an important indicator. The criteria pertaining to economic relationships between these values are written as:
where: – financial surplus obtained through investment in an environmentally-friendly transport system in PLN, – profitability of investment in an environmentally friendly transport system, – resulting from the investment in a transport system which reduces the external costs of air pollution by , the harmful component of emissions produced by vehicles (PLN), – expenditures on changes focused on improving environmental performance of the th type of transport within the th transport subsystem in PLN.
Taking into account the above, the task of optimizing the traffic distribution on the national transport network in MEST will rely on finding matrix values for which the effectiveness evaluation criterion of the system function, the interpretation criterion of emission levels produced by a means of transport carrying out transport tasks in a selected area of the network, written by the Eq. (3), or the function of transport cost interpretation, written by the formula:
will have reached the minimum value.
4. A case study of transport impact on the environment using real data
4.1. EMITRANSYS as a tool for shaping sustainable development
In the conducted EMITRANSYS model simulations in PTV VISUM, the means of passenger transport have been separated into the following kinds: mopeds and motorbikes, passenger cars, minibuses with 6 to 9 seats, buses with 10-15 seats, buses with 16 to 45 seats and buses with over 45 seats. Heavy cargo vehicles have been divided into two categories, the first used to transport loads ranging from light vehicles with MAW up to 3,5 t and the second with high-ton trucks with MAW up to 24 t. The use of the PTV VISUM simulation tool allowed for the determination of the load on a given section of road network, which, in turn, made it possible to assess the level of pollutant emissions produced on a given road section.
4.2. The influence of vehicle structure on the emission level over selected transport routes
In order assess vehicle structure influence on the emission level for selected transport routes, the following tests were carried out for the Warsaw – Łódź train connection. In this study, it was assumed that only the demand for interregional transport services of railway connections would be analyzed and not all journeys would take place daily. Hence, it was assumed that the passenger flow of the analyzed communication route for the year 2015 would be:
– the Warsaw – Łódź connection: 4000 passengers per day,
– the Warsaw – Skierniewice connection: 5500 passengers per day,
– the Warsaw – Żyrardów connection: 8500 passengers per day.
As an quality assessment factor of the solution, the total amount of external costs resulting from the implementation of daily transport tasks and related air pollution were minimized.
The distribution of passenger flows in all analyzed connections for the year 2015 and 2025 are shown in Fig. 1. The volume of emission in 2015 and 2025 are shown in Fig. 2.
Fig. 1Distribution of passenger flows in a) 2015, b) 2025 (source: the EMITRANSYS model)
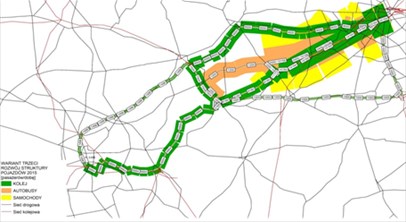
a)
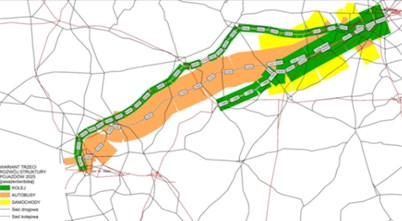
b)
Fig. 2The volume of emission in a) 2015, b) 2025 (source: the EMITRANSYS model)
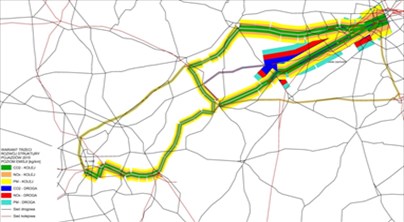
a)
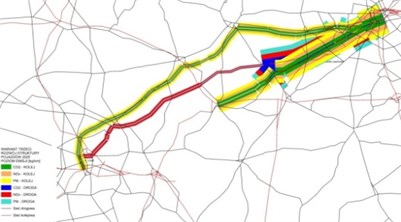
b)
In the case of nitrogen oxides, a large increase of 32 % was observed for the Warsaw – Łódź railway connection, while a smaller increase of 3 % was noted for the Warsaw – Żyrardów bus connection. It should also be noted that there is an emission reduction of 1 % on the bus connection Warsaw – Skierniewice. In the case of particulate matter, there was a large increase in the Warsaw – Łódź railway connection and a 30 % increase in the Warsaw – Skierniewice and Warsaw – Żyrardów bus connection.
5. Conclusions
Developing an eco-friendly transport system serves to reduce the harmful effects on the environment caused by the transport sector. An increasing amount of countries have come to understand the detrimental effects of emissions produced by the development of motorization.
Despite the measures taken to reduce emissions through the use of innovative technologies, such as the installation of catalytic converters, fuel consumption reduction, etc., emissions still remain a significant problem. Therefore, when planning the development of a transport system, the total cost of transport activities, including the costs of environmental degradation, should be considered. This means that transport costs should also include, for example, the cost of transport emissions. The research carried out in the EMITRANSYS project allowed for the assessment of the impact of road transport vehicle emissions on environmental pollution.
References
-
Ambroziak T., Jachimowski R., Pyza D., Szczepański E. Analysis of the traffic stream distribution in terms of identification of areas with the highest exhaust pollution. Archives of Transport, Vol. 4, Issue 32, 2014, p. 7-16.
-
Jacyna M., Lewczuk K., Szczepański E., Gołębiowski P., Jachimowski R., Kłodawski M., Pyza D., Sivets O., Wasiak M., Zak J., Jacyna Golda I. Effectiveness of national transport system according to costs of emission of pollutants. Safety and Reliability: Methodology and Applications, 2015, p. 559-567.
-
Jacyna Golda I., Żak J., Gołębiowski P. Models of traffic flow distribution for various scenarios of the development of proecological transport system. Archives of Transport, Vol. 32, Issue 4, 2014, p. 17-28.
-
Merkisz J., Pielecha J. The on-road exhaust emissions characteristics of SUV vehicles fitted with diesel engines. Combustion Engines, Vol. 50, Issue 2, 2011, p. 58-72.
-
Merkisz J., Pielecha J., Radzimirski S. New Trends in Emission Control in the European Union. Springer Tracts on Transportation and Traffic, 2014.
-
Chamier Gliszczyński N., Bohdal T. Urban Mobility Assessment Indicators in the Perspective of the Environment Protection. Rocznik Ochrona Środowiska/Annual set, The Environment Protection, Vol. 18, 2016, p. 670-681.
-
Jacyna M., Wasiak M., Lewczuk K., Kłodawski M. Simulation model of transport system of Poland as a tool for developing sustainable transport. Archives of Transport, Vol. 31, Issue 3, 2014, p. 23-35.
About this article

