Abstract
The article presents selected results of evaluation of the harmfulness of buildings vibrations and influence on humans in buildings caused by railway traffic. The results presented in the paper were part of larger group of in field test which gather, were the basis of creation the zones of influence of railway vibrations. The paper presents the methodology of field test as well as some selected results. The discussion of the results leads to conclusions which are presented, as mentioned above, zones of influence of railway vibrations on building construction as well as on human in the buildings. The proposed zones are different for cargo and passenger trains. The ranges of zones are also different in case of building structure and human perception. All analyzes are compatible with polish codes PN-B-02170:2016 [1] and PN-B-02171:2017 [2] and executed by accredited laboratory with significant participation of the authors. The proposed zones were assumed by manager of the national railway network PKP PLK S.A.
1. Introduction
Actual polish codes [1, 2], instructions and law acts [3-9], contain information referring to influence of vibrations pointing that there is an obligation to design structures near railways and roads including the dynamics effects. The dynamic effects should be included in two main aspects: influence on building structures and influence on human body [1, 2, 10, 11]. Polish codes [1, 2] use two main parameters to describe influence on structure and human body. These parameters are the building vibration perceptivity ratio (WODB) and the human vibration perceptivity ratio (WODL), and they state the limit borders of the vibrations. The WODL ratio (in English, the human vibration perceptivity ratio), proposed in [10], is the measure of vibration perception by people. It is the maximum ratio of the acceleration RMS value obtained from the analysis to the acceleration RMS value equivalent to the threshold for the perception of vibration by humans (in the same 1/3 octave band) chosen from each 1/3 octave band. The WODB ratio (in English, the building vibration perceptivity ratio), also proposed in [10], is the measure of vibration perception by building structure. It is the maximum ratio of the peak value of acceleration obtained from the analysis to the acceleration value equivalent to the threshold for the perception of vibration by building (in the same 1/3 octave band) chosen from each 1/3 octave band. The article shows importance of including dynamic effects at the beginning of the design process, by presenting and analyzing the serious of in-situ tests.
2. Research fields
The article presents two selected locations where the in-situ tests were done. First building is a single family residential house located in Warsaw near one of the main railway line. The second one building is two stories building. The house consists of main part and a garage connected with it. The walls are made of cellular concrete with thickness of 24 cm. According to the design project, the slab over the ground floor is made of reinforced concrete, with thickness of 14 cm. The construction of roof is made of wooden rafters. The interior walls and ceilings are covered by plasterboards, so there was no possibility to check the construction elements condition. In plane, the building is like the rectangular with sides 9.3 m by 10.95 m. The height of the building in ridge is 8.0 m. The building is offset from the railway line by 32.5 m (see Fig. 1). The general view of analyzed building is presented on Fig. 2. The building is situated with ridge perpendicular to the railway line. The vibrations in the building are caused by trains moving on railway lines number 9 and 456. These lines have traditional track structure with rails connected to prestressed concrete sleepers spread on a ballast. Track structure allows to achieve a speed of 160 km/h for passenger trains and 120 km/h for cargo trains.
Fig. 1Location of field tests No. 1
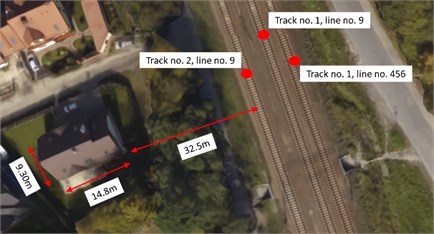
Fig. 2The examined single-family house – general view of the structure
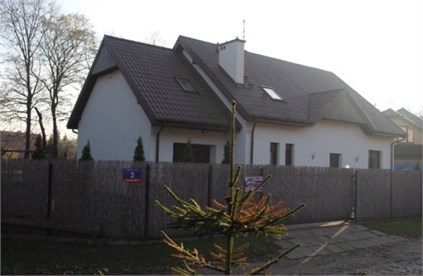
Fig. 3Location of field tests No. 2
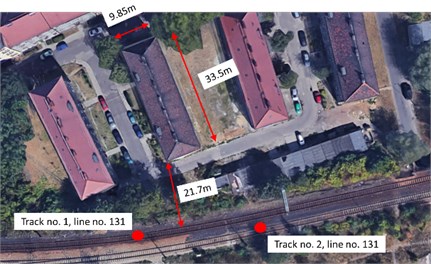
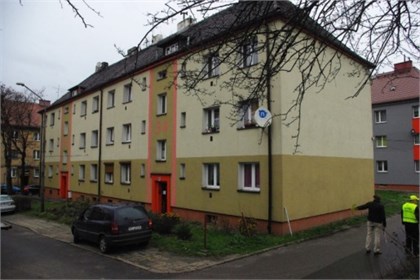
The second location of field tests was in Bytom (Poland). The analyzed building is a multi-family house. Three-story building with basement is made of masonry walls with masonry vaults on steel beams over the basement and wooden beams over the rest floors. The building is 9.85 m wide and 33.5 m long. The height is 14.5 m. The roof structure is wooden. The distance from the railway line to the nearest corner of the building is 21.7 m. It’s situated with ridge perpendicular to the railway line (see Fig. 3). The building is classified to SWD-II scale according to [1]. The general view of the building is presented in Fig. 4. The vibrations in the building are caused by trains moving on railway lines number 9 and 456 (see Fig. 3). These lines have traditional track structure with rails connected to wooden sleepers spread on a ballast. Track structure allows achieving a speed of 100 km/h for passenger and cargo trains. Due to numerous damage to the railway surface, the speed has been reduced. This line is mostly used by cargo trains.
Fig. 4The examined multi-family house – general view of the structure
3. Research methods
In location no. 1 and no. 2, the study included measurements of accelerations in control points of the analyzed buildings. Control points were assumed according to polish codes [1, 2]. They were located at the place of human vibration reception. In all cases in each point accelerations were measured in three orthogonal directions. In both location measurements lasted 24 hours. Due to the heavy load of the line, several hundred measurements were recorded in Warsaw. Almost one hundred measurements were recorded in Bytom. Records from location no. 1 and no. 2 were then analyzed according to [1, 2], to set the influence on buildings structures and human reception. Fig. 5 presents selected measuring points in building.
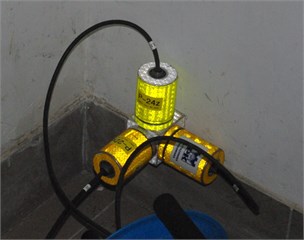
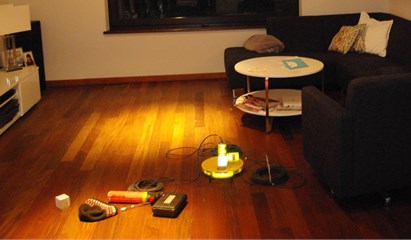
Fig. 5Control points with sensors used in the measurements a) influence on building, b) influence on human
a)
b)
Fig. 5(a) shows piezoelectric accelerometers mounted on the foundation wall in the corner of the building. Acceleration records from these points (in three orthogonal directions) are used to estimate the influence of vibrations on the building construction according to [1]. Accelerometers used to estimate the human vibration perceptivity ratio, are presented in Fig. 5(b). The points are located on the floor at the place where vibrations of the floor are the greatest (mostly at the centre of the floor slab). In presented locations accelerometers were also located on the ground starting from the railway track to the distance of 50 m from the railway track. The measuring points were set every 5 m. In all cases in parallel with acceleration records, speed of trains and type of trains were noted.
4. Results, discussion and final conclusions
Analysis of received results show that in Warsaw as well as in Bytom, the building vibration perceptivity ratio (WODB) did not reach the critical value (WODB < 1). It means, that in case of all analyzed vibrations, none of them was perceptible by building construction. Tables 1 and Table 2 show selected measurements of different types of trains with significant value of WODB respectively from location no. 1 and no. 2. The tables also present the value of central frequency of 1/3 octave filter band.
Table 1Selected measurement results of the building vibration perceptivity ratio from location No. 1
Description Time – type of train – track no. and line number – speed | WODB [–] | Central frequency of 1/3 octave band [Hz] |
19:15 - passenger train – track no. 2 LK 9 - 110 km/h | 0,623 | 8 |
21:45 - passenger train - track no. 1 LK 9 - 80 km/h | 0,468 | 12,5 |
21:56 – passenger train – track no. 1 LK 9 – 110 km/h | 0,107 | 12,5 |
22:07 – technical train– track no. 2 LK 9 – 56 km/h | 0,165 | 8 |
23:50 – locomotive – track no. 1 LK 9 – 80 km/h | 0,161 | 8 |
4:14 – trolley – track no. 2 LK 9 – 75 km/h | 0,045 | 8 |
7:11 – cargo train – track no. 1 LK 9 – 60 km/h + passenger train – track no. 2 LK 9 – 120 km/h | 0,720 | 8 |
7:40 – passenger train – track no. 1 LK 9 – 110 km/h | 0,223 | 16 |
8:45 – locomotive – track no. 1 LK 9 – 85 km/h | 0,190 | 10 |
10:17 – passenger train – track no. 2 LK 9 – 160 km/h | 0,240 | 16 |
14:58 – passenger train – track no. 2 LK 9 – 145 km/h | 0,210 | 12,5 |
16:10 – locomotive – track no. 1 LK 9 – 87 km/h | 0,353 | 8 |
16:24 – passenger train – track no. 3 LK 456 – 112 km/h | 0,164 | 10 |
Table 2Selected measurement results of the building vibration perceptivity ratio from location No. 2
Description Time – type of train – track no. and line number – speed | WODB [–] | Central frequency of 1/3 octave band [Hz] |
12:13 – trolley – track no. 2 – 40 km/h | 0,204 | 10 |
15:02 – locomotive – track no. 1 – 30 km/h | 0,197 | 12,5 |
15:38 – passenger train – track no. 1 – 31 km/h – 3 wag | 0,365 | 10 |
23:17 – cargo train – track no. 1 – 20 km/h – 30 wag | 0,349 | 10 |
00:07 – technical train – track no. 2 – 35 km/h | 0,211 | 12,5 |
08:05 – passenger train – track no. 1 – 24 km/h | 0,212 | 12,5 |
Calculated RMS values of acceleration in 1/3 octave band from recorded in time domain signals show exceeding of human comfort according to polish code [2]. In the first location 14 from recorded 223 train rides exceed critical value of the human vibration perceptivity ratio (WODL). This refers mainly to cargo trains. Tables 3 and 4 show selected measurements of different types of trains with significant value of WODL respectively from location 1 and 2. The tables also present the value of central frequency of 1/3 octave band. In the second location 57 from recorded 66 train rides exceed critical value of the human vibration perceptivity ratio (WODL). The large number of records with WODL greater than 1 is caused mainly by cargo trains while large values of WODL mainly result from construction of the wooden ceiling which is much more flexible to such influence than concrete slab from first location.
Analysis of above results in combination with others from large base of records collected by Institute of Structural Mechanics allows to proposing zones of influence. The table 5 shows proposed zones. Ranges of zones are different for cargo trains and passenger trains. et of boundaries for zone I (Ia and Ib) refer to the vibration influence on buildings, while set of boundaries for zone II (IIa and IIb) concerns the vibration influence on human. The analysis of the results clearly indicates that the train type and its technical condition significantly affect the generated vibrations.
Table 3Selected measurement results of the human vibration perceptivity ratio from location No. 1
Description Time – type of train – track no. and line number – speed | WODL [–] | Central frequency of 1/3 octave band [Hz] |
17:04 – cargo train – track no. 2 LK 9 – 80 km/h | 2,779 | 8 |
19:15 – passenger train – track no. 2 LK 9 – 110 km/h | 2,263 | 8 |
21:45 – passenger train – track no. 1 LK 9 – 80 km/h | 1,714 | 8 |
21:56 – passenger train – track no. 1 LK 9 – 110 km/h | 0,251 | 10 |
22:07 – technical train – track no. 2 LK 9 – 56 km/h | 0,380 | 8 |
23:50 – locomotive – track no. 1 LK 9 – 80 km/h | 0,279 | 8 |
4:14 – trolley – track no. 2 LK 9 – 75 km/h | 0,099 | 8 |
8:45 – locomotive – track no. 1 LK 9 – 85 km/h | 0,559 | 20 |
10:17 – passenger train – track no. 2 LK 9 – 160 km/h | 0,528 | 16 |
11:11 – passenger train – track no. 2 LK 9 – 156 km/h | 0,804 | 12,5 |
16:10 – locomotive – track no. 1 LK 9 – 87 km/h | 1,036 | 8 |
16:24 – passenger train – track no. 1 LK 456 – 112 km/h | 0,322 | 8 |
16:30 – passenger train – track no. 2 LK 9 – 157 km/h | 0,730 | 20 |
Table 4Selected measurement results of the human vibration perceptivity ratio from location No. 2
Description Time – type of train – track no. and line number – speed | WODL [–] | Central frequency of 1/3 octave band [Hz] |
11:58 – passenger train – track no. 1 – 25 km/h | 4,236 | 20 |
15:02 – locomotive – track no. 1 – 30 km/h | 10,199 | 16 |
15:41 – passenger train – track no. 2 – 30 km/h | 4,307 | 16 |
15:50 – trolley – track no. 1 – 25 km/h | 1,836 | 12,5 |
00:07 – technical train – track no. 2 – 35 km/h | 4,054 | 12,5 |
01:45 – cargo train – track no. 1 – 24 km/h – 18 wag | 6,119 | 16 |
Table 5Zones of influence on buildings and humans
Train type | The distances of the building from the external track of the railway line | |
Influence on buildings | Influence on human body | |
Passenger trains | 0 – 35 m (zone Ia) | 0 – 65 m (zone IIa) |
Cargo and mixed trains | 0 – 45 m (zone Ib) | 0 – 80 m (zone IIb) |
References
-
Evaluation of the Harmfulness of Buildings Vibrations Due to Ground Motion. PN-B-02170, 2016, (in Polish).
-
Evaluation of Vibrations Influence on Humans in Buildings. PN-B-02171, 2017, (in Polish).
-
Ordinance of the Minister of Economy and Labor of 5 August 2005 on Occupational Safety and Health in Work Involving Noise Exposure or Mechanical Vibration, (in Polish).
-
Ordinance of the Minister of Infrastructure of 12 April 2002r. on the Technical Conditions to Be Met by Buildings and Their Location, (in Polish).
-
Act of 23 March 2003r. about Rail Transport, (in Polish).
-
Law Environmental Protection Law of April 27, 2001, (in Polish).
-
Law on Access to Environmental Information and its Protection and on Environmental Impact Assessment of 9 November 2000, (in Polish).
-
Act on the Prevention of Damage to the Environment and Their Repair of 13 April 2007, (in Polish).
-
The Building Law of 7 July 1994, (in Polish).
-
Kawecki J., Stypuła K. Providing Vibration Comfort to People in Buildings Exposed to Traffic. Publishing House of Cracow University of Technology, Cracow, 2013, (in Polish).
-
Stypuła K. Vibrations generated in the ground by rail transport and their impact on buildings and people in buildings. 24th Nationwide Workshops Workshop Designer Works, Wisla, 2009, p. 395-420, (in Polish).
Cited by
About this article

