Abstract
Modeling of hydrodynamic processes in case of waterflooding taking into account capillary numbers is carried out. Numerical results are obtained for formations with different permeability: homogeneous permeability, inhomogeneous with correlated and uncorrelated permeability distributions.
1. Introduction
Phenomena related to the capillary number were studied by modeling the hydrodynamic processes [11, 12] of field development. The results are presented for a quarter of a five-point waterflood pattern of a uniform permeability formation and several inhomogeneous layers for both correlated and uncorrelated permeability distributions with one injection and one producing well. In Table 1 shows reservoir and grid properties the same for all cases.
The total number of mesh blocks was 19 881 (141×141×1). Due to the influence of grid orientation, the model was rotated on 45° with 9 941 active blocks. The length of the grid unit in the direction of the axes and was equal to 2.012 m, so the total length in each direction was 201.2 m, as a result of which the whole formation system covered an area of 0.647 km2. In the work, setting the flow rate in the borehole block, the value of the capillary number changed to investigate its effect on the selection results.
Table 1Data used in modeling
Formation dimensions, | 141×141×1 |
Number of active blocks | 9 941 |
Length of the grid unit, | 2.012 m |
Width of the grid unit, | 2.012 m |
Height of the grid unit, | 3.048 m |
Porosity, | 0.3 |
Average permeability, | 3.257·10-8 mkm2 |
Surface tension, | 25·10-3 Pa·m |
Viscosity of water, | 0.001 Pa·s |
Viscosity of oil, | 0.001 Pa·s |
Density of water, | 1000 kg/m3 |
Density of oil, | 1000 kg/m3 |
Initial saturation with water, | 0.25 |
Initial saturation with oil, | 0.75 |
Number of traceable streamlines, | 3000 |
2. Simulation of a homogeneous medium
2.1. Simulations at different capillary numbers
Modeling of the quarter five-point scheme flooding homogeneous layer was carried out at five different capillary numbers [1-4]. The capillary number in oil the block was changed in a range from 2·10-7 to 2·10-2. In Fig. 1a-d shows the maps of capillary numbers based on their values in the downhole unit for the same pumped volume of the pore (). Borehole at small capillary numbers ( 2·10-7) in all models used curves the relative permeability of the first zone. Therefore, the simulator considers only one function of saturation for modeling a distribution as shown in Fig. 1(e).
When the value of the downhole capillary number is increased to 2·10-5 the region of the reservoir near the injection and production wells at the permeability falls in the second zone as shown in Fig. 1(f). In the figure the shaded areas correspond to the relative permeability curves in the second zone, and light – curve are respectively the relative permeability in the first zone. A further increase of the downhole capillary number to 2·10-2 leads to the fact that the main part of the reservoir lies in the second zone, while its angular region in the first area, as shown in Fig. 1(g). Thus, from Fig. 1(f) and 1(h), it follows that under certain capillary numbers for a homogeneous medium it is possible to apply the method of accounting for the phenomena associated with capillary number, with the appropriate allocation of land to breed near the wells from the main reservoir system. However, the size of this precinct may vary depending on the modes of the wells. This approach is not acceptable for these values of capillary numbers as in Fig. 1(e) and 1(g).
Fig. 1Simulation of a homogeneous medium under different downhole capillary numbers
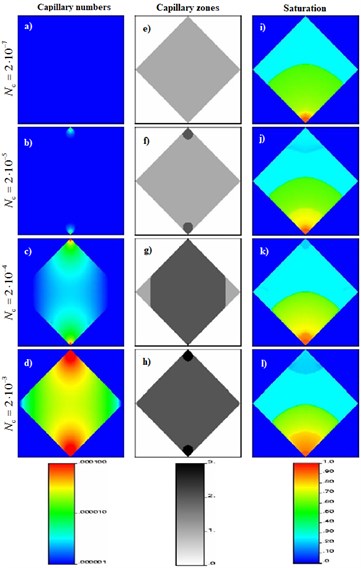
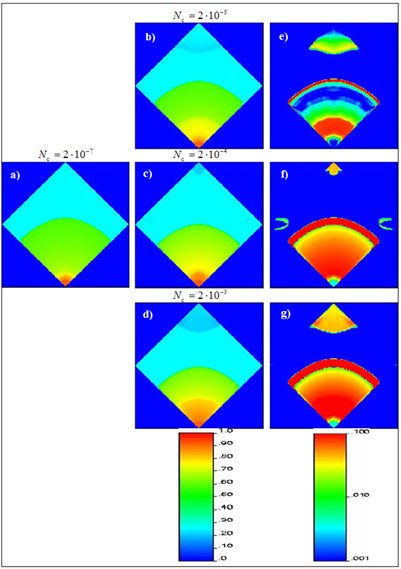
Fig. 2The difference between the colorfulness relative to the base case (borehole Nc= 2⋅10-7)
In Fig. 1(i-l) show the distribution of weights for different downhole capillary numbers at a predetermined pumped volume of the pore (). From Fig. 1l shows that the saturation of water in close proximity to productive wells below the initial saturation of the aqueous phase in contrast to the situation in Fig. 1(i). This involves using the relative permeability curves in the third zone, for which saturation of the residual water below the global initial saturation of the aqueous phase. The appeared moving water about the production well is moving it together with the oil. Similarly, a high water saturation near injection well is the result of the reduction in residual oil saturation when using relative permeability curves in the third zone.
2.2. Differences in the distribution of weights
In Fig. 2(a-d) illustrates the distribution of weights for different values of capillary number ( 2·10-7÷2·10-3) for a homogeneous permittivity of the medium. Since modeling in 2·10-7correspond to small capillary numbers, this case was taken as the base, with which are compared all other options with larger value than 2·10-7, the capillary numbers. By comparing Fig. 2(a) (base case) Fig. 2(b-d), set the slow fronts of saturation. For clarity, the distribution of the weights displayed in Fig. 2(a) was subtracted from the distributions in Fig. 2(b-d) to determine the absolute difference in the weights. A similar map of differences is shown in Fig. 2(e-g) at 2·10-7÷2·10-3. Therefore, errors in selection of values of the capillary number can lead to the wrong prediction in the distribution of fluids.
2.3. Curves selection and watering
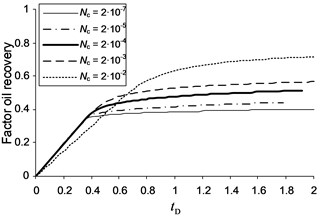
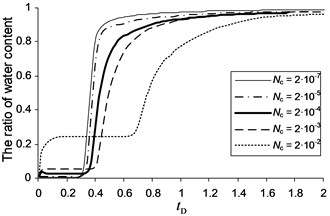
The curves of total production and the water content for homogeneous simulation environment under various downhole capillary numbers is shown in Fig. 3. From Fig. 3(a) is a noticeable increase in the volume of crude oil with increasing capillary numbers. In the specified initial and final saturation values in areas with large capillary number there is mobile water, which is taken as soon as I started the process of extraction, as can be seen in Fig. 3(b). Moreover, a breakthrough of water to flow at high capillary numbers is delayed because possible displacement of additional oil volume due to changes in the relative permeability functions.
Fig. 3Oil recovery and average water content for the homogeneous medium at different borehole Nc
a)
b)
Analyzing Fig. 3a, for 2·10-2 front flooding is smoother than curves, for which 2·10-7 and 2·10-5. This is not due to numerical dispersion, and the fact that in different zones of injection and production wells have a high initial saturation of mobile water. This mobile water phase is extracted from areas belonging to the third and second zones, located in front of a productive well. In addition, a large shaft and movable water in water flooding also begins to move toward the production well in the form of waves. All these reasons lead to increased flooding of productive wells. In Fig. 3(b) shows that the profile of water content for 2·10-5 undergoes a small jump at low . This is due to initially capture the moving water near the production well because it is in the second zone. It is interesting to note that the average water content starts to decrease immediately after the break. The reason for this is the depletion of water around the well. To summarize, note that the graphs of the saturation curves increased oil recovery from homogeneous layer showed the need for accounting for the phenomena associated with capillary number at the scale of the whole deposit.
3. Modeling heterogeneous environment, with uncorrelated distribution of permeabilities
Truly homogeneous reservoirs are rare in nature. This section presents the results of simulations that were conducted for an inhomogeneous medium with uncorrelated distribution of permeability and medium permeability value equal to that used in the simulation of a homogeneous medium [5; 6-8]. In Fig. 4 shows a histogram on the basis of which was created by the uncorrelated heterogeneous permeability field, shown in Fig. 5.
3.1. Simulations at different capillary numbers
Fig. 6(a-d) shows capillary number that occurs in uncorrelated heterogeneous environment with varying downhole capillary numbers (from 2·10-7 to 2·10-3). For clarity, all of the capillary number 10-6 combined into a single number, 10-6, and 10-4 all numbers – in one number 10-4. These drawings show the channels with high flow rates, which appear in the inhomogeneous model. The maps of capillary numbers set the location of various "fields of rock", as seen in Fig. 6(e-h) for downhole capillary numbers 2·10-7, 2·10-5, 2·10-4 and 2·10-3, respectively. In Fig. 6(i-l) shows the distribution of weights in the same time (pumped pore volume).
Fig. 4A representative histogram for various inhomogeneous media
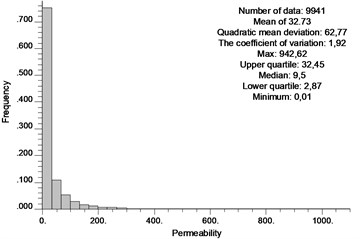
Fig. 5Heterogeneous permeability medium (uncorrelated)
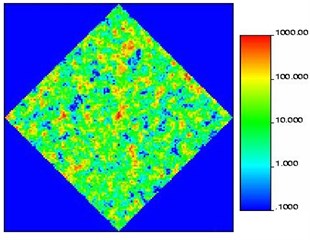
Fig. 6Modeling heterogeneous uncorrelated medium at different downhole capillary numbers
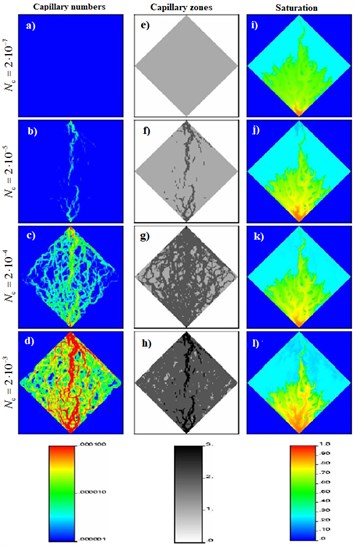
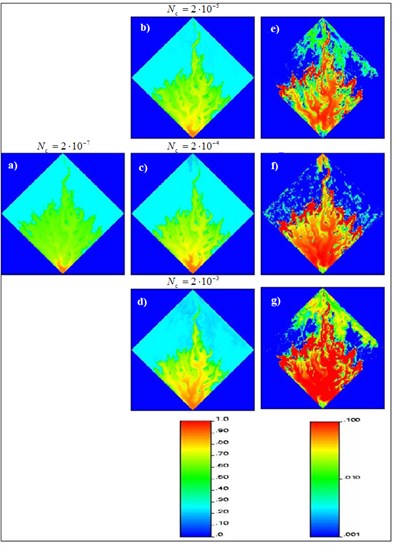
Fig. 7The difference between the colorfulness relative to the base case (wells Nc= 2·10-7)
Due to inhomogeneities channels with high permeability, which moves the bulk of the fluid. This leads to the appearance along these channels the large value of the capillary numbers in comparison with other parts of the model. Comparison of these results (Fig. 6(e-h)) simulation results of a homogeneous medium (Fig. 1(e-h)) shows that the zone of large capillary numbers can occur within the entire model, not only near the wells. This may be an important factor in the development of many strategies of field development, as similar to meandering channels with a high flow rate is not only a region, which previously covered all of the displacing fluid, but also those who have low saturation with oil is associated with the effects of capillary number. Accurate prediction of such channels and the subsequent allocation of separate areas of rocks difficult to achieve in conventional simulators. The methodology proposed in this work allows to directly determine the channels with high flow rates and assign them to the corresponding functions of the saturation. Fig. 6 exhibit zones, corresponding to different capillary numbers for an inhomogeneous medium with variable boundary conditions.
3.2. Differences in the distribution of weights
In order to show the importance of phenomena associated with capillary number, we compared the maps of saturation at different borehole . In Fig. 7(a-d) presents the map of weights for downhole capillary numbers 2·10-7, 2·10-5, 2·10-4, and 2·10-3 at the time 0.163. The saturation in Fig. 7(a) was subtracted from each of the Fig. 7(b-d) to obtain the absolute differences in the weights, which are shown in Fig. 7(e-h). The figures show an increase in absolute differences of intensity with increasing downhole capillary number. Thus, the neglect of the phenomena associated with capillary number can lead to significant over or underestimation of the saturation in certain areas of the reservoir. It should be noted that the absolute difference of saturation, which are more than 0.10, are shown as one group of 0.10.
3.3. Curves selection and watering
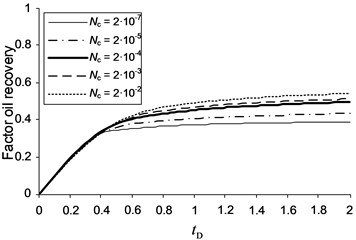
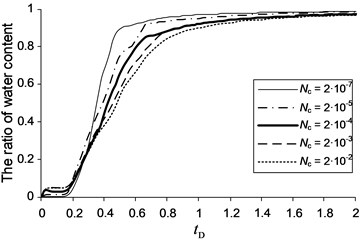
The curves of cumulative oil recovery and water cut corresponding to the simulation conditions shown in Fig. 8. Fig. 8(a) shows an increasing selection for higher capillary numbers, whereas Fig. 8(b) shows a delay in breakthrough, with increasing residual oil saturation. It should be noted that these results are very similar to the results given in Fig. 3. So, in Fig. 3(a), there is a high degree of scatter among the curves than for the case in Fig. 8(a). When the capillary number equal to 2·10-3, the selection curves are significantly different. Greater level of variation was also evident for the graphs of water content (Fig. 3(b)) compared with the curves of water content for uncorrelated environments (Fig. 8(b)). In modeling the displacement in a heterogeneous environment breakthrough the main part of the water occurs earlier than for the uniform medium. The early selection of original rolling water observed near the production well for a homogeneous reservoir, almost completely leveled for the inhomogeneous porous medium.
Fig. 8Oil recovery and average water cut for the inhomogeneous medium at various downhole Nc
a)
b)
4. Compare the outputs of different permeability environments
In Table 2 selection curves for different permeability environments are merged by comparing the penetration rates at the time of 1.5. In all cases, the oil recovery increases due to the inclusion of the concept of the influence of capillary number on the dynamic modeling process. Although the specific values of the additional amount of oil will vary depending on the type of used functions from the saturation values (the end points and curvature), heterogeneity and other characteristics of the reservoir, but the table demonstrates the significance of the phenomena associated with capillary number, which in some cases it is important to take into account. The neglect of phenomena related to capillary number can lead to incorrect prediction of the penetration times, distribution of fluids and magnitudes of selection, which is of great importance for the process of adaptation by development history.
Table 2Comparison of production levels for different permeability of porous media
Enrolment is at the time 1.5 borehole at different capillary numbers | |||||
Porous medium | The base case | Increase selection | |||
2·10-7 | 2·10-5 | 2·10-4 | 2·10-3 | 2·10-2 | |
Uniform | 39.5 % | 3.9 % | 10.5 % | 15.7 % | 30.0 % |
Heterogeneous, uncorrelated | 38.5 % | 4.0 % | 9.6 % | 11.3 % | 14.1 % |
Heterogeneous, correlated in the direction of the axis | 34.9 % | 1.5 % | 4.5 % | 6.3 % | 8.3 % |
Heterogeneous, correlated in the direction of the axis | 39.2 % | 4.3 % | 9.9 % | 12.0 % | 15.5 % |
Heterogeneous, correlated in the direction SW-NE | 38.8 % | 3.9 % | 9.0 % | 11.4 % | 15.2 % |
Heterogeneous, correlated in the direction NW-SE | 39.0 % | 4.4 % | 10.1 % | 11.9 % | 14.8 % |
5. Dynamic allocation of capillary zones
The field of capillary numbers changes not only due to changes in boundary conditions, but also due to changes in the field of mobility in the modeling process. This is due to the fact that the curvature values at the endpoints of relative permeability curves for oil and water also differ from each other. Therefore, the conditions that determine the movement of petroleum that are different from those for water flow. In this section the location of wells and injection costs will remain constant throughout the time of simulations. Any differences will be caused by changes in the functions of mobility of the two considered fluids.
Fig. 9Dynamic capillary zone under static boundary conditions (wells Nc=2·10-5)
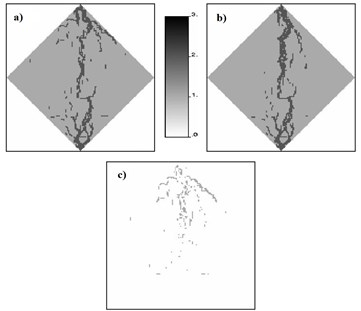
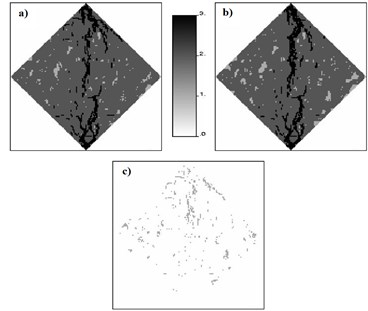
Fig. 10Dynamic capillary zone under static boundary conditions (wells Nc=2·10-3)
In Fig. 9(a) shows the distribution of capillary zones at the moment of 0.24 (after the break), and Fig. 9(b) at the moment of 1.23 (after the break) for downhole capillary number equal to 2·10-5. The submitted drawings show some subtle changes in the choice of simulation curves of relative permeability in the modeling process. In Fig. 9(c) shows the results of calculating the absolute difference between the capillary zones established by the simulation for the entire model at different steps in time. This picture identifier region, where he showed the differences.
6. Conclusions
It should be noted that used for oil and water viscosity were the same. It is obvious that the large difference in viscosity would cause more significant differences. Moreover, differences become even more pronounced with increasing . In Fig. 10 shows the influence of the alternating field mobility with capillary number ( 2·10-3) greater than in Fig. 9. In Fig. 10(a) and 10(b) presents areas with different in points 0.24 and 1.23 respectively, and Fig. 10(c) map differences. You may notice more significant differences compared to Fig. 9(c). Eventually, with increase in capillary number change in the field of mobility are becoming more significant, as was demonstrated in this section.
References
-
Vora H. K. Capillary Number Dependent Streamline Simulations. M.S. Thesis, University of Oklahoma, 2002.
-
Sannikov V. A., Sidelnikov K. A. Method of accounting for the effect of capillary number on the selection process in the modeling of reservoir system using the method of streamlines. Bulletin of the Moscow Academy of Labor Market and Information Technology, Series Applied Informatics, Vol. 25, 2006, p. 124-131, (in Russian).
-
Sidelnikov K. A., Sannikov V. A. Verification of modified method of current lines, taking into account the effect of capillary number on two-phase displacement process. Bulletin of the Moscow Academy of Labor Market and Information Technology, Series Applied Informatics, Vol. 25, 2006, p. 160-169, (in Russian).
-
Fulcher R. A., Ertekin T., Stahl C. D. Effect of capillary number and its constituents on two-phase relative permeability curves. JPT, Vol. 37, Issue 2, 1985, p. 249-260, https://doi.org/10.2118/12170-PA.
-
Maldal T., Gulbrandsen A. H., Gilje E. Correlation of capillary number curves and remaining oil saturations for reservoir and model sandstones. IN-SITU, Vol. 21, Issue 3, 1997, p. 239-269.
-
Lyalin V. E., Sidelnikov K. A. Concepts of mathematical modeling of reservoir systems on the basis of the method of streamlines. The Electronic Scientific Journal Oil and Gas, 2005, http://www.ogbus.ru/authors/Sidelnikov/Sidelnikov_1.pdf, (in Russian).
-
Batycky R. P. A Three-Dimensional Two-Phase Field Scale Streamline Simulator. Ph.D. Thesis, Stanford University, 1997.
-
Thiele M. R. Streamline simulation. 6th International Forum on Reservoir Simulation, 2001.
-
Berenblyum R. A., Shapiro, A. A., Stenby E. H. Reservoir streamline simulation accounting for effects of capillarity and wettability. 9th European Conference on the Mathematics of Oil Recovery, 2004.
-
Blom S. M. P., Hagoort J. How to include the capillary number in gas condensate relative permeability functions? SPE Annual Technical Conference and Exhibition, New Orleans, 1998.
-
Lyalin V. E., Chernyshev K. S., Grigorev I. M., Danilov M. V. Processing curves pressure changes on the results of well test based on fuzzy regression trees. Vibroengineering Procedia, Vol. 12, 2017, p. 225-230.
-
Lyalin V. E., Krasnov A. N., Chernyshev K. S., Kiriyan N. V. Automation of obtaining initial estimates of reservoir parameters when processing the pressure change curve. Vibroengineering Procedia, Vol. 12, 2017, p. 202-207.
