Abstract
Small hole leakage of pipes caused by erosion and perforation is the major form leading to the leakage. The leakage rate is an important premise and foundation for consequence computation and risk evaluation. Those published papers fail to systematically study impacts of initial pressures and leakage sizes of a pipe on the leakage rate. More numerical simulation results are not verified by experimental test. This paper applies numerical simulation technology to establish the model of small hole leakage in pipes, designs and processes different leakage modules to simulate different leakage scenes, and then experimentally validates the model correctness. On this basis, this paper studies impacts of initial pressures and leakage sizes on leakage rates and obtains fluid dynamic characteristics around the leakage hole, including velocity distribution and pressure distribution. However, in actual engineering, the position of leakage hole could not be predicted and changed in general. Therefore, this paper further studies impacts of leakage hole positions on the pipe leakage rate. In this way, this research is refined and could provide a theoretical basis for emergency rescue and accident survey of pipe leakage accidents.
1. Introduction
With the continuous increase in scales of liquid-phase transport pipes, accidents such as pipe break or perforation often happen due to erosion, scouring and high-pressure effects on pipe walls as well as damages [1-4]. Therein, small hole leakage of pipes caused by erosion and perforation is the major form leading to the leakage. The leakage rate is an important premise and foundation for consequence computation and risk evaluation. Pipe application in industrial production not only brings people with a lot of convenience, but also brings huge safety hidden danger to people. When a pipe leaks, huge economic loss would be caused, and large damage would be brought to personal safety and environments as special properties of media in the pipe could lead to fire disasters, explosion and other safety accidents very easily [5-8]. Through numerical simulation of flow fields at leakage cracks with applying FLUENT software as well as comparison of leakage flow fields with different crack widths, theoretical guidance can be provided to further study leakage detection.
Computational Fluid Dynamics (CFD) can be used to study flow field characteristics of pipe leakage more elaborately. Therefore, it is now widely applied to study small hole leakage in pipes. Zhao [9] proposed a computation formula for large hole sub-critical flow leakage rate and established an experimental gas pipe leakage simulation table to verify correctness and applicability of the formula. Kostowski [10] applied experiments and CFD method to compare applicability of an adiabatic model and an isothermal model, and pointed out that different leakage positions and damage reasons might lead to different crack shapes and directions. Fu [11] established a CFD simulation model of hole leakage in pipes based on FLUENT software and used it to study impacts of crack geometric forms on small hole leakage rates of mid-low-pressure pipes as well as aerodynamic characteristics around leakage holes. Shi [12] conducted numerical simulation of liquid pipe leakage with different crack widths, obtained changes of flow field and pressure field at leakage positions when crack widths changed under the constant inlet pressure, and studied their impacts on leakage and sound production. Fu [13] conducted simulation of a leakage module to obtain the velocity distribution on the leakage hole interface and studied impacts of pipe flow rate and pressure on velocity distribution. Zhu [14] has conducted CFD simulations with FLUENT software to investigate the process of oil spill from submarine pipeline to free surface. Impacts of oil density, oil leakage rate, leakage size and water velocity on the oil spill process were examined. Ben-Mansour [15] has completed CFD simulation of small leaks in a pipe with having 100 mm diameter under realistic velocities and pressures using a 3D turbulent flow model. The stable state simulations have shown clear signature in the pressure and pressure gradient variations along the pipe. For very small leaks, this signature is not very strong in the pressure variation, but it is very clear in the pressure gradient. Li [16] applied the FLUENT software to simulate changes of soil temperature fields after an oil conveying pipe leaked at different positions in winter as well as diffusion of leaked oil in soil.
The mentioned papers fail to systematically study impacts of initial pressures and leakage hole size of a pipe on the leakage rate. More numerical simulation results are not verified by experimental test. This paper applies numerical simulation technology to establish the model of small hole leakage in pipes, designs and processes different leakage modules to simulate different leakage scenes, and then experimentally validates the model correctness. On this basis, this paper studies impacts of initial pressures and leakage hole size on leakage rates and obtains fluid dynamic characteristics around the leakage hole, including velocity distribution and pressure distribution. In this way, the research is refined and could provide a theoretical basis for emergency rescue and accident survey of pipe leakage accidents.
2. Computational models of a variety of pipes
At first, this paper studied three kinds of models including straight pipes, spiral pipes and bent pipes. When boundary conditions were the same, internal pressures and velocities of them were analyzed, so that advantages of the straight pipe could be presented. Firstly, CAD software was used to establish geometric models of three kinds of pipes, as shown in Fig. 1. Three kinds of pipes had the same length, inner diameter and wall thickness, namely 250 m, 150 mm and 10 mm. Quality of mesh division could directly affect finally computational results. More meshes will cause more accurate results, but also bring huge workload to computation. 1.6 million tetrahedron meshes were divided for each kind of model. Pressure inlet was set as the boundary condition of pipe inlet. An open pressure outlet was set as the boundary condition of pipe outlet, so fluid could flow out smoothly. When the fluid flowed out from a pipe, it would enter air directly. Therefore, environmental barometric pressure was set as the pressure at pressure outlet. Adiabatic and non-slippage was set as boundary conditions of the pipe. The Scalable function which could promote convergence and accuracy of simulation was used as the near wall face function [17-20]. Solution with applying FLUENT software is equivalent to a residual error comparison process. When a residual error is smaller than a constant value, the solution would be affirmed to describe the solved model. In this paper, a windward mode in difference schemes was used for solution and computation. The mode has a very good convergence in turbulence model computation. 1×10⁻⁵ was set as the maximum residual error. The accuracy denotes super-accurate convergence and could effectively solve common geometry-sensitive problems [21-25]. Finally, contours of pressure field and velocity field distribution of three kinds of pipes could be obtained, as shown in Fig. 2 and Fig. 3. It is shown in these figures that fluid in the straight pipe had the maximum velocity and the maximum pressure. Fluid velocities and pressures in the spiral pipe and bent pipe were not distributed uniformly as pipe bending would increase viscous resistance of fluids, which would then cause different flow velocities of fluids in the pipe. Therefore, the straight pipe has obvious advantages with regard to liquid conveying. Next, this paper will study leakage holes of the straight pipe model.
Fig. 1Geometric and fluid models of three kinds of pipes
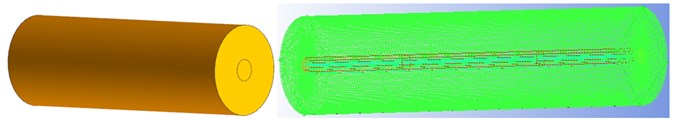
a) Geometric and fluid models of straight pipes
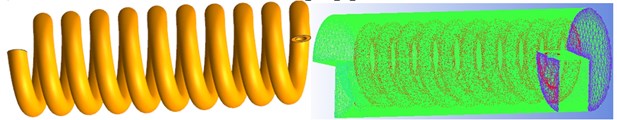
b) Geometric and fluid models of spiral pipes
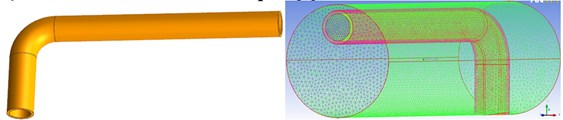
c) Geometric and fluid models of bent pipes
Fig. 2Velocity field distribution of three kinds of pipes
a) Straight pipes
b) Spiral pipes
c) Bent pipes
Fig. 3Pressure field distribution of three kinds of pipes
a) Straight pipes
b) Spiral pipes
c) Bent pipes
3. Numerical model of pipe leakage
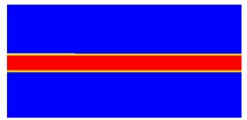
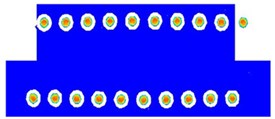
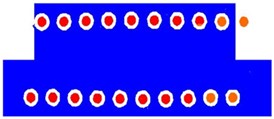
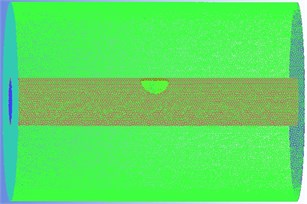
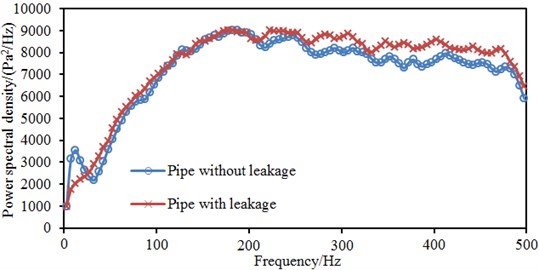
In order to make that numerical simulation results could satisfy requirements of experimental conditions, only one section of leaked pipe was intercepted for research during physical model establishment. The model ratio of 1:1 was used. Specific parameters of pipes were as follows: length was 800 cm; inner diameter was 15 cm; leakage crack was located at the middle part of pipes; leakage crack was a round hole; diameter of the leakage crack was 10 mm. Jet flow and diffusion of petroleum took place near the leakage point, so meshes of the leakage region were optimized. Refined meshes were used near the leakage point, and coarse meshes were used for other positions in the computational domain, as shown in Fig. 4. Through such processing, the computational accuracy of flow field and concentration field could be ensured. Through matching of refined and coarse meshes, the number of meshes was reduced and requirements for computational speeds were also satisfied. Computational model division of the flow field was shown in Fig. 5. In order to present the differences between the leakage and no leakage cases, the average power spectral densities (PSD) around the leakage were computed and were presented in this section, as shown in Fig. 6. The averaged PSD was obtained using the Welch method. It is shown in the figure that the leakage hole only had very tiny impacts on average PSD of the pipe when the analyzed frequency was lower than 200 Hz. When the analyzed frequency was more than 200 Hz, the average PSD around leakage hole would be increased as the leakage would cause fluid chaos around the leakage hole and increase of flowing pressures. Therefore, whether a pipe leaks can be determined through monitoring average PSD.
Fig. 4Mesh model of leaked pipes
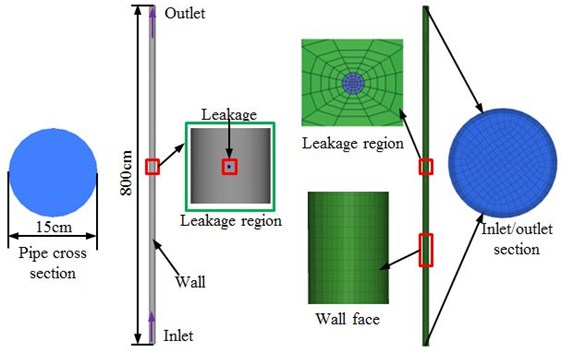
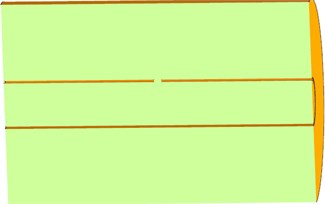
Fig. 5Computational domain model of leaked pipes
a)
b)
Fig. 6Average power spectral density of pipes with/without leakages
4. Analysis on aerodynamic behaviors of leaked pipes
4.1. Impacts of leakage hole size on aerodynamic behaviors
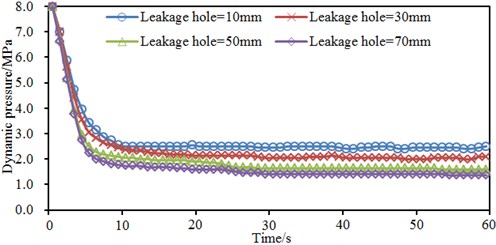
The initial pressure was kept unchanged. Size of the leakage hole was changed from 10 mm to 70 mm, with the step length of 20 mm. Initial pressure changes of the leaked pipe under four working conditions were computed, as shown in Fig. 7. It is shown in these figures that the leakage hole size did not obviously affect the time which was needed to reach the stable leakage status when the inlet pressure was constant. It could also be found that all the leaked pipe models reached the stable status before 10 s. Stable pressures were approaching when the leakage hole sizes were 10 mm and 30 mm. The stable pressures were approaching when the leakage hole sizes were 50 mm and 70 mm. Obviously, when the leakage hole size was more than 50 mm, the pipe pressure would not be affected obviously if the leakage hole was still increased continuously.
Fig. 7Impacts of leakage hole size on aerodynamic behaviors
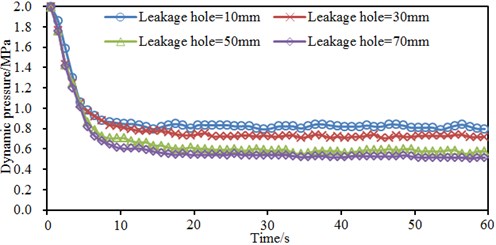
a) Initial pressure = 2 MPa
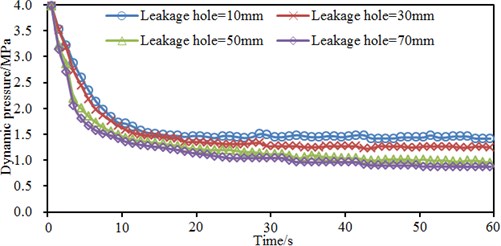
b) Initial pressure = 4 MPa
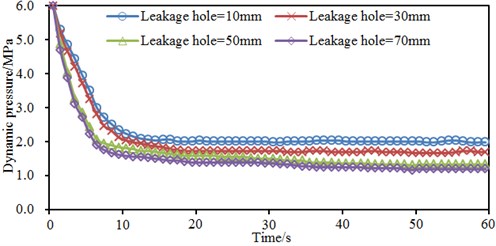
c) Initial pressure = 6 MPa
d) Initial pressure = 8 MPa
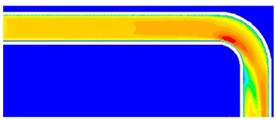
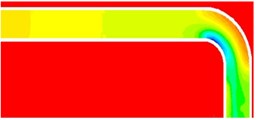
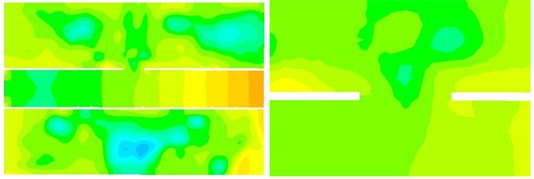
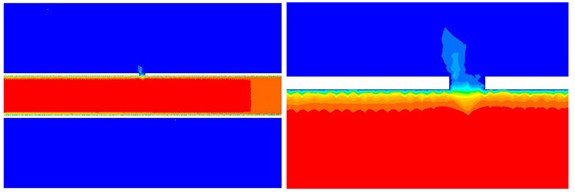
Flow field and pressure field of the leaked pipe model were extracted, as shown in Fig. 8 and Fig. 9. It is shown in Fig. 8 and Fig. 9 that velocity fields were obviously different in the pipe with leakage holes of 50 mm and 70 mm; when the leakage hole size was 50 mm, the fluid velocity in the pipe gradually increased from inlet to outlet; when the leakage hole size was 70 mm, the fluid velocity in the pipe gradually decreased from inlet to outlet. In addition, through comparison with the velocity field without leakage as shown in Fig. 2, it could be found that the leakage hole of 70 mm did not obviously affect the velocity field in the pipe; however, the leakage hole of 50 mm caused obvious impacts, while the main fluid flowing velocity was low in the pipe. The leakage hole of 70 mm did not have obvious impact on fluid velocity in the pipe and the flowing velocity was still high because the near wall fluid at the leakage position flowed outwards under the internal-external pressure difference of pipes.
Fig. 8Velocity field and pressure field distribution of 50 mm leakage model
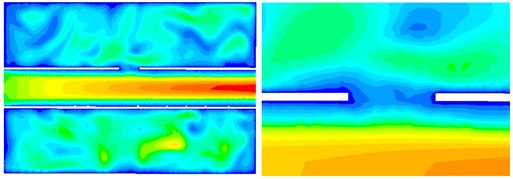
a) Velocity field distribution
b) Pressure field distribution
Fig. 9Velocity field and pressure field distribution of 70 mm leakage model
a) Velocity field distribution
b) Pressure field distribution
However, due to the high flowing rate, the leaked liquid could not flow out from the leakage hole rapidly and thus would impact the wall faces of leakage hole. When the leaked fluid flowed outwards through the leakage hole, a part of the fluid directly impacted the leakage hole wall face, generating instant velocity stasis. The rest fluids flowed upwards along the leakage hole wall face. When the flowing velocity of main fluid was very high in the pipe, media in the pipe would only flow along the leakage crack wall face near the inlet end when the leakage took place, where liquids would not flow out through the complete leakage hole.
Through comparison of pressure distributions with different leakage hole sizes, we can find that the overall pressure field changes in the pipe were slight when the leakage hole size changed. At the leakage position, due to the high main flow velocity and high inertia, the flowing direction could not be changed in time when the fluid flowed out from the pipe under internal-external pressure difference, so that the fluid would impact the leakage hole wall face. It would generate instant velocity stasis when the fluid impacted the wall face. Dynamic energy was converted into pressure potential energy, leading to formation of high-pressure regions. When stable jet flow was formed at the leakage position, eddies would be generated around the jet flow under entrainments. Pressures at the eddy center were relatively low. The entrainment effect was stronger when the position was nearer to the jet flow main body, and the pressure was lower, so that a low-pressure region could be formed. When the inlet pressure was constant, with the gradual increase of leakage hole diameter, the high-pressure region scope at the leakage position would decrease then. Meanwhile, pressure values in the high-pressure region would also decrease. The maximum pressure on the leakage hole wall face could reach 3 times of the inlet pressure. Long-term high-pressure impact would greatly increase the expansion speed of leakage hole. Meanwhile, the low-pressure region scope at the leakage position also increased with the increase of hole size, and pressures in the low-pressure region would also decrease then. When pressures in partial regions decreased to a saturated vapor pressure of the liquid medium under a corresponding temperature, a cavitation core would be generated. When the radius of the cavitation core was more than the critical radius, destabilization and cavitation effects would take place.
4.2. Impacts of initial pressures on aerodynamic behaviors
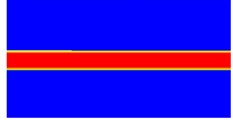
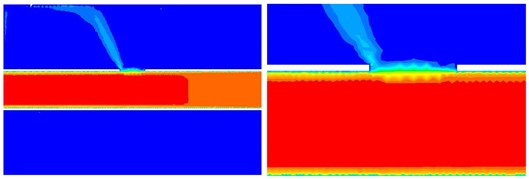
The leakage hole size was kept unchanged. The initial pressure was changed from 2 MPa to 8 MPa, with the step length of 2 MPa. Changes in initial pressures of the leaked pipe under four working conditions were computed, as shown in Fig. 10. It could be found that: when the leakage hole size was the same, the stable pressure would be higher after the leakage was stable when the initial pressure was higher; the pressure decrease amplitude was larger when the initial pressure was higher. Through comparison of pressure decrease curves with different leakage hole sizes after occurrence of the leakage, we can find: leakage hole size only had slight impacts on the time which was needed to reach the leakage stabilization. The liquid incompressibility would be inferred as the reason. It is shown in Fig. 9 that the main fluid velocity was high in the pipe with large leakage. Despite of the large leakage hole size, the high-velocity fluid could quickly compensate the loss caused by leakage. Therefore, the time for the leakage to reach the stable status approached that of the small-size leakage hole, and the constant pressure was maintained. Under different initial pressures, velocity field and pressure field distribution in the pipe were approaching. Therefore, only contours of velocity field and pressure field distribution of the leaked pipe under the initial pressure of 2 MPa were extracted, as shown in Fig. 11. It is shown in the figure that: due to high flow rate and high inertia at the leakage position, the flowing direction could not be changed in time when the fluid flowed out from the pipe under internal-external pressure difference, the fluid would impact the leakage hole wall faces, the fluid would generate instant velocity stasis while impacting the wall faces, dynamic energy was converted into pressure potential energy, and thus a high-pressure region would be formed; after formation of a stable jet flow at the leakage position, an eddy would be generated around the jet flow under entrainment effects, the pressure at eddy center was relatively low, entrainment effects were stronger and the pressure was lower when the position was closer to the jet flow main body, so that a low-pressure region would be formed. The maximum pressure on the leakage hole wall face could reach 3 times of the inlet pressure. Long-time high-pressure impact would greatly increase the expansion speed of leakage hole. Meanwhile, the low-pressure region at the leakage position increased with the increase of hole size. Pressures in the low-pressure region would decrease then. When pressures in partial regions decreased to the saturated vapor pressure of the liquid medium under the corresponding temperature, a cavitation core would be generated. When the radius of the cavitation core was more than a critical radius, destabilization and cavitation effects would take place.
Fig. 10Impacts of initial pressures on aerodynamic behaviors
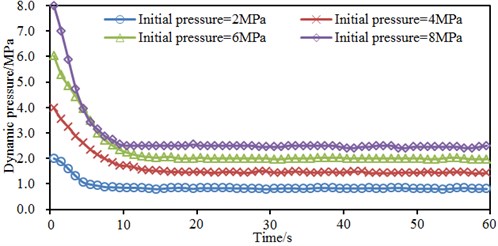
a) Leakage hole = 10 mm
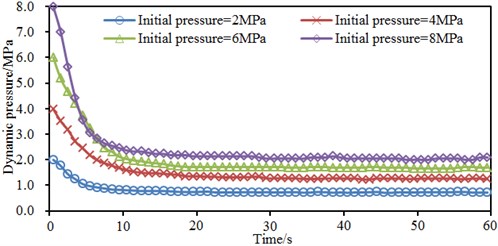
b) Leakage hole = 30 mm
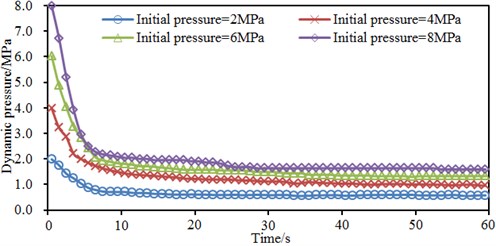
c) Leakage hole = 50 mm
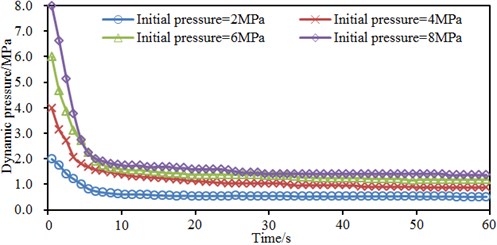
d) Leakage hole = 70 mm
Fig. 11Velocity field and pressure field distribution of leaked pipes
a) Velocity field distribution
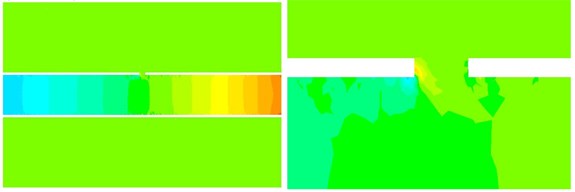
b) Pressure field distribution
5. Leakage rate analysis on leaked pipes
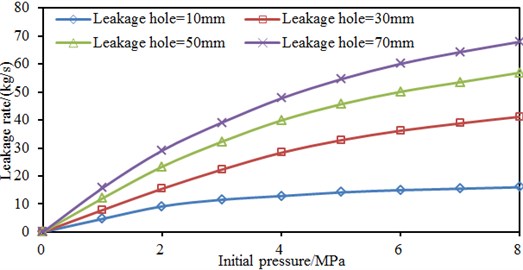
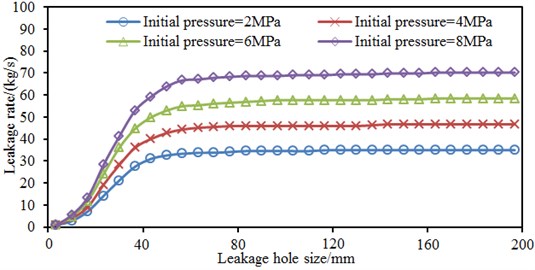
Leakage rates under different working conditions were computed, as shown in Fig. 12 and Fig. 13. It is shown in Fig. 12 that the liquid leakage rate corresponding to the same hole diameter also increased gradually with the increase of initial pressures. Under the same leakage hole size, the leakage rate and initial pressure presented an approximate linear relation. It is shown in Fig. 13 that under the same initial pressure, the initial pressure only had small impacts on the leakage rate when the leakage hole diameter was smaller than a size; however, when the leakage hole diameter was more than the critical size, the initial pressure would have obvious impacts on the leakage rate, the leakage rate increased sharply with the increase of leakage hole diameter and finally tended to a gentle status. For example, when the initial pressure was 2 MPa and the leakage hole diameter was smaller than 8 mm, the leakage rate was kept unchanged basically with the change of leakage hole diameter. However, when the leakage hole diameter ranged within 8 mm-40 mm, the leakage rate and leakage hole diameter basically presented a linear relation. When the leakage hole diameter kept on increasing and was finally more than 40 mm, the leakage rate tended to a stable status.
Fig. 12Leakage rates under different leakage hole sizes
Impacts of leakage hole size and initial pressures on leakage rate are studied above. However, in actual engineering, the position of leakage hole could not be predicted and changed in general. Therefore, it is necessary to further study impacts of leakage hole positions on the pipe leakage rate. In order to conduct comparative verification with the experimental data, the pipe model in above researches was only 8.0 m long. Therefore, a leakage hole was set at positions which were 1.0 m, 2.5 m, 4.0 m, 5.5 m and 7.0 m away from the inlet of 8.0 m pipes. Leakage rates of various leakage models were computed, as shown in Fig. 14. It is shown in Fig. 14 that under the constant pressure, the leakage rate under the same hole diameter would be smaller when the leakage point was farther from the starting point mainly due to pressures decrease caused by pipe inner wall friction.
Fig. 13Leak rates under different initial pressures
It could also be found in the figure that: under the constant initial pressure, when the leakage hole diameter was smaller than a size, the leakage position only had small impacts on the leakage rate; however, when the leakage hole diameter was more than the critical size, the leakage position would have obvious impacts on the leakage rate, and the leakage rate increased sharply with the increase of leakage hole diameter and finally tended to a stable value. In addition, the leakage rate under initial pressures of 8 MPa was obviously more than the result under initial pressures of 4 MPa.
6. Experimental verification of the computational model
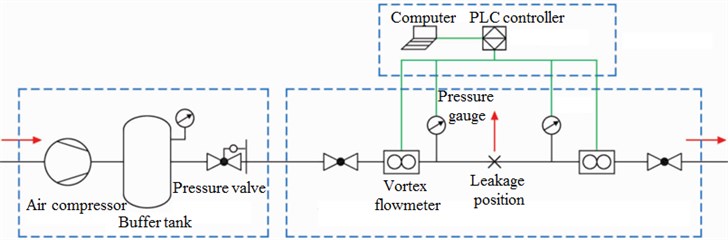
The similarity principle was used to establish a small hole leakage system of pipes. Petroleum was used as the medium during experiments, where boundary conditions were kept consistent with those in the numerical simulation. Fig. 15 shows a flow chart of a small hole leakage system. The system is mainly composed of a power unit, a leakage module and instrument unit and a data collection unit. The power unit comprises a centrifugal pump and a buffer tank, providing a constant petroleum medium for the system. The leakage module and instrument unit comprises a set of replaceable leakage module as well as a pressure gauge and a vortex flow-meter installed on two ends of the leakage module, which are used to simulate leakage process and parameter changes in monitoring. The data collection unit comprises a PLC controller and a computer, which are used for real-time collection and processing of parameters. During the experiment, the medium was pumped by the centrifugal pump to the buffer tank, leakage took place at the leakage module, and un-leaked petroleum was guided to an oil storage tank through a conveying pipe; the pressure meter and vortex flow-meter installed on two ends of the leakage module were used to monitor real-time changes of pressures and flow rate parameters; a leakage rate was obtained through difference conversion of vortex flow-meters installed on two ends of the leakage module. In the experiment, different leakage working conditions were established through manners. Therefore, impacts of pressures in pipe and leakage hole size on the leakage rate were studied. Through comprehensive considering operability and related standard norms of the experiment, the representative hole size and pipe pressure were determined. In order to reduce observation errors and round-off errors of readings as much as possible, the averaging method based on multiple experiments was used.
Fig. 14Leakage rates at different leakage positions
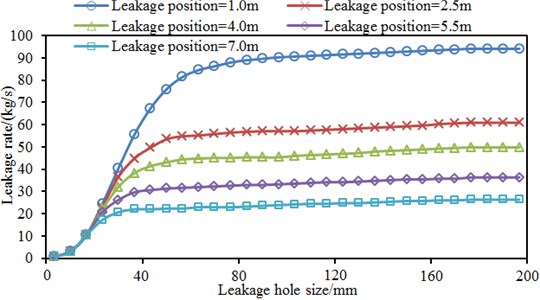
a) Initial pressure = 4 MPa
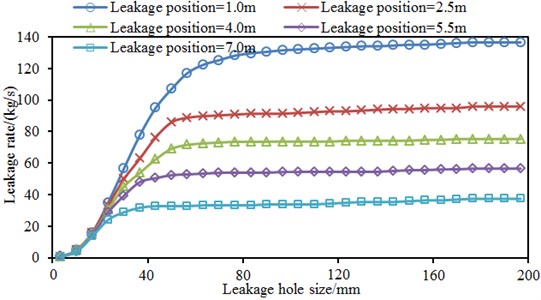
b) Initial pressure = 8 MPa
Fig. 15Flow chart of small hole leakage test system
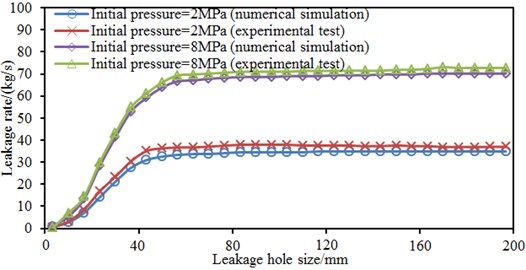
The outlet pressure was kept unchanged. Through modifying the inlet pressure, experimental values of leakage rates under different initial inlet pressures were obtained and compared with simulation values, as shown in Fig. 16. In addition, the initial pressure was kept unchanged. The leakage module was replaced, so the leakage hole size could be adjusted. Therefore, experimental values of leakage rates under different leakage hole sizes were obtained and compared with simulation values, as shown in Fig. 17. It is shown in Fig. 16 and Fig. 17 that experimental values of the leakage rates were slightly higher than simulation values, but their changing trends were consistent. This result indicates that it is feasible to study impacts of initial pressures and leakage hole size on small leakage of oil conveying pipes based on the CFD method. From the perspective of modeling, deviations were caused mainly because of the following reasons. 1) Model simplification: in order to increase computational efficiency and ensure the simulation accuracy during modeling, it was assumed that the initial pressures were equivalent and uniformly distributed in one section of pipes, so the leakage rate at leakage hole was lower than the actual value. 2) Selection of pipe wall face model: during the modeling, the thermal flux of pipe wall face was set to be 0, namely the wall face was assumed as an adiabatic wall. The adiabatic model would generally underestimate actual flowing. 3) Selection of the roughness degree could hardly be completely consistent with pipes used in the experiments. Therefore, deviations were caused between simulation values and experimental values.
Fig. 16Comparison of leakage rates under different leakage hole sizes
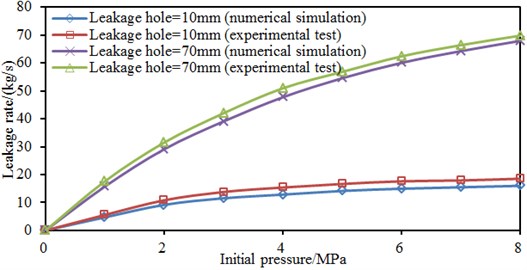
Fig. 17Comparison of leakage rates under different initial pressures
7. Conclusions
1) Fluids in the straight pipe had the maximum velocity and the maximum pressure. Fluid velocities and pressures in the spiral pipe and bent pipe were not distributed uniformly as pipe bending would increase viscous resistance of fluids, which would then cause different flow velocities of fluids in the pipe. Therefore, the straight pipe has obvious advantages with regard to liquid conveying.
2) The leakage size did not obviously affect the time which was needed to reach the stable leakage status when the inlet pressure was constant. All the leaked pipe models reached the stable status before 10 s. Stable pressures were approaching when the leakage sizes were 10 mm and 30 mm. The stable pressures were approaching when the leakage hole sizes were 50 mm and 70 mm. Obviously, when the leakage hole size was more than 50 mm, the pipe pressure would not be affected obviously if the leakage hole was still increased continuously.
3) When pressures in partial regions decreased to a saturated vapor pressure of the liquid medium under a corresponding temperature, a cavitation core would be generated. When the radius of the cavitation core was more than the critical radius, destabilization and cavitation effects would take place.
4) When the leakage hole size was the same, the stable pressure would be higher after the leakage was stable when the initial pressure was higher; the pressure decrease amplitude was larger when the initial pressure was higher. Through comparison of pressure decrease curves with different leakage hole sizes after occurrence of the leakage, we can find: leakage hole size only had slight impacts on the time which was needed to reach the leakage stabilization. The liquid incompressibility would be inferred as the reason.
5) The liquid leakage rate corresponding to the same hole diameter also increased gradually with the increase of initial pressures. Under the same leakage hole size, the leakage rate and initial pressure presented an approximate linear relation. Under the same initial pressure, the initial pressure only had small impacts on the leakage rate when the leakage hole diameter was smaller than a size; however, when the leakage hole diameter was more than the critical size, the initial pressure would have obvious impacts on the leakage rate, the leakage rate increased sharply with the increase of leakage hole diameter and finally tended to a gentle status.
6) Under the constant initial pressure, when the leakage hole diameter was smaller than a size, the leakage position only had small impacts on the leakage rate; however, when the leakage hole diameter was more than the critical size, the leakage position would have obvious impacts on the leakage rate, and the leakage rate increased sharply with the increase of leakage hole diameter and finally tended to a stable value. Experimental values of the leakage rates were slightly higher than simulation values, but their changing trends were consistent. This result indicates that it is feasible to study small leakage of oil conveying pipes based on the CFD method.
References
-
Liu C., Li Y., Yan Y., et al. A new leak location method based on leakage acoustic waves for oil and gas pipelines. Journal of Loss Prevention in the Process Industries, Vol. 35, 2015, p. 236-246.
-
Lavasani S. M., Ramzali N., Sabzalipour F., et al. Utilisation of fuzzy fault tree analysis (FFTA) for quantified risk analysis of leakage in abandoned oil and natural-gas wells. Ocean Engineering, Vol. 108, 2015, p. 729-737.
-
Alobaidi W., Sandgren E., Al Rizzo H. A survey on benchmark defects encountered in the oil pipe industries. International Journal of Scientific and Engineering Research, Vol. 6, Issue 2, 2015, p. 844-853.
-
Wei W., Fan X., Song H., et al. Imperfect information dynamic stackelberg game based resource allocation using hidden Markov for cloud computing. IEEE Transactions on Services Computing, Vol. 99, 2016, p. 1-13.
-
Hu J., Zhang L., Liang W. Detection of small leakage from long transportation pipeline with complex noise. Journal of Loss Prevention in the Process Industries, Vol. 24, Issue 4, 2011, p. 449-457.
-
Barbosa L. M. C., De Lima A. G. B., Neto S. R. F. Non-isothermal transient three-phase flow (heavy oil, water and gas) in vertical pipeline: the effect of leakage. International Journal of Modeling and Simulation for the Petroleum Industry, Vol. 6, Issue 2, 2012, p. 57-66.
-
De Sousa J. V. N., Sodré C. H., De Lima A. G. B., et al. Numerical analysis of heavy oil-water flow and leak detection in vertical pipeline. Advances in Chemical Engineering and Science, Vol. 3, Issue 1, 2013, p. 9-15.
-
Li J., Deng G., Luo C., et al. A Hybrid path planning method in unmanned air/ground vehicle (UAV/UGV) cooperative systems. IEEE Transactions on Vehicular Technology, Vol. 65, Issue 12, 2016, p. 9585-9596.
-
Zhao J. H., Tan Y. F. Experiment study on subcritical flow nozzle model in the gas pipelines. Journal of Harbin Institute of Technology, Vol. 43, Issue 2, 2011, p. 84-87.
-
Kostowski W. J., Skorek J. Real gas flow simulation in damaged distribution pipelines. Energy, Vol. 45, Issue 1, 2012, p. 481-488.
-
Fu J. M., Zhao H. X., Chen G. M., Zheng X. Y. Impact of a hole’s geometrical characteristics on the aperture leakage of natural gas pipelines. Natural Gas Industry, Vol. 34, Issue 11, 2014, p. 128-133.
-
Shi Z. B., Sun Y. Numerical simulation of liquid pipeline gap leakage under different width. Journal of Northeast Electric Power University, Vol. 37, Issue 1, 2017, p. 75-79.
-
Fu J. M., Zhao Z. Y., Chen G. M., Luo H. J. Influences of liquid pipeline flow and pressure on small-hole leakage rate. Acta Petrolei Sinica, Vol. 37, Issue 2, 2016, p. 257-265.
-
Zhu H., Lin P., Pan Q. A CFD (computational fluid dynamic) simulation for oil leakage from damaged submarine pipeline. Energy, Vol. 64, 2014, p. 887-899.
-
Ben Mansour R., Habib M. A., Khalifa A., et al. Computational fluid dynamic simulation of small leaks in water pipelines for direct leak pressure transduction. Computers and Fluids, Vol. 57, 2012, p. 110-123.
-
Li L. Three dimensional numerical simulation of buried oil pipeline leakage in the northwest of China. Oil-Gasfield Surface Engineering, Vol. 35, Issue 2, 2016, p. 28-30.
-
Wei W., Song H., Li W., et al. Gradient-driven parking navigation using a continuous information potential field based on wireless sensor network. Information Sciences, Vol. 408, 2017, p. 100-114.
-
Blocken B., Toparlar Y. A following car influences cyclist drag: CFD simulations and wind tunnel measurements. Journal of Wind Engineering and Industrial Aerodynamics, Vol. 145, 2015, p. 178-186.
-
Rezende H. C., Santos A. A. C., Navarro M. A., et al. Verification and Validation of a thermal stratification experiment CFD simulation. Nuclear Engineering and Design, Vol. 248, 2012, p. 72-81.
-
He W., Hong X., Luo B., et al. CFD and comparative study on the dual-function solar collectors with and without tile-shaped covers in water heating mode. Renewable Energy, Vol. 86, 2016, p. 1205-1214.
-
Stamoudis N., Chryssakis C., Kaiktsis L. A two-component heavy fuel oil evaporation model for CFD studies in marine diesel engines. Fuel, Vol. 115, 2014, p. 145-153.
-
Wei W., Sun Z., Song H., et al. Energy balance-based steerable arguments coverage method in WSNs. IEEE Access, 2017, https://doi.org/10.1109/ACCESS.2017.2682845.
-
Yang J. G., Zhou X. H. Numerical simulation on residual wall thickness of tubes with dimensional transitions and curved sections in water‐assisted injection molding. Journal of Applied Polymer Science, Vol. 128, Issue 3, 2013, p. 1987-1994.
-
Gousseau P., Blocken B., Stathopoulos T., et al. CFD simulation of near-field pollutant dispersion on a high-resolution grid: a case study by LES and RANS for a building group in downtown Montreal. Atmospheric Environment, Vol. 45, Issue 2, 2011, p. 428-438.
-
Li J., Huang L., Zhou Y., et al. Computation partitioning for mobile cloud computing in a big data environment. IEEE Transactions on Industrial Informatics, Vol. 13, Issue 4, 2017, p. 2009-2018.
About this article

