Abstract
Based on Detached Eddy Simulation (DES) technique, the flow around a columnar projectile with different cross-section shapes in the supercritical and extremely supercritical region is simulated by the Fluent. The cross-section of the projectile is regular polygon, which number of edges is 4, 6, 8, 10, 12, 24 and ∞, where ∞ means a circle. The vortex shedding pattern and flow field characteristics are analyzed at Reynolds number 2.5×10⁵ to 2×10⁷. Regarding circular cylinder projectile, when the flow velocity changes from 25 m/s to 200 m/s, the average drag coefficient decreases, and the Number increases. Regarding regular polygon, when the number of edges for polygon changes from 4 to ∞ at flow velocity 50 m/s, the average drag coefficient decreases, and the Number increases. The average lift coefficient is almost equal to zero and does not change with the flow velocity and the cross-section. The pressure coefficient of 4-prism, 6-prism, 8-prism, 12-prism and 24-prism has multiple local minimum values at the polygon vertices of the cross section. According to the spectrum analysis, the vortex shedding frequency of 4-prism, 24-prism and cylindrical is single and fixed, so the projectile may cause resonance and deviates from a predetermined trajectory. But for the 6-prism and 8-prism and 12-prism, the and is multi-periodic vibration. So, considering the flow induced structural vibrations, drag, the power of shrapnel and manufacturing cost, the 8-prism are better choices for cluster warhead underwater in engineering design.
1. Introduction
The flow around a circular cylinder, which is a classical problem in fluid mechanics, is widely used in engineering practice. In the particular underwater trajectory condition, the flow field will establish the regular Kármán vortex. At this time, the upper and lower boundary layer of the column is alternately falling off, and the vortex is formed. The projectile is subjected to periodic variation of the fluctuating lift force and drag force, which lead to the vibration of the projectile. When the frequency of the pulsation is close to the natural frequency of the projectile, it will induce resonance and destroy the structure of the projectile. Also, it is possible to increase the resistance, produce noise and make the projectile deviate from the scheduled trajectory. Because the underwater trajectory is usually in the supercritical and extremely supercritical region of high Reynolds number, the theoretical and experimental research has many limitations, which make the numerical simulation become an effective method to study the flow around the cylinder.
Many scholars have made a lot of research work on the flow around the cylinder. The experimental results under different Reynolds numbers are given in the Ref. [1], but no experimental data are given when the Reynolds number is greater than 1×10⁷. The flow around a single cylinder on a smooth surface of 6×1045×106 was studied by Achenbach [2], and the distribution of local pressure and friction around the cylinder was obtained. Yokuda and Ramaprian [3] have studied experimentally for the flow around a circular cylinder in the subcritical region, and the average drag coefficient and the Strouhal number are obtained. At the same time, many scholars have studied the numerical simulation of the flow around the cylinder [4-17]. In the Ref. [4], the Detached Eddy Simulation (DES) method based on S-A turbulence model is used to simulate the single circular cylinder flow in subcritical and supercritical Reynolds numbers. By comparing with the experimental results, the accuracy of the DES method in simulating the circular cylinder flow in a high Reynolds number region is verified. In the Ref. [12], numerical analysis of flow around a circular cylinder with periodic deformation has been carried out, and the frequency locking phenomenon of periodically deformed cylinders has been found. Travin A. [16] and Ong M. C. [17] proved the reliability of the two dimensional DES simulation past a circular cylinder at 1×10⁶ to 3.6×10⁶. And, there are many researches focus on the square section of the column structure [18-21]. Tamura T. [18] and Yoon D. H. [19] respectively using experimental and numerical simulation of flow around four-prism are fully studied, and the influences of Reynolds number, angle of attack, chamfered and rounded corners on flow-induced forces on the four-prism are given. Park C. W. [20] investigated experimentally the flow around a finite cylinder by varying the shape of the tip, meanwhile, the influence of the tip shape on the size of the recirculation bubble, the turbulence intensity and vortex structure is given. In the Ref. [21], the vortex induced motion of a cylinder and four-prism is simulated by moving mesh method, and the fluid-solid interaction is taken into account, meanwhile, the correctness of the simulation method is verified by experimental comparison. In the Ref. [22], the wind tunnel experiment is conducted to study the flow around a regular eight-prism with Reynolds number from 2.22×10⁶ to 8.90×10⁶. And, the influence of Reynolds number, inclination angle and wind direction angle on the distribution of the mean steady-state pressure coefficient, aerodynamic and aerodynamic moment coefficients is obtained. However, in water, the theoretical and experimental studies on the flow around large deformation prisms at very high Reynolds numbers have many limitations, and there are few literature and data that can be used to guide the engineering design of underwater shrapnel. Therefore, this paper carried out a preliminary exploration through numerical simulation methods.
In this paper, the underwater anti-torpedo shrapnel [23] as research object. The numerical simulation of the flow around the projectile, which is thrown in the direction perpendicular to the axis of the underwater shrapnel, is studied. The flow velocity and the cross-section shapes are changed in simulation experiments in order to reduce the drag of projectile, avoid the single frequency vortex street and resonance, avoid the projectile deviating from the scheduled trajectory and ensure the power radius of shrapnel. Based on DES and combined with the engineering design requirements of the submunition, the numerical simulation about underwater projectile cylinder flow is executed in the supercritical and extremely supercritical region. And the variation law and relationship between average lift-drag coefficient, Strouhal number and the shape of the column section, the flow velocity are compared and analyzed. It provides a reference for the engineering design of underwater anti-torpedo shrapnel.
2. Computational models and method verification
2.1. Description of the test case and models
Hypothesis: Actually, the projectile is moving in the underwater trajectory, and the water fluid medium is stationary. In this paper, to study the flow around the projectile, the projectile is stationary and the water medium fluid is given the relative velocity . As shown in Fig. 1, based on quantities of simulation explorations and the Refs. [4-17], the calculation flow field and the relative position of the cylinder are established. The coordinate origin is located at the outer circle center of the cross-section. The excircle diameter of these cross-sections both are 100 mm. Initially, the direction of flow velocity is in the positive direction of the -axis. Also, the velocity component of the fluid in the -axis direction is defined as , and the velocity component in the -axis is . The flow field is 40×16, and the upstream flow area is 8×16. In order to observe the morphology of the vortex shedding, downstream flow area is 32×16. The distance from the origin to the upper and lower boundaries is 8, so that the influence of the upper and lower wall boundary on the calculation results can be ignored.
Fig. 1The sketch map of flow field in numerical simulation
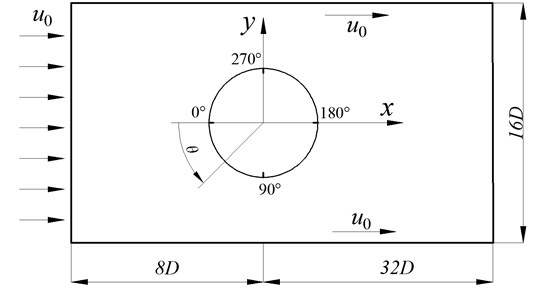
Fig. 2Relative position of prisms in flow field
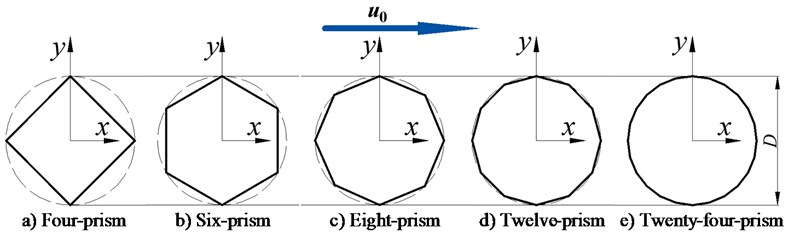
The direction of flow velocity and the position relations of the four-prism, six-prism, eight-prism, twelve-prism, twenty-four-prism and circular cylinder are shown in Figs. 1 and 2. In order to make the feature length of each projectile equal, the position of the projectile in the flow field is shown in Fig. 2. So that it is convenient to analyze the variation of the lift coefficient and drag coefficient of the projectile with different cross-section shapes.
According to the underwater trajectory of the projectile, the simulation test schemes are shown in Table 1. By changing the flow velocity and the shape of the cross-section, this paper studies the characteristics of the underwater flow field and the change rules of the lift and drag coefficient and the Strouhal number.
Table 1Simulation test scheme
Scheme No. | Cross-section shape | Excircle diameter | Reynolds number | |
F4 | Quadrilateral | 100 mm | 50 m/s | 5.0×10⁶ |
F6 | Hexagon | 100 mm | 50 m/s | 5.0×10⁶ |
F8 | Octagon | 100 mm | 50 m/s | 5.0×10⁶ |
F12 | Regular twelve-edge polygon | 100 mm | 50 m/s | 5.0×10⁶ |
F24 | Regular twenty-four-edge polygon | 100 mm | 50 m/s | 5.0×10⁶ |
FH | Circle | 100 mm | 50 m/s | 5.0×10⁶ |
H1 | Circle | 100 mm | 25 m/s | 2.5×10⁶ |
H2 | Circle | 100 mm | 100 m/s | 1.0×10⁷ |
H3 | Circle | 100 mm | 150 m/s | 1.5×10⁷ |
H4 | Circle | 100 mm | 200 m/s | 2.0×10⁷ |
2.2. Grid division and turbulence model
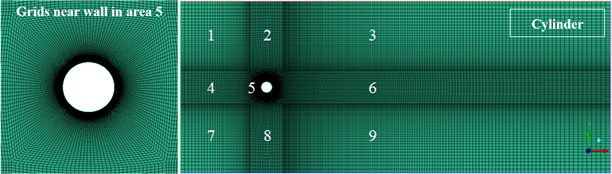
The Kármán vortex is caused by the complex turbulent flows around the boundary layer of the cylinder, so the result of numerical simulation is directly affected by the quality of mesh. As shown in Fig. 3, the four-prism calculation flow field is divided into seven regions, and the flow field of six-prism, eight-prism and cylinder are divided into nine regions. In order to reduce the number of grids and accelerate the calculation speed, the grid density from the center of the area 4 or area 5 to the surrounding gradually reduces. As shown in Fig. 3(b), the O-type topological structure, which increases the density of grids around the projectile, is used to accurately observe the boundary layer of the complex flow and vortex shedding patterns, and the scale factor is 0.26. According to mesh-independent test results and the grid scale in the Ref. [5], the thickness of the first layer mesh of is 0.00001 m in the near-wall region, and the grid expansion factor in the radial direction (geometrical series) is 1.07 to assure high resolution grid in the boundary layer.
Fig. 3Topology structure of flow field mesh for projectile with different cross-sections
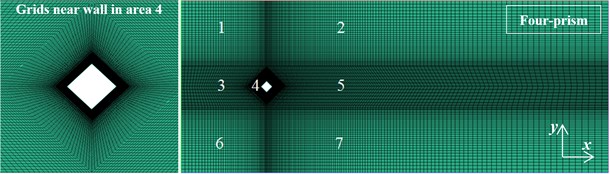
a) Topology structure of flow field mesh for four-prism
b) Topology structure of flow field mesh for circular cylinder
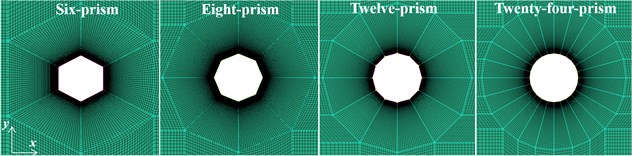
c) Grids near wall in area 5 for six-prism, eight-prism, twelve-prism and twenty-four-prism
In this paper, the Reynolds number (2.5×10⁵ 2×10⁷) of circular cylinder flow is very high in the underwater ballistic. Usually, the Large Eddy Simulation (LES) model is used to simulate circular cylinder flow at high Reynolds number, but Large Eddy Simulation requires the computational grid is divided into the inertial temperament scale within the calculated time, and with the Reynolds number increasing, the number of grids increases in a geometric multiple [6]. And according to the research results of the Ref. [5], the two-dimensional RANS model is difficult to predict the unsteady flow around the cylinder. In 1997, Spalart [13] proposed DES. This method can not only play the small amount calculation of RANS in the boundary layer, but also can simulate the large scale separation turbulent flow in the region far away from the surface layer. So, in this paper, the S-A method of DES is used to simulate circular cylinder flow at the high Reynolds number.
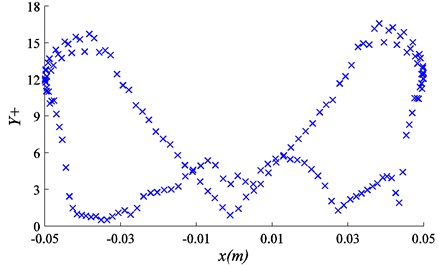
According to the water medium compressibility, the velocity inlet boundary is used in entrance. The outflow is used in export. In order to reduce the influence of the wall on the velocity of the flow field, the upper and lower walls adopt the sliding wall, and the sliding velocity is consistent with the inlet velocity . No slip surface is used in the surface of the columnar projectile. In the near wall, if the distinguishable LES mesh is used, a large number of grids are needed. Therefore, a method [24] similar to turbulent viscous model is adopted to deal with near wall mesh, and according to the reference, the near-wall scale is maintained in 0.5-16, as shown in Fig. 4. The SIMPLEC algorithm is adopted to solve the pressure velocity coupling, the momentum is second order upwind scheme, the pressure equation is second order accuracy, and the second order implicit scheme is adopted in the transient scheme. The fluid medium is water medium, the density 998.2 kg/m3, the dynamic viscosity 1.003×10⁻³ kg/(m·s). The Reynolds number .
Fig. 4Y+ value on circular cylinder surface
2.3. Numerical verification
Studying the numerical calculation of circular cylinder flow, the calculation time step size and mesh accuracy have direct influence on the simulation results. It is necessary to carry out the sensitivity tests of time step size and grids number, that is, a lot of simulation tests need to be done until the main parameters of the simulation results are not changed with the time step size and grids number. According to the experimental results in the Ref. [1], Kármán vortex can be established at 5×10⁶, and the main hydrodynamic parameters have smaller change rate near 5×10⁶, which is suitable for the sensitivity tests in this case. So, the flow velocity of circular cylinder flow is 50 m/s in the sensitivity tests of time step size and grids number. In each calculate time step size, the flow distance of the fluid is limited from to /20. In numerical calculation of the sensitivity tests, the selected time step size is 0.002, 0.001, 0.0004, 0.0002 and 0.0001.
The numerical simulation results of sensitivity tests for time step sizes are shown in Fig. 5(a). The average drag coefficient and Strouhal number are defined as and respectively. The number and average drag coefficient increases with the decrease of time step size. When the time step size is less than or equal to 0.0004, the number and the average drag coefficient will not change with the change of time step size. When the time step size is 0.0004, the average drag coefficient is closest to the experimental value in the Ref. [1] than the others time step sizes. At the calculation time step size 0.0004, the flowing distance of the fluid is the 1/5, where is the characteristic length. Combining the selection criterion of time step in the Ref. [14, 15], the calculation time step size satisfies a condition: in the following simulation.
The sensitivity tests of grids number for flow past circular cylinder at 25 m/s-200 m/s are shown in Fig. 5(b). The total grid count from 20 thousand to 80 thousand is used to verify the independence of grids number. The results show that the convergence is presented, when the mesh number is more than 60 thousand in the working condition which 200 m/s, 1.99×10⁷. The other working conditions can meet the requirement of precision when the number of grids is greater than 40 thousand. And, the total number of grids in each working condition is situated between 60 thousand and 66 thousand in the following simulation.
Fig. 5Sensitivity test of time step size and number of grid for St and Cd
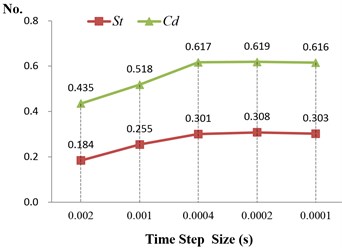
a)
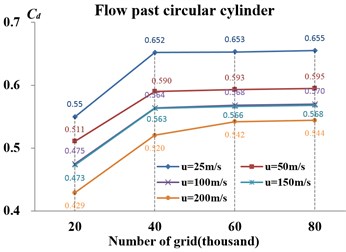
b)
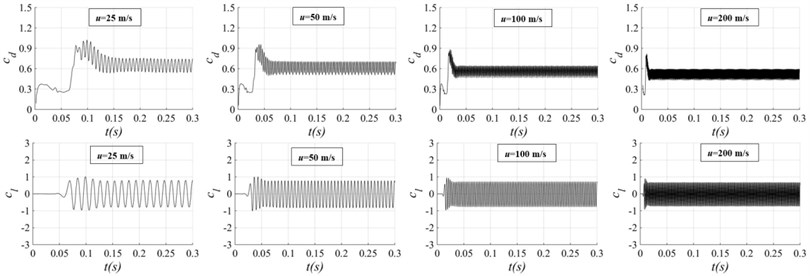
Fig. 6, respectively, is the time histories of the drag coefficient and the lift coefficient for circular cylinder flow with different flow velocity. In the scheme H1, the and are both periodic fluctuation after flowing 0.15 s, and the fluctuation frequency of is two times of the . And the fluctuation frequency of is correspond to the vortex shedding frequency. The periodicity of the is better than the , so the FFT algorithm is used to carry out the discrete Fourier transform of the lift coefficient curve, which can be used to determine the number related to vortex shedding. Because the amplitude fluctuation of the drag coefficient is larger in time-histories, the average drag coefficient is calculated after 0.15 seconds. In other working conditions, the drag coefficient and the lift coefficient have similar fluctuation characteristics, and the fluctuation frequency increases with the increase of flow velocity.
Fig. 6Time histories of the drag coefficient and lift coefficient with different flow velocity
In Fig. 7, the 2D DES results are compared with published 3D DES results [16] and experimental data [2] about in the turbulent separation flow (3.0×10⁶ and 3.6×10⁶). At 3.0×10⁶, The separation point of 2D DES is very close to the 3D DES results, but the curvature of the is bigger than the 3D DES. At 3.6×10⁶, The separation of 2D DES occurs a little later than the experimental data. The crest of the 2D DES is smaller than the experimental data and 3D DES. The base pressure of the 2D DES fall between the experimental data and the 3D DES. These differences between the present work and the published data are in agreement with the two-dimensional LES simulation results [9], which are mainly caused by the difference in the fluid medium. The ability to sustain three-dimensionality in a 2D geometry is also confirmed by Travin A. [16] and Ong M. C. [17] at 1×10⁶, 2×10⁶, 3×10⁶, 3.6×10⁶. So, that hybrid methods (2D DES) can be used to the predict turbulent separation flow in underwater engineering.
Fig. 7Comparison with published 3D simulation and experimental data for the Cp
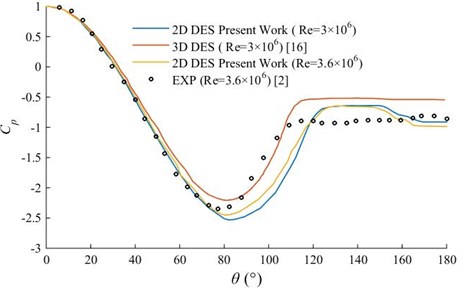
Table 2 is a comparison of present simulation results with published experimental and numerical data. When the flow velocity is 25 m/s, the average drag coefficient obtained in this paper and the Ref. [10] is larger than the experimental data [1]. The Strouhal number obtained in this paper is close to the Ref. [10], but is not in conformity with the experimental results in the Ref. [1]. When the flow velocity is 50 m/s and 100 m/s, the average drag coefficient and Strouhal number are both slightly larger than the experimental value in the Ref. [1], and are closer to the experimental values than the simulation results in the Ref. [10]. When the flow velocity is 150 m/s and 200 m/s and the Reynolds number 1.0×10⁷, the relevant experimental and simulation data are not found. According to the research of the Ref. [9], when the fluid medium is water, there is a negative pressure suction effect, so the resistance coefficient is greater than the experimental value. Thus, this is consistent with the simulation results in this paper.
Table 2Comparison of calculation results and references
Reynolds number | Scheme No. | Average drag coefficient | Relative error | Strouhal number | Relative error |
2.5×10⁶ | H1 | 0.652 | – | 0.236 | – |
EXP [1] | 0.58 | 12.3 % | – | – | |
LES [10] | 0.6 | 8.6 % | 0.22 | 7.3 % | |
5.0×10⁶ | FH | 0.617 | – | 0.301 | – |
EXP [1] | 0.60 | 2.8 % | 0.28 | 7.5 % | |
LES [10] | 0.43 | 43.7 % | 0.24 | 25.4 % | |
1.0×10⁷ | H2 | 0.564 | – | 0.306 | – |
EXP [1] | 0.55 | 2.5 % | 0.3 | 2.0 % | |
LES [10] | 0.4 | 41.0 % | 0.3 | 2.0 % |
3. Results and discussion
3.1. The analysis of flow field characteristic
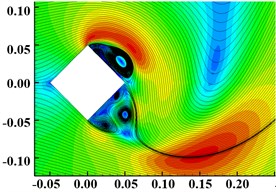
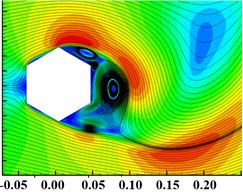
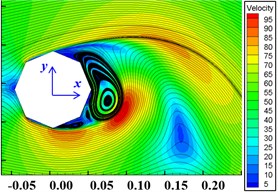
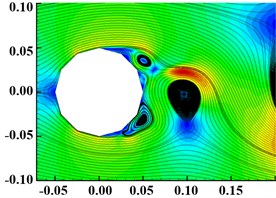
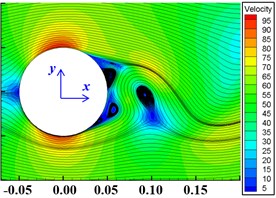
The vorticity map of circular cylinder flow with different flow velocity is shown in Fig. 8. The unit of coordinates is m. From the figure, it can be seen that when the flow velocity is in 25 m/s-200 m/s, the regular vortex forms in downstream tail flow region. With the flow velocity increasing, the propagation distance of the regular vortex increases, and the scale of the vortex in the y-axis direction increases first and then decreases. Because the size of vortex increases and the distance along the flow direction becomes smaller, the interaction between adjacent vortices increases, resulting in the shape of vortices gradually changing from a regular circle to a “P” vortex. When the vortex flows a certain distance, the ratio between the distances of transverse and flow direction is no longer satisfied by 0.28 [1], and the vortex is no longer in regular and stable order.
The vorticity map of circular prism flow with different section shapes is shown in Fig. 9. From the figure, all flow around columnar projectile can form a relatively regular vortex street. The equilibrium distances of the vortices vary from one another. In the same distance of flow direction, the number of vortices arranged in equilibrium is positively related to the number of section edges, and coincides with the variation law of Number. For four-prism, the size of vortex street is the largest in the -axis. The vortex shape of 24-prism is closest to the vortex of circular cylinder. And with the number of edges increasing, the size of the vortex street decrease. The scale of six-prism vortex in the -axis direction is smaller than the four-prism, and the propagation distance of the regular vortex in the -axis direction is less than the eight-prism. For 4-prism, 6-prism, the shape of vortices is circle, but for 8-prism, 12-prism and 24-prism, the shape of vortices is changed to a “P” vortex.
Fig. 8The Z vorticity of cylinder with different u0
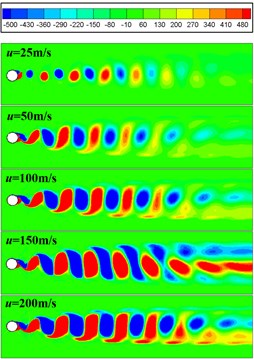
Fig. 9The Z vorticity of different column projectile
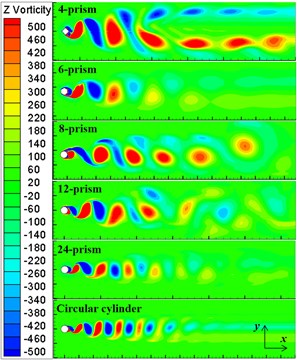
Fig. 10The Velocity and Streamline of prism with different section shapes
a) Four-prism
b) Six-prism
c) Eight-prism
d) Twelve-prism
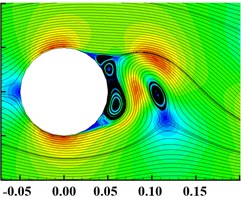
e) Twenty-four-prism
f) Circular cylinder
As shown in Fig. 10, the interior angle of quadrilateral is smallest, and the recirculation zone is the largest after the vortex separation point. When the fluid passes through the four-prism, the greater lateral velocity is obtained, so that the separation of positive and negative vortices is fastest, and the vortex scale is the largest, leading to the increase of pressure difference resistance. With the increase of the number of section edges and the interior angle, the recirculation zone and the size of vortex decrease. And, the vortex size of the twenty-four-prism is almost equal to the circular cylinder.
The distribution of the mean steady-state pressure coefficient along the column surface is shown in Fig. 11. The , where is the monitoring pressure, and is the reference pressure. The reference pressure is zero in this paper. The statistical value of is the average of the pressure coefficient. It is shown from the diagram that the steady pressure coefficient shows good symmetry in the upper and lower surfaces of the cylindrical projectile. With the decrease of the number of section edges, the symmetry of circumferential distribution becomes worse. The stagnation point at the inflow is 1, and the pressure system decreases as the flow rate is resumed. The of 4-prism, 6-prism, 8-prism, 12-prism and 24-prism has multiple local minimum values at the polygon vertices of the cross section. The global minimum values of for 4-prism, 6-prism 8-prism, 12-prism and 24-prism are located at 181.9°, 150.0°, 47.0°, 60.0° and 75.0°. The global minimum values of for cylindrical are at 83.5° and 275.4°. Subsequently, the pressure rises, and a relatively uniform low pressure zone is formed at the back of the projectile. And the less the number of edges of the column cross section, the smaller the pressure value in the low pressure zone.
Fig. 11Cp distribution on column surface
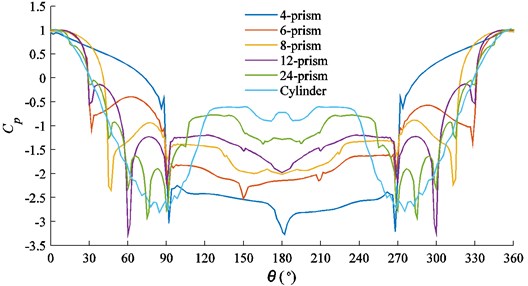
Fig. 12Mean velocity ux distribution along the axis y= 0
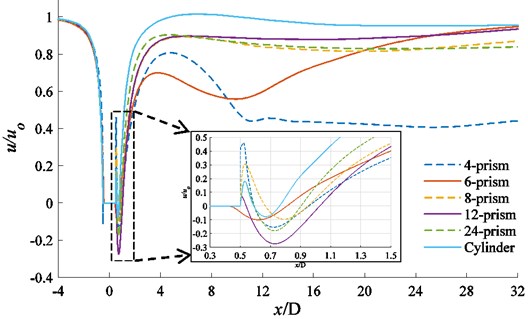
The mean velocity distribution along the central axis 0 is shown in Fig. 12. When the fluid passes through the projectile body, the reflux velocity reaches the global maximum at 0.218; 0.191; 0.292; 0.225; 0.221 and 0.170 from the back of each columnar projectile. The global maximum reflux velocity of each prism is –0.155; –0.100; –0.095; –0.274; –0.179; –0.077, and then the velocity distribution is gradually recovered. The length of reflux area for each prism is 0.35; 0.36; 0.27; 0.48; 0.31; 0.16.
The distributions of mean velocity at different positions behind each column are shown in Fig. 13. According to the diagram, in the near wake region of the column, the velocity range is ‘V’ in the -axis direction. At 0, with the number of edges increasing, the amplitude of the ‘V’ type of each prism increases. At 1, with the number of edges increasing, the amplitude of the ‘V’ type of each prism increases first and then decreases. And at the others position, with the number of edges increasing, the amplitude of the ‘V’ type of each prism decreases. As the fluid moves away from the near wake region, the bottom of the ‘V’ type gradually slows down. The distribution curves of for eight-prism, twelve-prism, twenty-four-prism and cylinder have good symmetry about 0. For the four-prism, the symmetry axis of the distribution curve shifts toward the positive direction of the -axis at 4, and the distribution curves of have good symmetry about 0 at other locations. The symmetrical axis of the distribution curves at each position of the six-prism are shifted to the negative direction of the -axis in different degrees.
Fig. 13The distributions of mean velocity ux at different positions behind each column
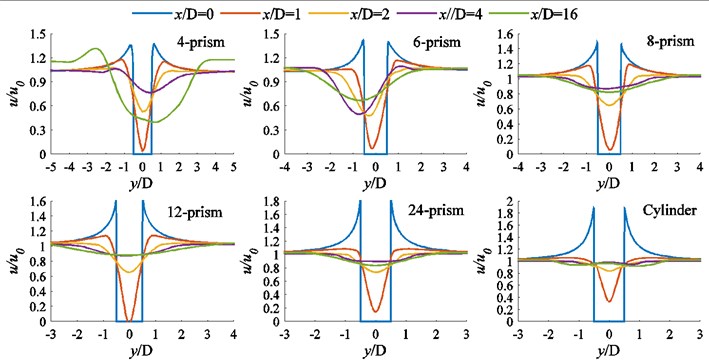
Fig. 14The distributions of mean velocity uy at different positions behind each prism
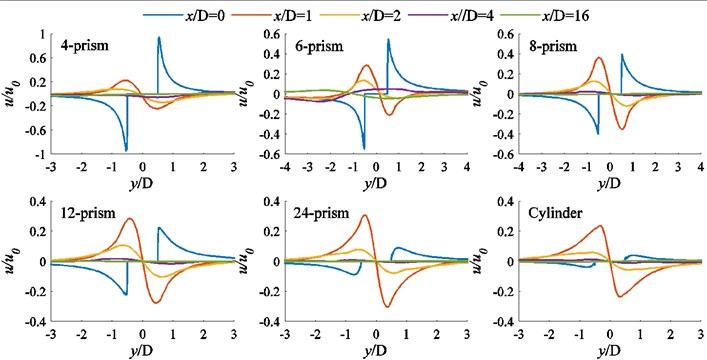
The distributions of mean velocity at different positions behind each prism are shown in Fig. 14. After flowing through the projectile, the fluid obtains a large lateral velocity at the 0, 1 and 2 positions, and after 4 the lateral velocity is almost attenuated to zero. In the 0 position, comparing the six subplots, we can see that the lateral velocity decreases with the increase of the cross section edge number of the column. At the 1 and 2 positions, with the number of cross-section edges increasing, the lateral velocity of the fluid flowing through each prism increases first and then decreases.
3.2. The analysis of drag coefficient, lift coefficient and number
Fig. 15 is the time histories of the drag coefficient and the lift coefficient for circular prism flow with different section shape. The flow velocity is 50 m/s. The flow is fully developed. After the full development of the flow field, spectrum analysis of the time histories shows that the lift coefficient and drag coefficient of the four-prism, twenty-four-prism and cylinder tend to be single periodic vibration. And the drag coefficient and lift coefficient of the six-prism tend to be multi-periodic and high amplitude vibration, that is, there is a high order harmonic component in addition to the main frequency. The drag coefficient and lift coefficient of the eight-prism and twelve-prism is poor in single periodicity.
Fig. 15Time histories of the drag coefficient and lift coefficient for different prisms
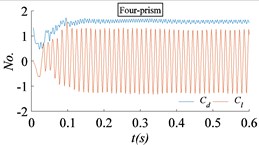
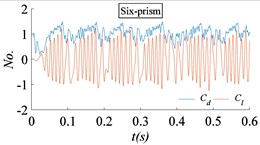
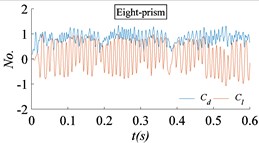
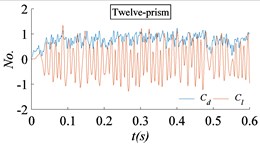
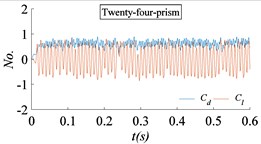
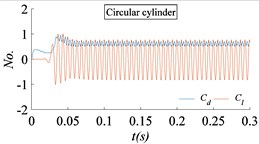
Fig. 16The power spectral density (PSD) of lift coefficient for different prisms
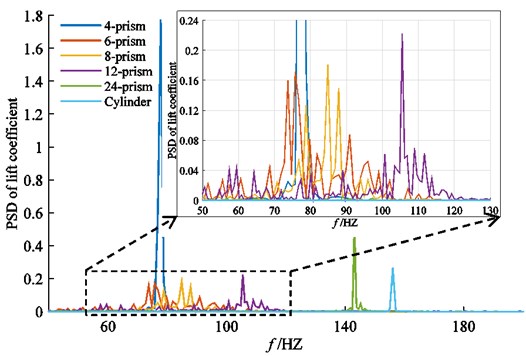
As shown in Fig. 15, the fluctuating hydrodynamics time histories of six-prism, eight-prism and twelve-prism are irregular and exhibit stochastic fluctuation characteristics. Therefore, statistical methods are needed to obtain hydrodynamics parameters such as mean value and fluctuating RMS, so power spectrum analysis is needed to obtain the frequency domain characteristics. In order to eliminate the influence of initial calculation on the calculation results, the first 1/6 part of hydrodynamics lift and drag time history is eliminated, that is, it is not involved in hydrodynamics statistical analysis and frequency domain analysis. The power spectral density analysis of the lift coefficient time history is shown in Fig. 16.
In this paper, the of global maximum peak is defined as the frequency of main vortex shedding and the corresponding is defined as the Number of main vortex shedding. As shown in Fig. 16, with the number of edges increasing, the frequency of vortex shedding is also gradually close to the circular cylinder. And the power spectra density of lift coefficients time histories for four-prism twenty-four-prism and cylinder are single peaks, respectively 77.78 Hz, 143.1 Hz 156.67 Hz. There are many obvious peaks in the power spectra density of lift coefficients time histories for six-prism, eight-prism and twelve-prism. They are 73.74 Hz, 90.91 Hz, 75.76 Hz; 78.79 Hz, 84.85 Hz, 87.88 Hz; 108.9 Hz, 105.5 Hz. It can be seen that there are many frequencies of the vortex shedding for six-prism, eight-prism and twelve-prism projectile, that is, the energy of vortex shedding is not gathered at one frequency but concentrated in a frequency band. The vortex shedding frequency of six-prism and eight-prism is multiple and more dispersed than four-prism, twenty-four-prism and cylinder. Therefore, it is difficult to cause the flow induced structural vibrations for six-prism and eight-prism. Although there are multiple vortex shedding frequencies for twelve-prism, they are too concentrated. In the power spectral density of six-prism, eight-prism and twelve-prism, there are also many small peaks, which are obviously lower than those frequencies and probably also the frequency of vortex shedding. In addition, the average lift of each prism is very small, so the average lift can be treated as zero.
The average drag coefficient and the Strouhal number of the cylindrical projectile with different flow velocity are shown in Fig. 17. The average drag coefficient decreases with the increase of the Reynolds number, and the Strouhal number increases with the increase of the Reynolds number. This is consistent with the experimental results in the Ref. [1]. After 9.96×10⁶, the average drag coefficient decreases slowly, and the Strouhal number increases slowly. Under the premise of satisfying the shrapnel power radius, scheme H2 should be selected first in engineering design.
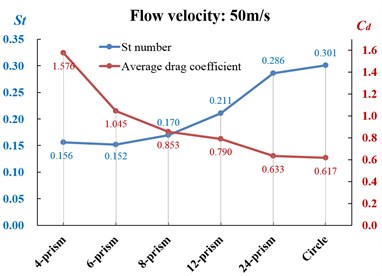
The average drag coefficient and the Strouhal number of the prism projectile with different cross-sections are shown in Fig. 18. With the edges number of cross-section increasing, the average drag coefficient decreases, and the Strouhal number increases. Combined with the vibration frequency spectrum analysis of the lift and drag coefficient in Figs. 14-15, and considering the factors such as drag reduction, the power of shrapnel and avoiding resonance, the projectile with octagon cross-section is more suitable for engineering applications.
Fig. 17Cylinder’s Cd and St with different Re
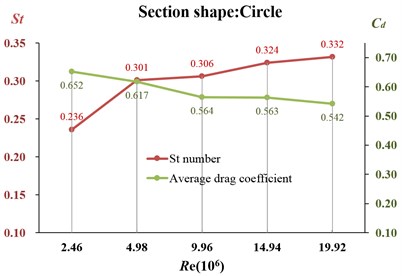
Fig. 18Cd and St with different section shape
4. Conclusions
In this paper, two-dimensional numerical simulations are carried out to study the flow around the projectile with different cross section shapes under the condition of special underwater trajectory. The main conclusions are as follows:
1) Regarding circular cylinder, a regular vortex street is formed at flow velocity changing from 25 m/s to 200 m/s. And when flow velocity is 25 m/s, the regular vortex street does not match the experimental data in the Ref. [1], but is in good agreement with the numerical simulation data obtained by LES in the Ref. [10]. With the number of the cross-section edge increasing, the average drag coefficient increases. The Strouhal number increases with the increase of the number of the cross-section edges and increases with the flow velocity increasing. When the flow velocity increases from 100 m/s to 200 m/s, the decreases very little. Therefore, under the premise of satisfying the shrapnel power radius, the smaller dispensing velocity should be adopted.
2) After the full development of the flow field, the frequency of the vortex shedding of the four-prism, twenty-four-prism and cylindrical projectile are single and fixed, which may cause the projectile to resonate and deviate from the predetermined trajectory. Regarding six-prism, eight-prism and twelve-prism, the frequencies of vortex shedding are not fixed and tend to be multi-periodic and high amplitude vibration. Therefore, the projectile structure is difficult to cause resonance. Because the average drag coefficient of the eight-prism is smaller than the six-prism, and the vortex shedding frequency of twenty-four-prism is more concentrated than the eight-prism, therefore, the eight-prism projectile structure should be adopted as far as possible in the engineering design.
3) In the scheme H1, the simulation results are different from the experimental data [1]. Although the Reynolds number of the scheme F1 and the Ref. [1] is the same, but the conditions of the medium and the cylinder diameter are different, it is necessary to carry out specific experimental research. This paper has a preliminary reference value for engineering design of anti-torpedo shrapnel under the water. Then, the specific combination optimization test of the projectile and the shape of the bullet need executing. Finally, the experimental verification will be carried out.
References
-
Schlichting Hermamm, Klaus Gersten Boundary-Layer Theory 8th Revised and Enlarged Edition. Springer, 2000.
-
Achenbach E. Distribution of local pressure and skin friction around a circular cylinder in cross-flow up to Re = 5×10⁶. Journal of Fluid Mechanics, Vol. 34, Issue 4, 2006, p. 625-639.
-
Yokuda S., Ramaprian B. R. The dynamics of flow around a cylinder at subcritical Reynolds numbers. Physics of Fluids A: Fluid Dynamics, Vol. 2, Issue 5, 1990, p. 784-791.
-
Li Yanling, Su Zhong 3D numerical simulation of flow over a circular cylinder at high Reynolds number using DES method. Journal of China University of Meteorology, Vol. 24, Issue 4, 2013, p. 364-369.
-
Zhu Zhiwen Feasibility analysis of 2-D RANS simulations for of circular cylinders aerodynamics at high Re number. Journal of Vibration and Shock, Vol. 32, Issue 7, 2013, p. 98-101.
-
Deng Xiaobing Large Eddy Simulation of Incompressible Turbulent Flow. China Aerodynamics Research and Development Center, 2008.
-
Kravchenko A. G., Moin P. Numerical studies of flow over a circular cylinder at ReD= 3900. Physics of Fluids, Vol. 12, Issue 2, 2000, p. 403-417.
-
Breuer M. A challenging test case for large eddy simulation: high Reynolds number circular cylinder flow. International Journal of Heat and Fluid Flow, Vol. 21, Issue 5, 2000, p. 648-654.
-
Hao Peng, Li Guodong, Yang Lan, et al. Large eddy simulation of the circular cylinder flow in different regimes. Chinese Journal of Applied Mechanics, Vol. 29, Issue 4, 2012, p. 437-443.
-
Zhan Hao, Li Wanping, Fang Qin Han, et al. Numerical simulation of the flow around a circular cylinder at varies Reynolds number. Journal of Wuhan University of Technology, Vol. 30, Issue 12, 2008, p. 129-132.
-
Li Tian, Zhang Jiye, Zhang Weihua, et al. Vortex mode of vortex- induced vibration with a 2-dimensional elastic circular cylinder. Acta Aerodynamica Sinica, Vol. 28, Issue 6, 2010, p. 689-695.
-
Hu Wenrong, Tong Binggang, Ma Huiyang Numerical simulation of periodically deforming circular cylinder. Acta Aerodynamica Sinica, Vol. 21, Issue 4, 2003, p. 424-431.
-
Spalart P. R., Jou W. H., Strelets M., et al. Comments on the feasibility of LES for wings, and on hybrid RANS/LES approach. Advances in DNS/LES, 1997.
-
Xu Changyue, Wang Conglei, Sun Jianhong Large eddy simulation of shock-wave/turbulence interaction in the transonic flow over a circular cylinder. Acta Aerodynamica Sinica, Vol. 30, Issue 1, 2012, p. 22-27.
-
Qin Q. W., Liu X. B., Liu Q. K., et al. Numerical calculation of flow over circular cylinder at high supercritical Reynolds number. Engineering Mechanics, Vol. 33, Issue 6, 2016, p. 18-22.
-
Travin A., Shur M., Strelets M., et al. Detached-Eddy simulations past a circular cylinder. Flow Turbulence and Combustion, Vol. 63, Issues 1-4, 2000, p. 293-313.
-
Ong M. C., Utnes T., Holmedal L. E., et al. Numerical simulation of flow around a smooth circular cylinder at very high Reynolds numbers. Marine Structures, Vol. 22, Issue 2, 2009, p. 142-153.
-
Tamura T., Miyagi T. The effect of turbulence on aerodynamic forces on a square cylinder with various corner shapes. Journal of Wind Engineering and Industrial Aerodynamics, Vol. 83, Issue 1, 1999, p. 135-145.
-
Yoon D. H., Yang K. S., Choi C. B. Flow past a square cylinder with an angle of incidence. Physics of Fluids, Vol. 22, Issue 4, 2010, p. 1419.
-
Park C. W., Lee S. J. Effects of free-end corner shape on flow structure around a finite cylinder. Journal of Fluids and Structures, Vol. 19, Issue 2, 2004, p. 141-158.
-
Gu J. Y., Yang J. M., Xiao L. F. Study on vortex induced motion of two typical different cross-section columns. Journal of Ship Mechanics, Vol. 18, Issue 10, 2014, p. 1184-1194.
-
Yao Xiongliang, Wang Wei, Yang Nana, et al. Experimental research of characteristics of flow past regular octagon structure with variable cross-section at high Reynolds numbers. Journal of Harbin Engineering University, Vol. 36, Issue 10, 2015, p. 1313-1319.
-
Jiang Wenlu, Ma Feng, Wang Shushan Feasibility analysis of underwater submunition group defense against torpedo. Torpedo Technology, Vol. 23, Issue 5, 2015, p. 374-378.
-
Stephen B. P. Turbulent Flows. Cambridge University Press, England, 2010.
About this article

The authors would like to acknowledge the financial supports from the National Natural Science Foundation of China (Grant No. 11372136), the Special fund for basic scientific research of Central University (Grant No. 30916011306) and the Postgraduate Research and Practice Innovation Program of Jiangsu Province (Grant No. KYCX17_0386).
