Abstract
This paper deals with dynamic tests of the building with diesel generator and the process of determining the cause of the cracks in its walls. After initial measurements and FEM analysis, it was assumed that vibrations propagate to the structure through the base of the generator. Therefore, it was recommended to apply an elastic antivibration layer at the supporting base of the generator. However, the problem with cracks persisted and it was necessary to perform additional tests and analysis. Finally, acoustic simulation was performed and provided promising results.
1. Introduction
Diesel generators combine a diesel engine with an electric generator and they are used as a backup power sources. They are mainly located outside, however, sometimes a generator must be placed in a building because of the local conditions. In these cases, it is very important to consider dynamic characteristics of the generator in design process of the building. The improper design (dynamic characteristics of building and generator are similar) can cause, for example, emergence of cracks.
Nowadays, these structures can be effectively monitored and their maintenance can be planned using dynamic measurements. For example, Structural Health Monitoring (SHM) or Operational Modal Analysis (OMA) have used this effective tool [1-3].
2. Description of the structure
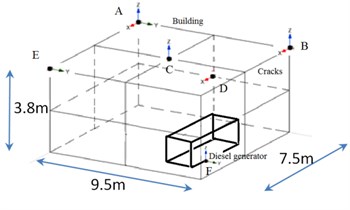
The diesel generator has been placed into the building with ground plan dimensions about 7.5×9.5 m. The structure of the object is made of bricked masonry walls up to a height of 3.7 m with one inner wall which splits the building into two rooms. The lintels are constructed with the Porotherm system [4], apart from two lintels above the entrance door, which are made of reinforced concrete. The roof is designed as a semi-prefabricated Porotherm ceiling system.
A diesel generator is placed in one of the two rooms and is used as a backup power source. Therefore, it has three operational states: startup, ticking over and full operation of the generator.
3. Numerical model
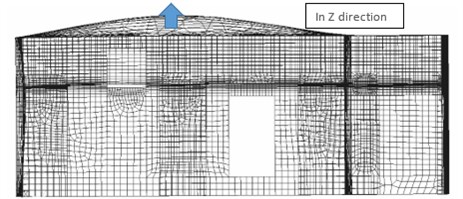
A numerical model has been developed before execution of an experimental test [5]. The FEM model has been created by shell elements with two different types of material concrete and masonry-walls. Some mode-shapes and their natural frequencies (Fig. 1) have been obtained after the preparation of the FEM model. Thanks to that, the best locations for sensor setup has been detected for the further measurements (Fig. 2).
Fig. 1The first mode-shape (f= 13.37 Hz)
4. Experimental test
To find a cause of the cracks on the building, OMA has been done and ambient vibrations have been also acquired. The following hardware has been used for measurements: NI cRIO 9067, four I/O NI 9234 modules and PCB Piezotronics 393B31 or MMF KS901.100 accelerometers. The measurement system is described in [6], in more detail.
4.1. Measurement in 2017 – fixed supports of diesel generator
The first test was done in 2017. Accelerometers were mounted [6] during the measurement on the diesel generator (mainly MMF KS901.100) at point F. Besides that, eight accelerometers (PCB Piezotronics 393B31) were mounted at points A, B, C, D and E, respectively, to measure a response of the building (Fig. 2). Two operational states have been measured [7]: startup stage of the generator and operation of the generator at about 10 % of its power, but without full loading of the electrical system (generator ticking over).
The acceleration amplitudes reached a level when small cracks can start to emerge (Fig. 3). Therefore, it was recommended to apply an elastic shock absorber layer at the supporting base of the generator.
Fig. 2Sensor setup: a) scheme of all sensors, b) sensors at point A, c) sensor at point D
a)
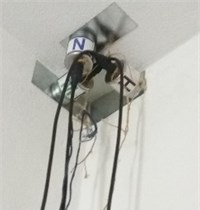
b)
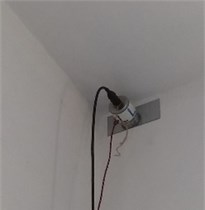
c)
4.2. Measurement in 2018 - elastic supports of diesel generator
The owner of the building adjusted the supports of the generator and added a layer of elastic material-shock absorber layer-with height of 9 cm under the steel base of the generator.
However, the problem with cracks persisted (Fig. 4) and it was necessary to perform additional tests a year later in 2018.
The same accelerometers at the same locations were used. This time, another two operational states were measured: startup stage (similar as in 2017) and full operation of the generator 100 % power. During full operation, a current withdrawal was changing, so the amplitudes of accelerations were changing accordingly (Table 2). Also, the response of the structure during full operation was different than during startup. Therefore, the spectrums were created from measured accelerations and to present the results, only the most important frequencies were selected. It is the reason why frequencies in Table 1 and Table 2 are different.
Fig. 3Evaluation of vibration effects on masonry structures according to [8]
![Evaluation of vibration effects on masonry structures according to [8]](https://static-01.extrica.com/articles/20347/20347-img5.jpg)
Fig. 4Cracks on the wall of the building
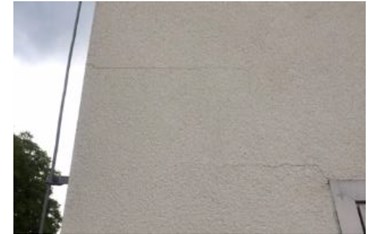
a) In 2017

b) In 2018
Table 1Measured peaks of acceleration (startup stage)
Measurement | Frequency [Hz] | |||
13.3 | 40.5 | 67.0 | 70.2 | |
Acceleration [m/s2] | ||||
2017 | 0.04 | 0.63 | 0.08 | 0.08 |
2018 | 0.04 | 0.42 | 0.06 | 0.06 |
The measured acceleration amplitudes during the startup stage of the generator decreased in comparison with the previous tests in 2017 (Table 2, Fig. 5). Therefore, we could state, that the elastic shock absorber layer under the base of the generator was effective.
However, the full operation state showed a new phenomenon. The effects on a structure caused by full operation cannot be compared with measurements done in 2017, because this operational state has not been measured before. In Table 2, the amplitudes from tests in 2018 are compared with those during generator ticking over (10 % current withdrawal) in 2017 (Fig. 3). Even if acceleration amplitudes during full operation are higher than during ticking over, it was assumed that it is not the cause of the cracks in the building. Therefore, it was necessary to continue investigating the problem.
Fig. 5Accelerations during startup stage
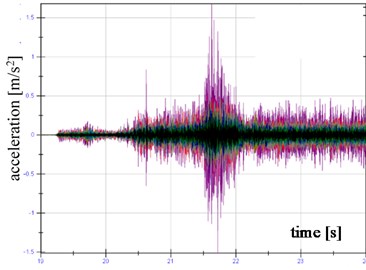
a) In 2017
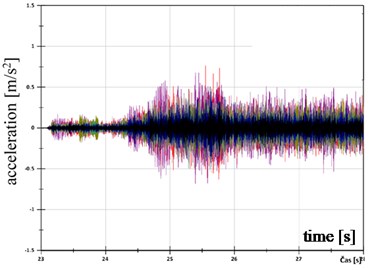
b) In 2018
Table 2Dependency between peaks of acceleration and percentage of the power (full operation)
Test | Power | Frequency [Hz] | |||
12.5 | 37.6 | 62.6 | 75.1 | ||
Acceleration [m/s2] | |||||
2017 | 10 % | 0.004 | 0.021 | 0.008 | 0.033 |
2018 | 48 % | 0.010 | 0.007 | 0.013 | 0.119 |
51 % | 0.012 | 0.057 | 0.011 | 0.116 | |
85 % | 0.013 | 0.052 | 0.017 | 0.108 | |
86 % | 0.012 | 0.046 | 0.018 | 0.106 | |
99 % | 0.005 | 0.022 | 0.009 | 0.106 | |
100 % | 0.005 | 0.030 | 0.013 | 0.106 | |
5. Numerical acoustic simulation
As it was mentioned above, the change in the supports of generator has decreased vibration effects on the building. However, the full operation of the generator produces significant noise. Because of that, a numerical simulation with acoustic pressure was performed. The following equation was used:
where is sound pressure level (SPL) in dB, represents the RMS sound pressure and is reference sound pressure, which is commonly considered as the value of 20 μPa. The SPL reached the value of 120 dB during the full operation. This value was used for the calculation of the corresponding sound pressure, which was further applied to the numerical model using harmonic analysis. Different phase shifts were considered on the different structural elements (walls, ceiling) according to their distance from the noise source. Three selected mode-shapes (Figs. 6-8) of the external wall with significant cracks and high acceleration amplitudes during the full operation were analyzed in more detail.
Considering the wall vibrates in several mode-shapes at the same time, each displacement which belongs to one of the three selected natural frequencies (Figs. 6-8) must be combined. We simplified the problem and added largest effects within this combination (Fig. 9). Therefore, the resulting greatest displacement caused by the acoustic pressure is about in hundredth of millimeters. Besides that, we approximately estimated the greatest values of acceleration which reached about 0.7 m/s2.
Fig. 6Maximum displacement in the Y direction and appropriate equivalent stresses from harmonic analyze (6th mode-shape)
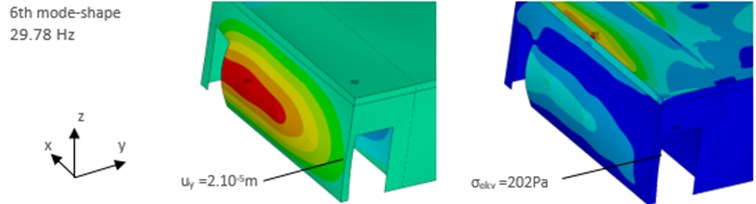
Fig. 7Maximum displacement in the Y direction and appropriate equivalent stresses from harmonic analyze (12th mode-shape).
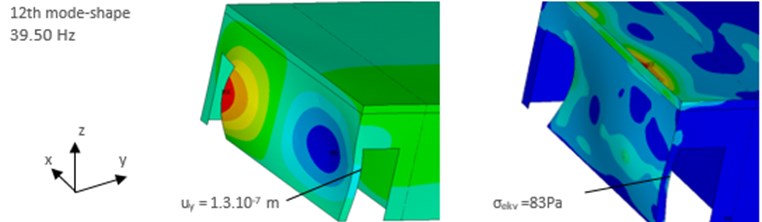
Fig. 8Maximum displacement in the Y direction and appropriate equivalent stresses from harmonic analyze (29th mode-shape).
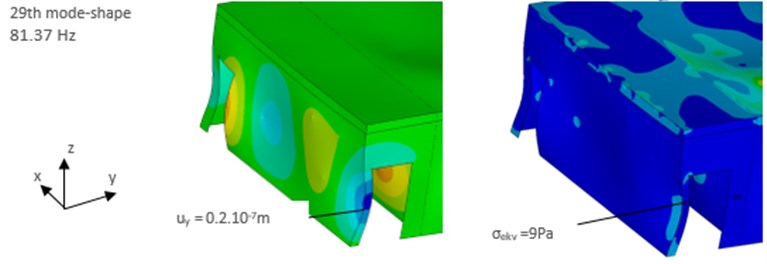
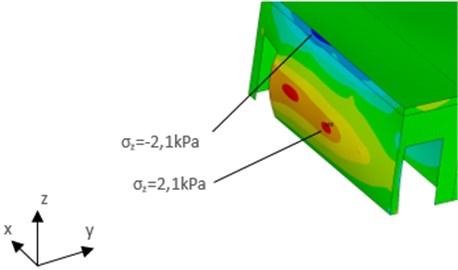
Fig. 9The maximum equivalent stresses (the combination of three mode-shape)
If we evaluate a value of 0.7 m/s2 at frequencies between 30 Hz and 75 Hz using [7, 8] then the possible effects can be classified in Category D, i.e., highly perceptible for people (and could be further investigated in accordance with [9]) and permissible for buildings. However, it can cause emerging of small cracks in the masonry during this stage.
6. Conclusions
The paper presented OMA performed on a building with diesel generator to determine the cause of the cracks in the walls. After adjusting the supports of the generator with a layer of elastic material in 2017, the problem did not cease. Therefore, we tried to perform the harmonic analysis using acoustic pressure. Finally, the results from the harmonic analysis revealed that some cracks can be also caused by acoustic pressure during the full operation state of the generator.
References
-
Strauss A. Assessment of engineering structures and natural hazards. Structure and Infrastructure Engineering, Vol. 5, Issue 4, 2009, p. 265-266.
-
Torres W., et al. Operational modal analysis and FE model updating of the Metropolitan Cathedral of Santiago, Chile. Engineering Structures, Vol. 143, 2017, p. 169-188.
-
Broch J. T. Mechanical Vibration and Shock Measurements. Brüel & Kjaer, Denmark, 1984.
-
Porotherm – Wall Solutions. Wienerberger, 2014.
-
Kamp J. V. Acquiring field data and creating vibration tests. Vibroengineering Procedia, Vol. 14, 2017, p. 379-381.
-
Ároch R., Sokol M., Venglár M. Structural health monitoring of major Danube bridges in Bratislava. Procedia Engineering, Vol. 156, 2016, p. 24-31.
-
Sokol M., Tvrdá K. Dynamics of Structures. STU in Bratislava, Bratislava, Slovakia, 2011, (in Slovak).
-
Eurocode 1 ENV 1991-5 Basis of Design and Actions on Structures – Part 5 Actions Induced by Cranes and Other Machinery. CEN, Brussel, 1998.
-
Koczwara A. K., Stypuła K. Human perception of vibrations according different assessment methods. Vibroengineering Procedia, Vol. 13, 2017, p. 211-216.
-
Min X. G., Wan T., Liu Z. L. A Modal analysis of new-type coupling discs of generator set. AER-Advances in Engineering Research, Vol. 31, 2015, p. 235-238.
About this article

This paper was supported by the Grant agency of the Ministry of Education, Science, Research and Sports of the Slovak Republic VEGA Nr. 1/0749/19.
