Abstract
Advances in modern medical imaging technology and three-dimensional modeling technology provide basic support for the establishment of individual cardiovascular models, which can promote the close integration of cardiovascular hemodynamics research. In this paper, the fluid-solid coupling technology is used to obtain the numerical simulation results of blood on rigid and elastic vessel walls. The results show that the elastic deformation of the wall has an important influence on the hemodynamic characteristics. The peak velocity in elastic blood vessel is about 3.7 % higher than that in rigid blood vessel. The extremum of fluid pressure in elastic blood vessel is about 9.1 % higher than that in rigid blood vessel.
1. Introduction
In previous studies of hemodynamics, the vascular wall was regarded as a rigid wall, but the elastic deformation [1] ability of the artery wall was not considered. Although the rigid boundary simplifies the calculation to some extent, under physiological conditions, the change of vessel diameter can reach 10 % order of magnitude, which will inevitably have a significant impact on blood flow [2]. Studying the fluid-structure interaction of cardiovascular system has important clinical significance. In this paper, the stenosed artery wall is regarded as an elastic wall with elastic deformation ability. Based on the establishment of fluid-solid coupling mathematical model, the effect of elastic deformation of the artery wall on blood flow is studied.
2. Physical model of blood fluid dynamics
2.1. Fluid-solid coupling mechanism
Generally speaking, fluid-structure coupling problems can be divided into two categories according to their coupling mechanism [3]. In one case, the fluid and solid are partially or totally overlapped without a clear boundary or interface. Another case is that the coupling occurs at the interface between fluid and solid. Variable exchange occurs between fluid and solid through the coupling interface, including pressure and displacement. The deformation and movement of solid interact with the change of flow field, which is studied in this paper.
The description of fluid-solid interaction is based on the basic principles of continuum mechanics. There are two classical methods for describing the motion of finite element meshes in continuum dynamics, including Lagrange method and Euler method. The basic feature of Lagrange’s description is that the mesh nodes are fixed on the material points, and when the material points move, the mesh nodes also move together. Therefore, this method is very convenient for describing the moving boundary or the moving interface. However, if the deformation is large enough, serious mesh distortion will occur, which will lead to a sharp decline in the approximation accuracy of the element, and even lead to the value of Jacobian determinant in coordinate transformation equal to zero or negative, which will stop the calculation or cause serious local error. The basic feature of Euler’s description is that the initial spatial position of the mesh remains unchanged throughout the analysis process. The finite element node is the spatial point, and its position is always unchanged. Therefore, there is no mesh entanglement problem in describing large deformation. So, it is chosen and used in analysis of hydrodynamic characteristics of blood.
2.2. Establishment and analysis of model
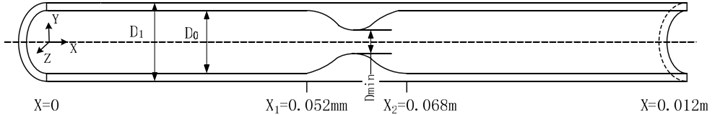
It is assumed that the stenosis of the vascular segment is axisymmetric [4]. The vascular wall is regarded as an isotropic elastic wall. Generally, the intravascular diameter of non-strictured site of is 0.008 m, external diameter of is 0.01 m. The total length of the analyzed vessel is 0.012 m. In order to prevent the blood vessel from being dragged by the fluid, both ends of the blood vessel are fixed. The governing equations of ALE method are continuous equation and incompressible N-S equation.
Fig. 1Sectional view of three-dimensional model of blood vessel
2.3. Construction of simulation model
The fluid dynamics analysis is mainly accomplished by ANSYS software, of which principle is finite element calculation [5]. ANSYS uses ALE method to simulate fluid-structure interaction, when the mesh becomes seriously distorted or ALE mesh fails to deform. Then, the mesh will be re-divided to solve the moving boundary problem. Fluid-solid coupling solver solves independent fluid and solid equations, and transfers fluid force, displacement and velocity of solid. In each time step, the algorithm cycles continuously until convergence [6]. In this paper, the bidirectional coupling method is used to solve different coupled fields iteratively, and the coupling media exchange between fields is used. Coupling information, coupling iteration between each time step, convergence and then forward. Closer grids are needed near the fluid-solid coupling wall and narrow part of the fluid, as shown in Fig. 2.
Fig. 2Mesh generation of fluid and solid models
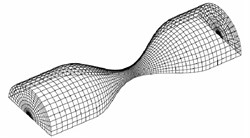
a) Flow mesh diagram

b) Solid local mesh diagram
3. Simulation calculation and result analysis
3.1. Boundary conditions and initial conditions settings
The wall is considered as both rigid and elastic, then the flow field, velocity field and shear stress of blood vessels can be calculated under these two conditions. In order to verify the rationality of the mesh, the same initial conditions, boundary conditions and physical parameters as those in reference [7] are adopted when the wall is regarded as an elastic wall. Set boundary conditions and initial conditions as follows: the elastic modulus of the pipe wall is 2×10⁶ Pa, Poisson’s ratio is 0.495, blood density is 1×10³ kg/m3, viscosity is 4×10⁻³ kgm-1s-1, the inlet pressure is 1.3×10⁻⁴ Pa, the outlet pressure is 2.6×10⁻⁴ Pa.
3.2. Analysis of flow field results
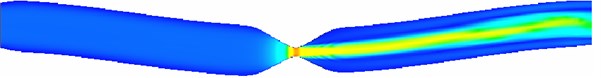
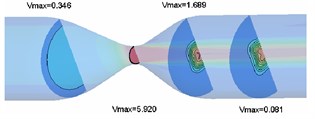
Flow field nephogram of rigid vascular model and magnified 5-fold variable nephogram of elastic vascular model in rigid vascular model are shown in Fig. 3 and Fig. 4 respectively. It can be seen that because the wall does not deform, the fluid flow in the rigid pipe is stable and there is no flow migration [8]. The fluid in the elastic blood vessel moves slightly to the horizontal side after passing through the narrow zone, and the blood vessel bends under the action of viscous dragging force.
Because of the elastic deformation of the elastic blood vessel wall under the action of blood flow, the wall of the narrow area shrinks, and the diameter of the passage decreases, the flow velocity of the narrow throat is slightly higher than that of the rigid throat. Whether rigid or elastic, the velocity near the downstream wall of the narrow zone is negative, and there is a large range of reflux.
Fig. 3Flow field nephogram of rigid vascular model

Fig. 4Magnified 5-fold variable nephogram of elastic vascular model
From Fig. 5, it can be seen that both rigid and elastic vessels have the highest peak fluid velocity on the surface of 0.06 m. The peak fluid velocity in elastic vessels is 5.920 m/s, which is slightly higher than that in rigid vessels. The fluid velocity decreases rapidly after passing through the narrow area. The peak flow velocity in elastic vessels is about 3.7 % higher than that in rigid vessels.
Fig. 5Profile velocity distribution (x= 0.052, 0.060, 0.068, 0.076 m)
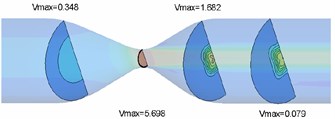
a) Rigid vascular model
b) Elastic vascular model
3.3. Analysis of pressure field results
Pressure contours of rigid and elastic intravascular sections are shown in Fig. 6 and Fig. 7, respectively. According to the analysis results, the pressure at the inlet and outlet is positive, so the pressure in most areas of the pipe is positive. However, due to the large pressure difference between the inlet and outlet and severe local stenosis (up to 78 %), negative pressure appears in the stenosis area and downstream area, and pressure changes are concentrated near the stenosis throat. For the rigid wall, the minimum fluid pressure appears near the wall of the narrow throat (0.060 m), and the extreme value of pressure is –5.95×10⁻³ Pa. For the elastic wall, the minimum section pressure appears at the horizontal side wall near the narrow throat, and the extreme value of pressure is –6.69×10⁻³ Pa. The extremum of fluid pressure in elastic blood vessel is about 9.1 % higher than that in rigid blood vessel. The extremum of fluid pressure in elastic wall is slightly larger than that in rigid wall, which is due to the contraction of elastic wall in narrow area and the decrease of blood vessel diameter, resulting in the increase of negative pressure.
Fig. 6Pressure contour of rigid vascular model
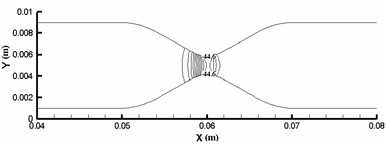
Fig. 7Pressure contour of elastic vascular model
3.4. Analysis of vessel wall displacement
The elastic deformation of vessel wall occurs under the action of inertia force and fluid force [9]. This deformation directly acts on the fluid and changes the flow field distribution of the fluid, which causes the fluid in the blood vessel to migrate to one side and aggravates the asymmetry of the flow, which leads to the change of the hydrodynamic distribution of the vessel wall, and then affects the deformation of the vessel wall. Therefore, under this fluid-structure interaction, the blood vessel is no longer a straight blood vessel, but a bending deformation. Define as the angle that is between the analyzed plane and the plane. When is 0°, 90° and 180°, the vessel wall displacement along direction can be calculated as shown in Fig.8. Vascular diameter dilation was most obvious near the entrance, reaching 8 %. From the three displacement increment curves, it can be seen that the wall deformation is not symmetrical. Starting from 0.005 m, the displacement increments of the three curves are all negative, indicating that the wall of the pipe moves downward due to the viscous dragging of the fluid. Although the migration is only a very low order of magnitude, it is enough to cause the fluid in the pipe to migrate to one side, which aggravates the flow asymmetry.
Fig. 8Vascular wall displacement in different directions
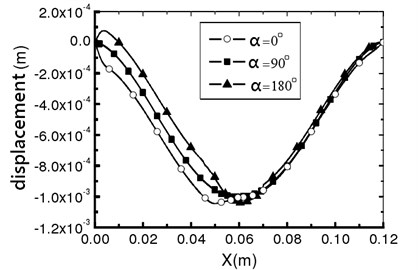
Fig. 9Vessel wall shear stress distribution
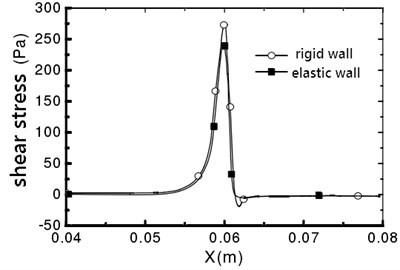
a)0°
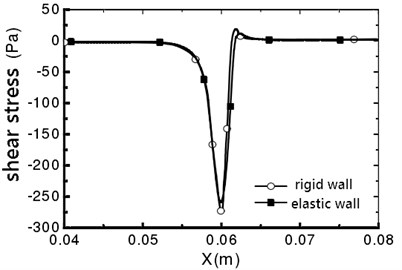
b)180°
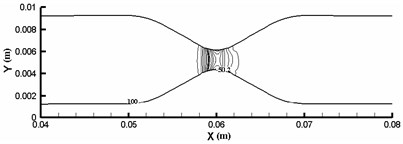
3.5. Analysis of vessel wall shear stress
The maximum shear stress appears in the narrow throat, which is due to the maximum shear strain rate in the narrow throat [10]. For a rigid wall, the fluid flow in the pipe is symmetrical, and no offset occurs. The vessel wall shear stress distribution is shown in Fig. 9. It can be seen that the distribution of wall shear stress is consistent. From 0.062 m, the shear stress is negative, which indicates that the downstream flow of throat is separated, and reflux occurs. For the elastic wall, the peak value on the line that 0° is 241.4 Pa, which is 11.5 % smaller than the peak value of the shear stress on the rigid wall.
4. Conclusions
This paper introduces the theory of fluid-structure coupling and explains the ALE method of fluid-structure coupling. The numerical simulation results of the same model under rigid and elastic wall conditions are compared and analyzed. The results show that the elastic deformation of the wall has an important influence on the hemodynamic characteristics. Compared with the rigid model, the blood flow rate and negative pressure in the narrow throat of the elastic model increased slightly, while the wall shear stress decreased slightly.
References
-
Yue S., Liu Z. Elastic deformation analysis of conical blood vessel in the blood flow state. Chinese Journal of Medical Physics, Vol. 33, 2017, p. 155-166.
-
Bibaswan D., Sekhar Raja G. P. A theoretical study on the elastic deformation of cellular phase and creation of necrosis due to the convection reaction process inside a spherical tumor. International Journal of Biomathematics, Vol. 9, 2016, p. 273-306.
-
Dani K. A., Latour L. L., Warach S. Hyperintense vessel sign on fluid-attenuated inversion recovery MR imaging is reduced by gadolinium. AJNR American Journal of Neuroradiology, Vol. 33, 2012, p. 112-124.
-
Kamla Y., Bouzit M., Ameur H. Effect of the inclination of baffles on the power consumption and fluid flows in a vessel stirred by a Rushton turbine. Chinese Journal of Mechanical Engineering, Vol. 30, 2017, p. 1008-1016.
-
Kalinichenko V. A., Soe A. N., Chashechkin Y. D. Vortex-induced damping of fluid oscillations in a rectangular vessel. Fluid Dynamics, Vol. 50, 2015, p. 155-166.
-
Dong F., Guo G. L. Diesel engine cooling water cavity structure optimization analysis based on the heat flow directly coupling method. Civil Engineering Technology, Vol. 3, 2015, p. 77-84.
-
Tang D., Yang C., Huang Y. Wall stress and strain analysis using a three-dimensional thick-wall model with fluid-structure interactions for blood flow in carotid arteries with stenoses. Computers and Structures, Vol. 72, 1999, p. 341-356.
-
Cho C. Influencing factors of venous blood flow field for venous indwelling based on finite element method. General Nursing, Vol. 25, 2002, p. 215-220.
-
Sen A. Adaptive response surface based efficient finite element model updating. Finite Elements in Analysis and Design, Vol. 80, 2014, p. 33-40.
-
Shi Q. Finite element analysis of vascular stents based on ANSYS software. Journal of Biomedical Engineering, Vols. 60-61, 2015, p. 909-927.
About this article

The paper is supported by Doctoral Research Fund (2017Y22).
