Abstract
Targeting at the ambient noise test of a large-scale fan, a sparse measurement method is proposed to deal with placing test-points. According to the acoustic and propagational characteristics of fan noise and the principle of sound pressure test, the sparsification of test-points is presented for optimizing the microphone locations. The outdoor ambient sound pressures of fan noise are tested at the sparse points and processed by time–frequency refinement analysis. As results of that, sparse measurement can obtain the messages of sound field effectively and thus get a comprehensive evaluation on the noise. This study extends the application of sound pressure test and provides a base for quantitative sparse measurement on ambient noises.
1. Introduction
Fans are widely used in industries and generate noise pollution onto surrounding environment. Quantitative measurement on the ambient noise is important for its noise control. A national standard GB/T 2888 [1] of fan noise measurement provides the procedure of sound pressure measurement and positioning test-points. Using precise sound level meter, Ma [2] measured the noises of the fans at two rotating speeds in terms of National Standard 2203, and found the key factors affecting the noise, especially the fan speed. Xing [3] suggested the noise limits and a reasonable method of improving the noise measurement of mine ventilators, which selected A-weighted sound pressure level as noise criterion, and located the test-point on the horizontal plane of the fan center in direction of 45 degrees from the central line of the fan and 1 m away from the center of the fan intake. According to National Standard GB/T 2888, Zhang [4] measured and analyzed fluidized fan noise that is centered at 250 Hz and 1 kHz and generated primarily from airflow and motor. Cui [5] studied the high-speed centrifugal fans with small-scale and used the commonly-used parameter to evaluate the quality of the fan and verified the feasibility of using for the quality estimation by the experiments in semi-anechoic chamber.
Although sound pressure measurement is widely used in fan noise test, its precision is strongly affected by fan type, location of test-points and background noise. Therefore, it should be well improved further. In this study, a sparse measurement method is proposed here. In terms of spatial sparsification characteristics of sound field, it designs reasonable sparsification on test-points for the measurement at first. Then, the experiment on a large fan is implemented to verify its effectiveness. The study is to extend the application of sound pressure measurement and thus provide a base for quantitative sparse measurement of fan noise.
2. Sparse measurement
2.1. Experimental setup
Sparse measurement applies sparse acoustic signal to sound field measurement based on spatial sparsity and optimum sparsification for locating the test-points. Firstly, the test area is gridded to form a basic test-point matrix. According to the principle of sound pressure measurement, the test area is meshed equally to form grid points, and the mathematical model for the position coordinate matrix of the grid points is established. Secondly, the location model of test-points is optimized by matrix operation of the constraint conditions of the test-points and sound field behaviors, so as to design the reasonable sparse positions. This procedure is shown in Fig. 1, where, represents the matrix of sparse points, which is the optimized vector of test-points, and , and are the sparse matrix, basic matrix of test-points and degree vector, respectively. The number of non-zero components in is called sparsity. They are transformed as follow:
In Eq. (1), and are two critical parameters for optimizing sparse test-points.
Fig. 1Mathematical optimization procedure of sparsification
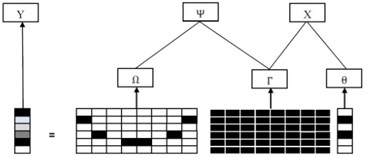
Fig. 2Sparse measurement matrix
2.2. Sparse measurement matrix and sparsity
A sparse measurement matrix is obtained by optimizing the constraints of structure and behavior in terms of the model of fundamental test-points. The procedure includes: a) establishing the matrix model of fundamental test-points; b) setting the optimum conditions of structure and behavior; c) computing the optimum matrix. This procedure transforms the layout of test-points into the simple and fast optimizing operation of test-point matrix. The sparse measurement matrix is shown in Fig. 2.
2.2.1. Establishing matrix model of fundamental test-points
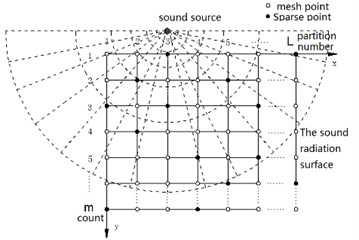
According to the characteristics of sound radiation and propagation and sound pressure measurement, virtual grids are set in the cardinal area of acoustic radiation. The test area is gridded to form evenly spaced gridding points. By rule of array aperture, the spacing is set within ( is the minimum sound wavelength). Subsequently, the target acoustic radiating zone is divided into basic meshes, of which the cross points are set as grid points and selected as the microphone locations.
Coordinating the grid points: The two-dimensional coordinate system is set for the basic grids. Assume that the grid points are distributed in M-row by L-column, and each grid point is denoted by (, ). Then, the basic test-point matrix is expressed as:
In Eq. (2), the row and column of represent -axis of the point and the range variable, and the row and column of represent -axis of the point and the range variable, respectively.
The mathematical model above corresponds to a grid area consisting of zones with grid points. The total number of grid points is . Then, the parameters of structure and behavior are set up, and the microphones are positioned at J points selected from G grids.
2.2.2. Constraint conditions of structure and behavior
1) Implement comprehensively acquisition of acoustic field and locate the test-point uniformly. The same number of test-points are located on equal area.
2) Ensure each microphone test effectively and optimize the test positions quantitatively by sound pressure and signal-to-noise ratio (SNR).
At first, the sound pressure at sound source is set as reference value, , with which the sound pressure most far from the source is evaluated in a reasonable distance of attenuation. The sound pressure at farthest point, . Where, is Euclidean distance between the nearest and farthest points, if greater than or equal to 6 dB, the test-point is invalid.
Secondly, compute the SNR at different points by , and denote the effective power of the signal received by the th microphone and its received noise, respectively. Set their values to constrain the points. Suppose the noise at each point is equal, and the maximum SNR of a single microphone is dB, then, the microphone position at this point is valid as dB, and thus to be kept.
2.2.3. Computing the optimum matrix
Since the sparsity indicates the number of points measured from equal number layout on each area, the number of sparse test-points can be determined from uniform grids. By experience, 2-3 test-points are selected, i.e., set the sparsity as 2-3. The total number of test-points is determined by the number of partitioned zones. In terms of above constraints and matrix operations, the sparse measurement matrix can be obtained as:
where, each pair of non-zero point-coordinates represents a microphone position.
3. Field measurement of large-scale fan
3.1. Working conditions
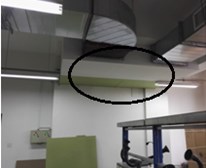
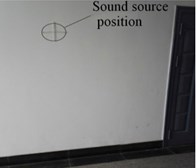
The sound source is located at 2 m away from the ground and 1.5 m away from the door of the fan room. The working conditions of field measurement are shown in Fig. 3.
Fig. 3Sound source position of inside and outside door
3.2. Requirements on measurement apparatus
A fan is generally a steady sound source. The microphone B&K1/2-inch40 AI, displacement sensor LANCE and data acquisition system SCADASIII305 are implemented to collect outdoor noise. The vibro-acoustic test & analytical platform LMS Test.lab is employed to process and analyze the tested data. Where, the sensitivities of the microphone and displacement sensor are set as 46.34 mv/pa and 497.6 mv/g, respectively, and the test-frequency is set as 0.2-2500 Hz.
The measurement apparatus, calibrating instruments and test-scheme are carried out strictly according to national standard GB 22337-2008, entitled “Standards of Noise Emission into Social Living Environment”. The frequency-resolutions of noise and vibration are set identical to be 1 Hz, and all frequency-spectra are computed in 10 times of average.
3.3. Layout of sparse test-points
According to the working conditions and the characteristics of fan vibration and noise propagation, the maximum SNR of single microphone is set as 8 dB resulted from the proposed scheme of sparse measurement. Additionally, by the statistics and optimization of the test-points, the layout of test-points is sparsified as shown in Fig. 4. The two-dimensional coordinates of every sparse point are listed in Table 1. The distance between each pair of test-points should not be less than 5 m, and the distance from all test-points to the wall should not be less than 1 m.
Fig. 4Layout of sparse testing points
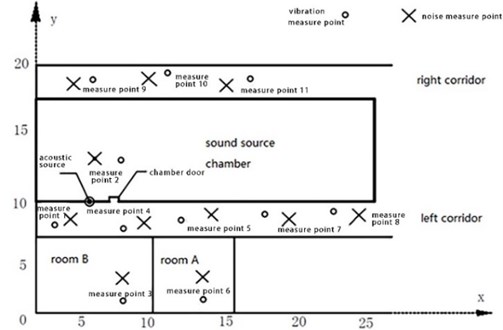
Table 1Coordinates of sparse test-points
Test-point | |||
1 | 3 | 8 | 0 |
2 | 6 | 13 | 0 |
3 | 7 | 3 | 0 |
4 | 9 | 8 | 0 |
5 | 14 | 9 | 0 |
6 | 13 | 3 | 0 |
7 | 19 | 8 | 0 |
8 | 24 | 9 | 0 |
9 | 4 | 18 | 0 |
10 | 9 | 19 | 0 |
11 | 14 | 18 | 0 |
3.4. Tested results
The vibrations and noises in different indoor and outdoor zones are tested at the sparse points, including linear and A-weighted sound pressure levels, 1/3-octave sound pressure distributions, sound pressure power and vibration spectra. The tested results are presented as follow.
(1) Tested results of indoor zone (Figs. 5-8).
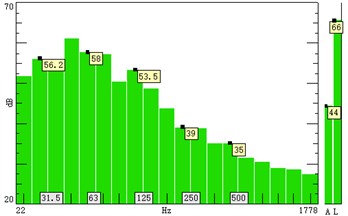
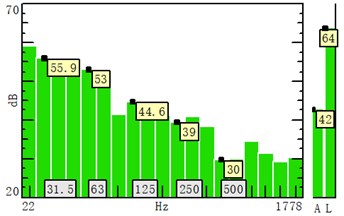
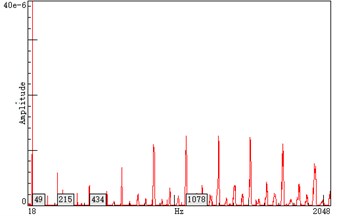
Figs. 5-7 show that, the indoor sound pressure level is 84 dB and 66 dB(A) at normal running state of the fan, which illustrates that the fan noise is primarily concentrated at low frequencies, see Fig. 5; The major 1/3 octave sound pressure levels are distributed on the low frequency bands, see Fig. 6; The dominant vibrational components are at the resonant frequencies with base frequency at 215 Hz, see Fig. 8.
(2) Tested results of outdoor zones on left and right sides of corridors (Figs. 9-11).
There are most frequent activities of people on both sides of corridors. They must be the critical test zones, for which 10 points are sparsely located. The tested results at point 4 on left side of corridor and point 10 on right side of corridor are chosen here to be compared and analyzed.
Fig. 9 shows that the A-weighted sound pressure levels at points 4 and 10 are 44 dB(A) and 42 dB(A) respectively, i.e., 2 dB(A) difference between the two points. Fig. 10 shows the distribution of 1/3 octave sound pressure levels at 10 second. The low-frequency 1/3 octave sound pressure level at point 4 is slightly higher than that at point 10. The little difference demonstrates that the fan noise is primarily dominated by the frequencies below 250 Hz. Fig. 11 compares the vibration spectra between the two points, which shows that the resonant vibrations are still prominent with base frequency 215 Hz, and the vibration at point 10 is slightly smaller, but the frequency-distribution on both sides is essentially identical.
Fig. 5Sound pressure level (A-weighted-red; linear-blue)
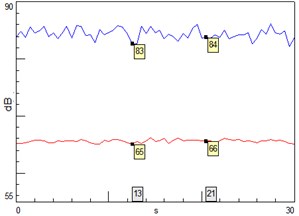
Fig. 6The 1/3-octave sound pressure le
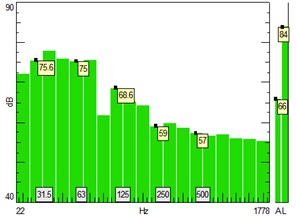
Fig. 7Sound pressure power spectrum
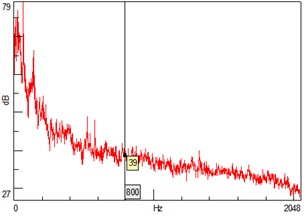
Fig. 8Vibration spectrum
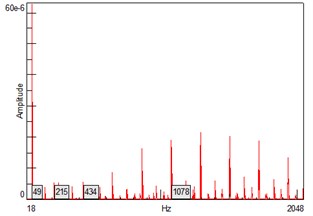
Fig. 9A-weighted sound pressure level on left and right sides of the corridors
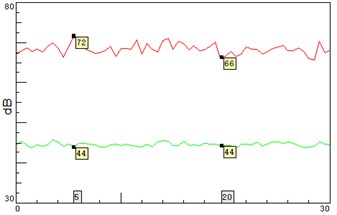
a) Point 4
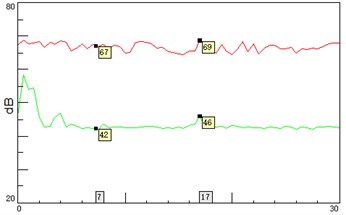
b) Point 10
Fig. 101/3-octave sound pressure level distribution on left and right sides of the corridors
a) Point 4
b) Point 10
Fig. 11Ground vibration spectrum on left and right sides of the corridors
a) Point 4
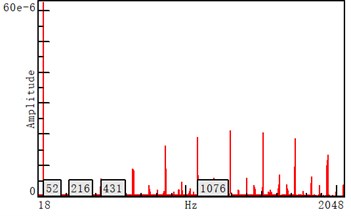
b) Point 10
4. Conclusions
This study targets at the measurement of outdoor fan noise. In terms of fan noise radiation characteristics, a sparse measurement method with sound pressure test has been proposed. Optimization of the sparse test-points on different zones of actual measurement field as well as the measurement and analysis of the ambient noise have been investigated. It concludes that:
1) The sparse test-points on different zones can be effectively used to locate the microphone positions to avoid the influence of background noise and accurately test the ambient noise of a fan, including its specific messages;
2) For the noise signals on different zones of a specific fan, the time-frequency refinement analysis has been implemented to obtain the linear, A-weighted and 1/3-octave sound pressure levels of the ambient noise. The tested data show that the sparse measurement method can make a comprehensive evaluation of ambient noise.
3) The sparse measurement method extends the applications of sound pressure method and provides a base for quantitative sparse measurement of ambient noises.
References
-
GB/T 2888-2008, Noise Measurement of Wind Turbines and Roots Blowers, 2008.
-
Ma Qing-Nian Measurement and analysis of noise characteristics of centrifugal fan. Fluid Engineering, Vol. 3, 1985, p. 38-41.
-
Xing Qing-Gui, Tang Chun-Xiao, Gong Jian Selection of noise index and measurement method for mine ventilator. Mine Construction Technology, Vol. 6, 1997, p. 39-41.
-
Zhang Dan-Dan, Su Tie-Xiong, Zhang Pei-Hua, et al. Noise control and frequency spectrum analysis of fluidization blower. Applied Energy Technology, Vol. 10, 2014, p. 1-4.
-
Cui Ding-Jun, Ian Craighead A. A New approach to assess the quality of small high-speed centrifugal fans using noise measurement. International Journal of Rotating Machinery, Vol. 5, Issue 2, 1999, p. 147-153.
-
Mehdi B. D., Hamid R. A., Mohammad R. T. Sound source localization using compressive sensing-based feature extraction and spatial sparsity. Digital Signal Processing, Vol. 23, Issue 4, 2013, p. 1239-1246.
-
GB 22337-2008, Social Living Environment Noise Discharge Standard, 2008.
-
Han Hong-Liang, Liu Zhi-Hong, Yi Chui-Jie, et al. Characteristics of cutting noise of large cold saw machine. Noise and Vibration Control, Vol. 32, Issue 6, 2012, p. 203-207.
-
Liu Zhi-Hong, Yi Chui-Jie, Wang Wen-Ming, et al. The building method of random sparse acoustic array based on irregular grids. Journal of Mechanical Engineering, Vol. 53, Issue 17, 2017, p. 113-121.
-
Du Gong-Huan, Zhu Zhe-Min, Gong Xiu-Fen Acoustics Foundation. Nanjing University Press, Nanjing, 2012, p. 108-128.
-
Wu Yan-Bo, Yan Wen-Bin, Fan Wen-Xin Sound pressure measurement for noise source Identification in engine. Machinery Design and Manufacture, Vol. 6, 2007, p. 115-117.
About this article

