Abstract
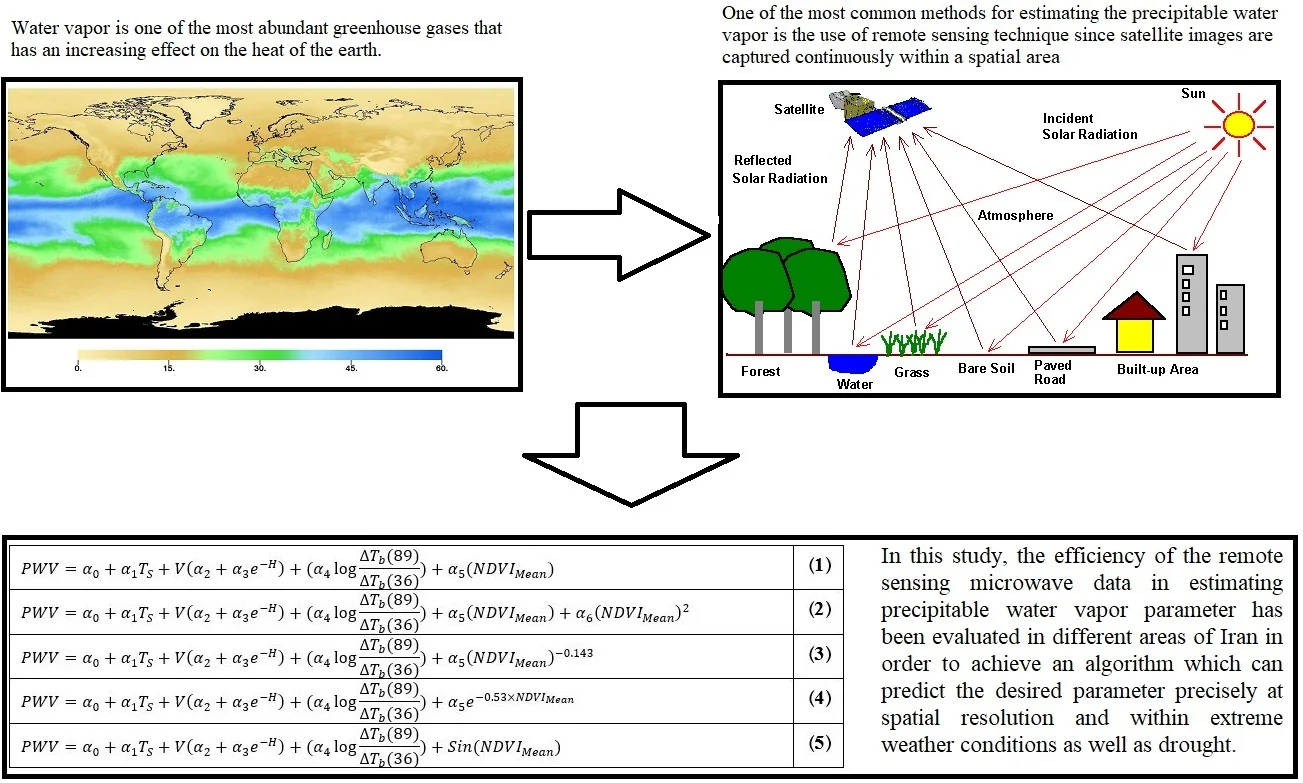
Total Precipitable Water Vapor (TPW) has an impact on many atmospheric and hydrological processes which can be calculated by the spatial and temporal resolution of weather conditions. Moreover, precipitable water vapor plays a significant role in predicting the weather so that climate change can be constantly monitored by spatial and temporal variations. Water vapor is one of the most abundant greenhouse gases that has an increasing effect on the heat of the earth. Therefore, zonation of precipitable water vapor map in global scale improves the understanding of hydrologists from the hydrological cycle, Earth and atmosphere reactions, the energy cost, and climate change through greenhouse gas emissions. The complex reactions between water vapor, aeroes and clouds, and difficulties in estimating their true amounts make it impossible to evaluate the effect of water vapor on heightening the heat generated by greenhouse gases. One of the most common methods for estimating the precipitable water vapor is the use of remote sensing technique since satellite images are captured continuously within a spatial area. The most crucial advantage of estimating precipitable water vapor by using microwave data over other methods such as optical data is its application and availability on cloudy days. Since microwaves are capable of crossing the clouds, algorithms developed based on them remain functional, whereas optical-based algorithms do not show appropriate performance on the cloudy days. In this study, the efficiency of the remote sensing microwave data in estimating precipitable water vapor parameter has been evaluated in different areas of Iran in order to achieve an algorithm which can predict the desired parameter precisely at spatial resolution and within extreme weather conditions as well as drought.
Highlights
- The objective of calculating maximum probable precipitation is to estimate maximum probable flood which it’s overestimating leads to the poor design of the structure.
- There are some drawbacks in the land-based measurement of precipitable water vapor.
- The efficiency of the remote sensing microwave data in estimating precipitable water vapor parameter has been evaluated.
- To build the proposed algorithm for estimating precipitable water vapor, in addition to the effects of the mentioned parameters, the effect of normalized difference vegetation index is considered.
- The effect of the normalized difference vegetation index on the precipitable water vapor parameter was investigated in five states.
1. Introduction
Water vapor is among the gases presented in the earth’s atmosphere; however, the amount of it, in comparison to others, is negligible. Despite this small portion, water vapor plays a significant role in atmospheric cycles, climate patterns, and hydrological cycles. The precipitable water vapor directly indicates the moisture content in the atmosphere, which is adopted to estimate maximum probable precipitation (PMP) using weather-meteorological methods. According to the World Meteorological Organization (WMO), PMP, in theory, is the maximum precipitation that can fall continuously (depending on the time it can last from several hours to several days) in a particular region [1]. The probability of occurrence of such a heavy rainfall is highly probable in the particular area and at a specific time. The objective of calculating PMP is to estimate maximum probable flood (PMF). PMF is a sensitive and crucial parameter in the design of reservoirs and water harvesting infrastructures in a watershed area. PMF restricts the size and design parameters of many hydraulic structures as well as reservoir height, storage volume, tunnel's dimension, etc. Overestimating PMF, on the one hand, leads to the poor design of the structure, increasing the construction costs, and on the other hand, underestimating it causes damage to the structure during severe floods.
Drawbacks in the land-based measurement of precipitable water vapor include maintenance and costs, distant distribution of the stations, and practical constraints in some aerial and spatial conditions with the insufficient covering at a local scale [2]. Nevertheless, in recent decades, the amount of precipitable water vapor obtained from radio stations is considered as standard values [3]. Other methods for estimating precipitable water vapor consists of spatial remote sensing techniques that are regularly received from satellites in optical and microwave ranges. In general, most algorithms for estimating precipitable water vapor have been developed based on microwave data at oceanic levels, since the surface conditions in these areas are more uniform than Earth's surface [2]. PMP algorithms based on the optic data appears to be inefficient in cloudy days, yet microwave waves are able to cross the clouds.
Numerous studies have been carried out to estimate precipitable water vapor locally by means of remote sensing data in optical wavelengths [4-9], or in the ranges associated with microwaves [2, 10-14]. Lack of local-scale sensors and unreliable optical data at the cloudy climate conditions are among the reasons which indicate the superiority of the images obtained in the microwave range. However, luminous images at salt marshes and low accuracy in the spatial resolution in the microwave bands present a solution combining both of these two bands to achieve the desired result with remote sensing data. Moreover, some investigations have been conducted to improve the precision and correlation of the parameters involved in estimating precipitable water vapor [15-17], such as the effects of climate change on precipitable water vapor [18, 19], or the correlation of the maximum monthly precipitable water vapor with precipitation [20, 21].
In the present study, the efficiency of the remote sensing microwave data in estimating precipitable water vapor parameter has been evaluated in different areas of Iran to investigate the performance of an innovative algorithm. New algorithm can be used to estimate precipitable water vapor accurately and at high resolution with respect to various weather conditions.
2. Materials and methods
2.1. Case study
Based on average annual rainfall, Iran is a semi-arid region with an average precipitation of one third of the world's rainfalls. Iran is located in the Middle East which has different climate and vegetation. The range of volatile water vapor in Iran varies between 2 mm and 45 mm. Fig. 1 shows the image of Iran from the Moderate Resolution Imaging Spectroradiometer (MODIS). It should be noted that in this study, three different remote sensing microwave data sets (Advanced Microwave Scanning Radiometer-2 (AMSR2), MODIS and radiosonde data sets) were used. The brief description of these data sets were presented in the following.
Fig. 1Location map [5]
![Location map [5]](https://static-01.extrica.com/articles/20935/20935-img1.jpg)
2.2. AMSR2 brightness temperature data
The Global Change Observation Mission 1st-Water (GCOM-W1) satellite, which was launched by the Japan Aerospace Exploration Agency in May 2012, contains an Advanced Microwave Scanning Radiometer-2 (AMSR2). The AMSR2 provides multifrequency measurements of microwave energy (brightness temperature) emitted by the Earth’s surface and atmosphere.
In this study, products of Level 1R luminosity in 18.7, 23.8, 36.5 and 89 GHz bands in horizontal and vertical polarization AMSR2 with a spatial resolution of 10 km were used. These data are for one-year intervals of 80 days including 20 days of spring 2016, 20 days of winter 2016, 20 days of autumn 2015, and 20 days of summer 2015.
2.3. MODIS data
The MODIS is a payload imaging sensor built by Santa Barbara Remote Sensing (SBRS) that was launched into Earth orbit by the National Aeronautics and Space Administration (NASA) in 1999 on board the Terra Satellite, and in 2002 on board the Aqua satellite. MODIS is viewing the entire Earth's surface every one to two days, acquiring data in 36 spectral bands. It should be noted that the MODIS vegetation index products such as the normalized difference vegetation index (NDVI), produced on 16-day intervals. In this study, NDVI products were required on a daily basis to be informed of the vegetation conditions at the time of imaging by AMSR2. Therefore, within the 80 days mentioned in Section 2.2, images of MODIS based on the satellite of the region of Iran with a spatial resolution of 1 km (MOD021KM) were prepared.
2.4. Radiosonde data
A radiosonde is a battery-powered telemetry instrument carried into the atmosphere usually by a weather balloon that measures various atmospheric parameters and transmits them by radio to a ground receiver. In this study, data from six radiosonde stations including, Tehran (OIII) Tabriz (OITT), Kermanshah (OICC), Ahvaz (OIAW), Shiraz (OISS), and Isfahan (OIFM) were used to train and evaluate the developed algorithm. The surface temperature and ground level altitude parameters are used for training, and the precipitable water vapor values of the stations were used to train and evaluate the algorithm. It should be noted that the radiosonde data is provided by the University of Wyoming [22].
2.5. Proposed algorithm
In the current study to build the proposed algorithm for estimating precipitable water vapor, in addition to the effects of the mentioned parameters such as surface temperature, elevation and liquid water inside the cloud, the effect of NDVI vegetation index derived from MODIS is also considered. It is obvious that the vegetation parameter shows the effect of all other factors such as precipitation, soil moisture and agricultural activities.
The previous studies have indicated that the magnitude of reflection energy in the red and infrared bands is close to that of the vegetation cover. In healthy plants, the amount of reflection energy in the red spectrum decreases with growth and development of the plant due to the absorption of the electromagnetic spectrum energy by the chlorophyll present in the leaf of the plant during the process of photosynthesis. In other words, the NDVI is a simple graphical indicator that can be used to analyze remote sensing measurements, typically, but not necessarily, from a space platform, and assess whether the target being observed contains live green vegetation or not. It should be noted that the high levels of NDVI indicate an increase in vegetation density. On the basis of the reflectance values of the bands one and two, the NDVI index was prepared on a daily basis as follow:
where and show the near-infrared wavelength (band 2) and red wavelength reflectivity (band 1) respectively. To convert the spatial resolution of the NDVI index from the MODIS to the spatial resolution of the brightness temperature of the AMSR2, two approaches were considered:
1) The average value of the NDVI (NDVI_Mean).
2) The maximum value of the NDVI (NDVI_Max).
It was found that the results of the NDVI_Mean were more accurate and for this reason the proposed algorithm was expanded using this parameter. It should be noted that the effect of the NDVI on the precipitable water vapor parameter was investigated in five states as follows:
1) The NDVI index was added as a linear function to the relationship provided by Du et al. (2015) to estimate precipitable water vapor parameter. After that, the proposed algorithm was modified based on 163 training data from six radiosonde data:
where , and (0, 1, 2, 3, 4, 5) are surface temperature, elevation and constant coefficients, respectively. It should be noted that peresents the liquid water inside the cloud.
2) After optimizing the Eq. (2), a second-order function is added based on the NDVI index. The optimization is used to obtain the coefficients related to the NDVI relationship:
3) The correlation between the precipitable water vapor parameters of radiosonde stations and the NDVI resulted in a function like as a non-linear function. In the following this function was replaced in Eq. (2):
4) As a next step, based on correlation between the precipitable water vapor parameters and the NDVI, an exponential function like , was added and replaced in Eq. (2) as follow:
5) At the final step a trigonometric function was added to Eq. (2) as follow:
3. Results and discussion
In order to evaluate the efficiency of the applied method to estimate the precipitable water vapor, 163 data from six Radiosonde stations have been trained to optimize the coefficients associated with the five relationships mentioned earlier. It should be noted that in the first step the PWV values were obtained from observed values and experimental equations. After that in the second step, the optimal coefficients for these relationships were calculated. The optimal coefficients are presented in Table 1.
Table 1Optimal coefficients for estimating PWV
No. | |||||||
Eq. (2) | 3.8 | 0.25 | 0.17 | 0.24 | –12.72 | –8.85 | – |
Eq. (3) | 2.57 | 0.24 | 0.17 | 0.25 | –14.22 | 79.66 | –34.38 |
Eq. (4) | –7.3 | 0.27 | 0.15 | 0.24 | –11.59 | 7.49 | – |
Eq. (5) | –15.38 | 0.25 | 0.17 | 0.24 | –12.6 | 19.32 | – |
Eq. (6) | –12.46 | 0.27 | 0.12 | 0.29 | –11.85 | –7.81 | – |
In the next stage, statistical parameters such as correlation coefficient () and root mean square error (RMSE) are calculated and regarded as a criterion for evaluating each relationship with respect to its performance. These values are shown in Table 2 also the scatter plots for each relation are shown in Fig. 2.
Fig. 2Scatter plots for a) Eq. (2), b) Eq. (3), c) Eq. (4), d) Eq. (5) and e) Eq. (6)
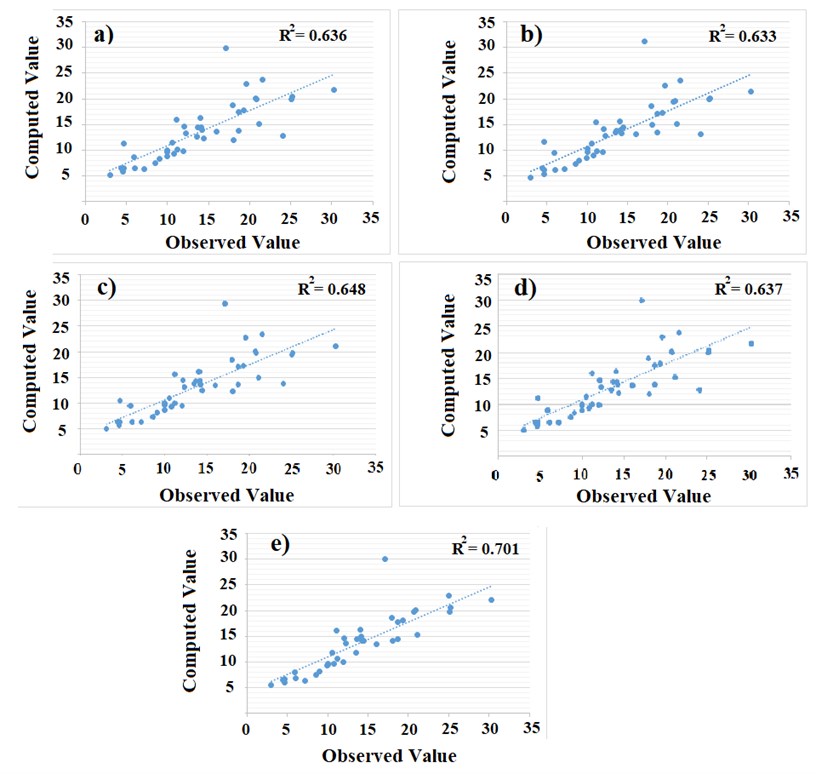
From Table 2, it is evident that introducing the effect of liquid cloud, ground altitude level, and surface temperature increased the correlation coefficient and reduced the associated error. Clearly, by introducing these three parameters, the accuracy of the algorithm significantly improved. It can also be inferred that the best performance is attributed to Eq. (5) where increased to 0.701, and RMSE reduced to the value equals to 3.484 mm. Such results can be interpreted in this way: since the nature of the problem is governed by sinusoidal relationship, consideration of the effect of the NDVI parameter as a sinusoidal function may increase the accuracy of the evaluated results from this relationship.
Table 2Results from PWV algorithms
No. | RMSE (mm) | |
Eq. (2) | 0.636 | 3.951 |
Eq. (3) | 0.633 | 3.983 |
Eq. (4) | 0.648 | 3.891 |
Eq. (5) | 0.637 | 3.947 |
Eq. (6) | 0.701 | 3.484 |
4. Conclusions
Precipitable water vapor is a crucial parameter in predicting weather condition affecting many atmospheric and hydrologic processes; therefore, precise calculation of this parameter within proper spatial and temporal resolution at different climatic conditions is of great importance. Among all available methods, a common approach in estimating the precipitable water vapor is employing remote sensing data. The most privilege of evaluating precipitable water vapor using remotes sensing data within microwave range over the other ranges is its reliability and availability even on cloudy days. Since microwaves are capable of crossing the clouds, algorithms developed based on them remain functional, whereas optical-based algorithms do not show appropriate performance on the cloudy days.
In this study, an algorithm developed based on previous pioneer work of Jones et al. 2010 and Du et al. 2015, which is employed for estimating precipitable water vapor in Iran. Moreover, the performance of the normalized difference vegetation index (NDVI) was also investigated to achieve higher precision in the algorithm. For this purpose, L1-R brightness products of the AMSR2 have been employed in 18.7, 18.8, 23.5, 36.5 and 89 GHz polarized vertically and horizontally, with a resolution up to 10 km, at 80-days interval including 20 days of each season from the autumn in 2015 to the summer in 2016. NDVI is also extracted daily from the reflectance products of MODIS 1 and 2 bands at an abovementioned time interval with a spatial resolution of one kilometer. Besides, data products from six radiosonde stations in Tehran, Tabriz, Kermanshah, Ahvaz, Shiraz, and Esfahan have been used for training and evaluating of the developed algorithms.
Application of the model developed by Jones et al. 2010 results in the values of the correlation coefficient () reaches to 0.45, and the squared error (RMSE) equals to 15.6 mm. Such results show that the model relies only on this method, at least to some extent, is not sufficiently satisfactory. Using the parameters like liquid cloud, ground altitude level, and surface air temperature [14] significantly improved the results of the model ( 0.627, RMSE = 3.99mm). In order to improve the results, the NDVI term is investigated in five different circumstances. The highest accuracy achieved when the index was contained a sinusoidal term in the predictive precipitable water algorithm. In this case, the correlation coefficient () is equal to 0.701, and the squared square error (RMSE) is equal to 484.3 mm. The comparison between the results from this study with those of previous similar studies shows that the level of the accuracy, in the best case, is consistent with models developed by other researchers, yet the number of errors is within acceptable ranges.
References
-
Manual on Estimation of Probable Maximum Precipitation (PMP). WMO, 2009.
-
Zhou F.-C., Song X., Leng P., Wu H., Tang B.-H. An algorithm for retrieving precipitable water vapor over land based on passive microwave satellite data. Advances in Meteorology, Vol. 2016, 2016, p. 4126393.
-
Niell A., Coster A., Solheim F., Mendes V., Toor P., Langley R., Upham C. Comparison of measurements of atmospheric wet delay by radiosonde, water vapor radiometer, GPS, and VLBI. Journal of Atmospheric and Oceanic Technology, Vol. 18, Issue 6, 2001, p. 830-850.
-
Kaufman Y. J., Gao B.-C. Remote sensing of water vapor in the near IR from EOS/MODIS. IEEE Transactions on Geoscience and Remote Sensing, Vol. 30, Issue 5, 1992, p. 871-884.
-
Mobasheri M., Purbagher Kordi S., Farajzadeh M., Naeini Sadeghi A. Improvement of remote sensing techniques in TPW assessment using radiosonde data. Journal of Applied Sciences, Vol. 8, 2008, p. 480-488.
-
Bedka S., Knuteson R., Revercomb H., Tobin D., Turner D. An assessment of the absolute accuracy of the Atmospheric Infrared Sounder v5 precipitable water vapor product at tropical, midlatitude, and arctic ground‐truth sites: September 2002 through August 2008. Journal of Geophysical Research: Atmospheres, Vol. 115, 2010, https://doi.org/10.1029/2009JD013139.
-
Lu N., Qin J., Yang K., Gao Y., Xu X., Koike T. On the use of GPS measurements for Moderate Resolution Imaging Spectrometer precipitable water vapor evaluation over southern Tibet. Journal of Geophysical Research: Atmospheres, Vol. 116, 2011, https://doi.org/10.1029/2011JD016160.
-
Chang L., Gao G., Jin S., He X., Xiao R., Guo L. Calibration and evaluation of precipitable water vapor from MODIS infrared observations at night. IEEE Transactions on Geoscience and Remote Sensing, Vol. 53, Issue 5, 2015, p. 2612-2620.
-
Pourbagher Kordi, S. M., Kazemi M. Examination of total precipitable water using MODIS measurements and comparison with radiosonde and GPS data. International Journal of Humanities and Social Science Invention, Vol. 5, Issue 4, 2016, p. 40-47.
-
Basili P., Bonafoni S., Mattioli V., Ciotti P., Pierdicca N. Mapping the atmospheric water vapor by integrating microwave radiometer and GPS measurements. IEEE Transactions on Geoscience and Remote Sensing, Vol. 42, Issue 8, 2004, p. 1657-1665.
-
Deeter M. N. A new satellite retrieval method for precipitable water vapor over land and ocean. Geophysical Research Letters, Vol. 34, Issue 2, 2007, https://doi.org/10.1029/2006GL028019.
-
Jones L. A., Ferguson C. R., Kimball J. S., Zhang K., Chan S. T. K., Mcdonald K. C., Njoku E. G., Wood E. F. Satellite microwave remote sensing of daily land surface air temperature minima and maxima from AMSR-E. Journal of Selected Topics in Applied Earth Observations and Remote Sensing, Vol. 3, Issue 1, 2010, p. 111-123.
-
Ji D., Shi J. Water vapor retrieval over cloud cover area on land using AMSR-E and MODIS. Journal of Selected Topics in Applied Earth Observations and Remote Sensing, Vol. 7, Issue 7, 2014, p. 3105-3116.
-
Du J., Kimball J. S., Jones L. A. Satellite microwave retrieval of total precipitable water vapor and surface air temperature over land from AMSR2. IEEE Transactions on Geoscience and Remote Sensing, Vol. 53, Issue 5, 2015, p. 2520-2531.
-
Fernando W., Wickramasuriya S. Estimating probable maximum precipitation-from research to design. Engineer, Vol. 40, Issues 4, 2007, p. 116-122.
-
Casas M. C., Rodríguez R., Prohom M., Gázquez A., Redaño A. Estimation of the probable maximum precipitation in Barcelona (Spain). International Journal of Climatology, Vol. 31, Issue 9, 2011, p. 1322-1327.
-
Chavan S. R., Srinivas V. Probable maximum precipitation estimation for catchments in Mahanadi river basin. Aquatic Procedia, Vol. 4, 2015, p. 892-899.
-
Rousseau A. N., Klein I. M., Freudiger D., Gagnon P., Frigon A., Ratté Fortin C. Development of a methodology to evaluate probable maximum precipitation (PMP) under changing climate conditions: Application to southern Quebec, Canada. Journal of Hydrology, Vol. 519, 2014, p. 3094-3109.
-
Lee O., Park Y., Kim E. S., Kim S. Projection of Korean probable maximum precipitation under future climate change scenarios. Advances in Meteorology, Vol. 2016, 2016, p. 3818236.
-
Sharifi M. A., Khaniani A. S., Joghataei M. Comparison of GPS precipitable water vapor and meteorological parameters during rainfalls in Tehran. Meteorology and Atmospheric Physics, Vol. 127, Issue 6, 2015, p. 701-710.
-
Bordi I., Zhu X., Fraedrich K. Precipitable water vapor and its relationship with the standardized precipitation index: ground-based GPS measurements and reanalysis data. Theoretical and Applied Climatology, Vol. 123, Issues 1-2, 2016, p. 263-275.
-
Wyoming University Website, 2018, http://weather.uwyo.edu/upperair/sounding.html.
Cited by
About this article

