Abstract
An improved generative adversarial network model is adopted to improve the resolution of remote sensing images and the target detection algorithm for color remote sensing images. The main objective is to solve the problem of training super-resolution reconstruction algorithms and missing details in reconstructed images, aiming to achieve high-precision detection of medium and low-resolution color remote sensing targets. First, a lightweight image super-resolution reconstruction algorithm based on an improved generative adversarial network (GAN) is proposed. This algorithm combines the pixel attention mechanism and up-sampling method to restore image details. It further integrates edge-oriented convolution modules into traditional convolution to reduce model parameters and achieve better feature collection. Then, to further enhance the feature collection ability of the model, the YOLOv4 object detection algorithm is also improved. This is achieved by introducing the Focus structure into the backbone feature extraction network and integrating multi-layer separable convolutions to improve the feature extraction ability. The experimental results show that the improved target detection algorithm based on super resolution has a good detection effect on remote sensing image targets. It can effectively improve the detection accuracy of remote sensing images, and have a certain reference significance for the realization of small target detection in remote sensing images.
Highlights
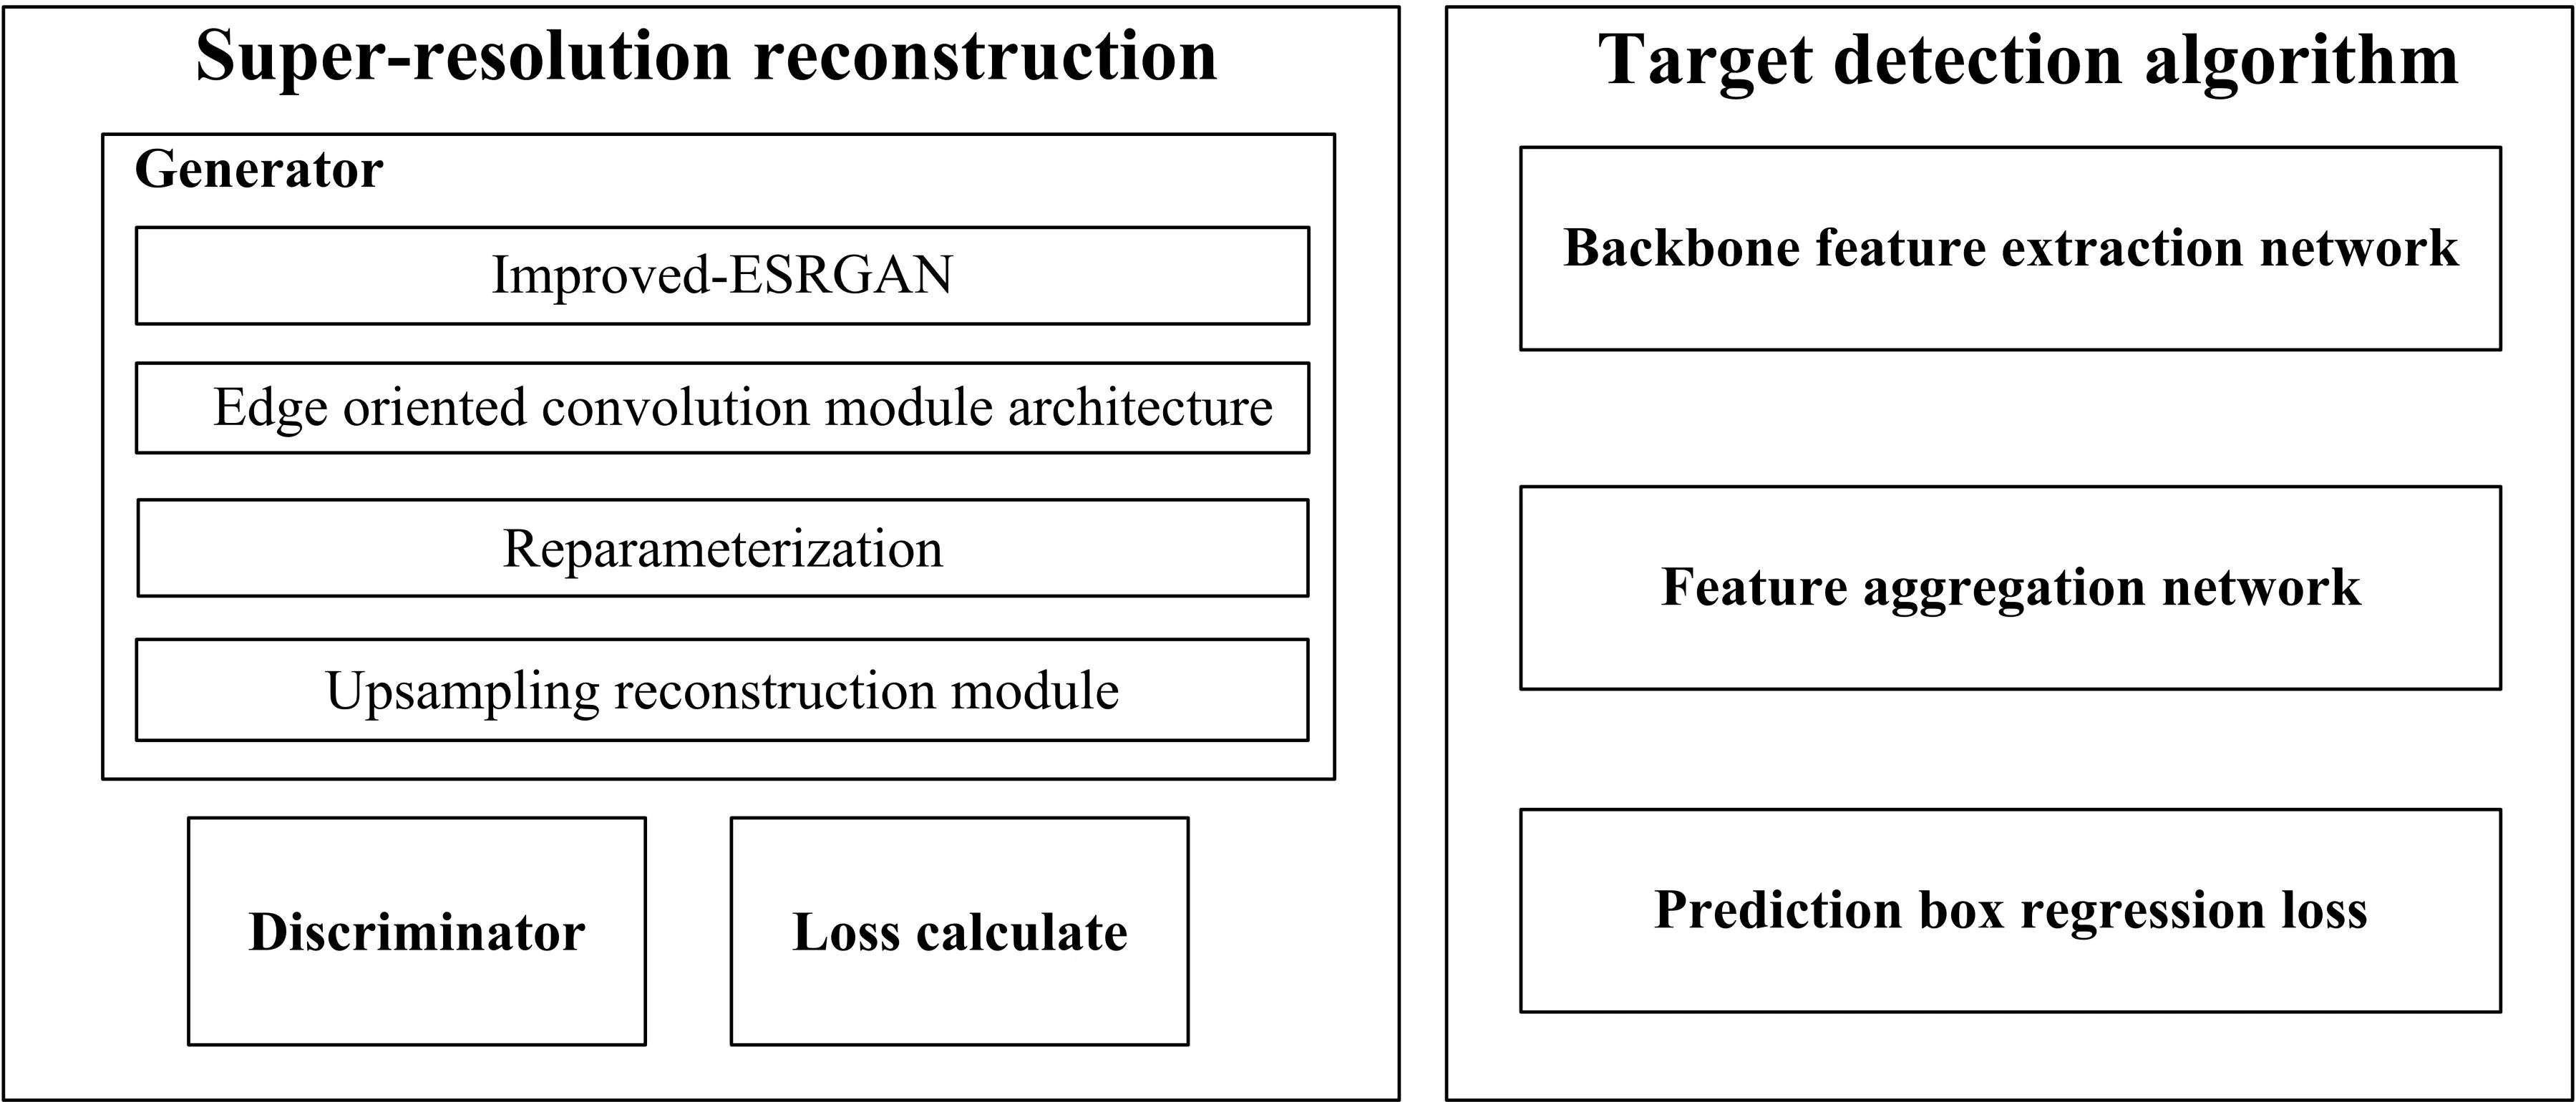
- A lightweight image super-resolution reconstruction algorithm based on improved generative adversarial networks is proposed in this paper. On the basis of generating adversarial networks, this algorithm adopts a combination of pixel attention mechanism and up-sampling method, which can better restore image details.
- This paper further integrates edge-oriented convolution modules into traditional convolution by combining edge-oriented convolution modules with the idea of multiple parameters, in order to reduce model parameters and better achieve feature collection.
- In order to further enhance the feature collection ability of the model, this paper also improved the YOLOv4 object detection algorithm by introducing the Focus structure into the backbone feature extraction network and integrating multi-layer separable convolutions to improve the feature extraction ability of the backbone network.
- The improved YOLOv4 algorithm adopts a bidirectional feature pyramid network for multi-scale feature fusion, introduces a lightweight subchannel attention mechanism, and uses deep separable convolution to improve the multi-scale feature acquisition ability.
1. Introduction
Due to the unique perspective imaging structure, remote sensing images are widely used in military defense [1], marine detection, intelligent transportation, sudden disasters [2], emergency response, and more. These images provide valuable spatial information and are considered an important resource. Object detection in remote sensing image aims to use image processing technology to mark and extract interested objects from complex remote sensing background images and label their positions and categories accurately and efficiently. In recent years, with the rapid development of remote sensing technology [3], the amount of information contained in remote sensing images has become huge, and their spatial resolution has become higher and higher. High-resolution (HR) remote sensing images provide detailed structural information of scene coverage. However, the spatial resolution of remote sensing images is limited by hardware conditions and environmental noise in the imaging process. Compared with the existing physical imaging technology, super resolution (SR) image reconstruction is more convenient and cheaper to restore high-resolution images from low-resolution (LR) images. As a result, remote sensing image super-resolution reconstruction has become an effective method to obtain HR maps in remote sensing. Image super-resolution reconstruction plays a crucial role in the remote sensing field.
In recent years, the target detection algorithms based on convolutional neural networks (CNN) have been developing continuously. These algorithms can be generally divided into: two step target detection algorithms and one step target detection algorithm based on regression [4]. The two-stage detection algorithm first generates candidate regions through the regional candidate network (RPN), and then performs classification and regression, that is, the location and classification results are obtained successively through two stages, such as Faster R-CNN [5], R-FCN [8], etc. The single-stage detection algorithm can directly locate the target through the neural network [6-7], output the target category detection information, and transform the target coordinate location problem into a regression problem, such as SSD (Single shot MultiBox detector) [9], and YOLO series [10-13].
Based on the complex background information and small target detection in remote sensing images, through the pretreatment of super-resolution reconstruction of original data in color remote sensing images, the target detection algorithm is improved to adapt to color remote sensing target detection. The super-resolution reconstructed image is used as the test data of the improved remote sensing image target detection algorithm to investigate the advantages of super-resolution reconstruction algorithm in improving target detection.
2. Related work
2.1. Super-resolution generative adversarial network
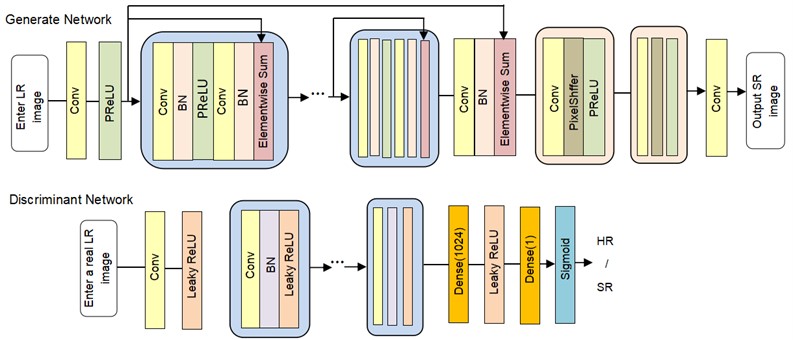
SRGAN (Super-Resolution Generative Adversarial Networks) proposed by Ledig et al., was initially used the generation confrontation network for image SR. The structure of SRGAN is shown as Fig. 1. In image SR, the generation network aims to generate an HR image close to real data [14]. The discrimination network is used to evaluate whether the image generated by the generation network has the same distribution as the real data. The loss function [15] is adversarial loss, expressed as follows:
 where
where  is the adversarial loss function of the generated network in the SR model, and
  is the adversarial loss function of the discriminating network. refers to a real HR image, and refers to the image generated by the generator. Fig. 2 shows the network structure of SRGAN.
Fig. 1SRGAN network structure diagram
2.2. ESRGAN fundamentals
ESRGAN (Enhanced Super-Resolution Generate Adversarial Networks) has improved the network structure and loss function of SRGAN by removing all batch normalization layers from the generated network structure. It has been confirmed in EDSR that removing batch normalization layers contributes to the overall performance of the model. A multi-level residual dense connection structure (RRDB) composed of three residual dense blocks (RDBs) is used to replace the basic modules in the original generated network. This structure can better utilize multi-level features and extract rich local features. However, due to the embedded network structures in the network, the capacity of the model inevitably increases. Since dense connections can effectively reduce the difficulty of training, and also bring about great computational complexity [16]. Fig. 2 shows the structure diagram of the generating network portion of ESRGAN.
Fig. 2Structure of ESRGAN feature extraction module
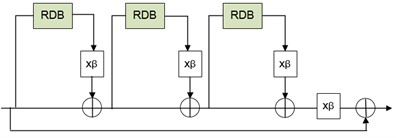
a) RRDB structure diagram
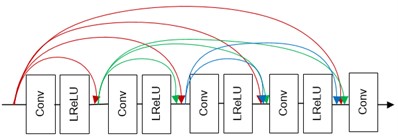
b) RDB structure diagram
ESRGAN uses a discriminator based on relativistic averaging to generate an adversary network Ra GAN. Unlike traditional GAN discriminators that estimate the probability of true input data, relativistic discriminators attempt to predict the probability that real data images are more realistic and natural than the generated data. Meanwhile, Ra GAN generators combine the gradient of generated data and real data during the training process, while traditional GAN generators only use the gradient of generated data during the training process. The mathematical expression of the relativistic discriminator is as follows:
where represents a relative average discriminant network; represents the generator input data; represents the real data of the training set; represents the sigmoid activation function; represents the output of the generator; represents the output of the inactive discriminator; represents the operation of averaging all data in a small batch. When the real image is more realistic and natural than the synthesized image, the result of tends to be 1 (Eq. (4)); If the quality of the synthesized image is worse than that of the real image,  result tends to be 1 (Eq. (3)).
According to the principle of relativistic discriminators, the loss functions of discriminators and generators in ESRGAN can be defined as follows:
3. Algorithm research
3.1. Super-resolution reconstruction
3.1.1. Generator
3.1.1.1. Generator network structure
To improve the resolution of the image and enhance the detail texture of the image, the generation network structure of ESRGAN is improved. The method of combining pixel attention with up-sampling method is used to enrich the feature details and perfect reconstruction tasks to improve image resolution and enhance image detail texture. The edge-oriented convolution block (ECB) is used to extract edge features. In reasoning stage, re parameterization technology is used to reduce model parameters. The network structure of the generator is shown in Fig. 3.
Fig. 3Network structure of adversarial training generator

The overall generator network structure consists of three parts: First, in the initial stage of the network, conventional 3 is adopted × 3 convolutions for shallow feature extraction, aiming to roughly extract image features and prepare for further fine feature extraction in the network layer. Then, the features obtained from the convolution operation will go through deep feature extraction modules, namely the edge-oriented convolution modules. This section performs the convolution kernels of 1×1, 3×3, and 5×5 on the feature maps output from the previous layer, followed by 3×3-hole convolutions with the expansion rates of 1, 3, and 5, respectively. This aims to obtain multiple branches with different receptive fields, representing features of different scales. Then, all feature maps of different scales are connected through an addition operation, compressed by a 1×1 convolutional kernel, and then added to the feature maps from the previous layer as the output of this layer. The input LR image is fused with the output features of the deep feature extraction module through a skip connection using the nearest neighbor interpolation, and finally reconstructed by the up-sampling reconstruction module.
When setting the network parameters, the padding is set to 2. The first initial convolutional layer uses 64 convolutional kernels with a step of 1. In the middle ECB layer, except for the 64 convolutional kernels used in the first convolutional block with a step of 2, the remaining parts are gradually incremented using convolutional kernels of 128 to 512, with the alternating steps of 1 and 2.
3.1.1.2. Architecture of the edge-oriented convolution module
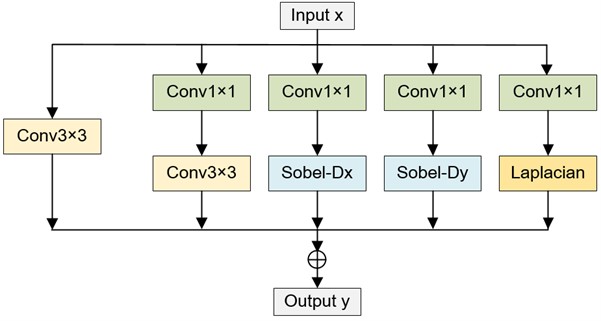
The edge-oriented convolution module (ECB) can effectively extract image edge and texture information [17], as shown in Fig. 4. The ECB consists of four well-designed operators. The first part consists of 3×3 convolution formation. The second part includes expansion convolution and compression convolution. It first uses C×D×1×1 to expand the channel dimension from C to D, and then uses C×D×3×3 to compress the feature back to channel dimension C. The third part is the first-order edge extraction. Sobel gradient is implicitly integrated into the third and fourth branches of the ECB module. The fourth part uses Laplace filter to extract the second order edge information.
Fig. 4Edge oriented convolution module (ECB)
3.1.1.3. Reparameterization
ECB is re-parameterized into a single 3×3 convolution to achieve efficient reasoning [18]. The 1×1 convolution and 3×3 convolution in the second part can be combined into a single conventional convolution with the parameters and :
where represents the first and second dimensional permutation operations of the commutative tensor, with a shape of C×D×1×1. is a space broadcast operation that copies the original shape 1×D×1×1 of the offset into 1×D×3×3. , and  is defined as the weight value of the C×D×3×3 convolution with shape, which is equivalent to the depth convolution of
  , and
, and  used for extraction:
where , 1, 2,..., . Finally, after re-parameterization, the weight and offset are expressed as:
The output features in the reasoning phase can be represented by a single conventional convolution:
3.1.1.4. Up-sampling reconstruction module
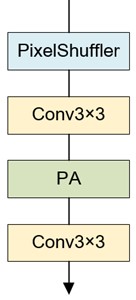
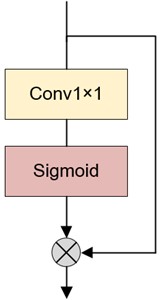
In addition to adding the ECB module, pixel attention [19] is used in the final reconstruction module of the generator, and the mode of combining up-sampling and attention is used to achieve the reconstruction effect. Two up-sampling reconstruction modules are cascaded to achieve 4x magnification reconstruction, and only one up-sampling reconstruction module is used to achieve 2x magnification reconstruction. The up-sampling reconstruction module is shown in Fig. 5, where PA represents the pixel attention.
Fig. 5Up-sampling reconstruction module
a) Up-sampling reconstruction module
b) Pixel attention
3.1.2. Discriminator
The discriminator is used to distinguish the image output by the generator from the real high-resolution image. Its output is the probability of judging the current input as a real image, and its structure is shown in Fig. 6.
Fig. 6Network structure of adversary training discriminator

A learnable PRe LU activation function is used in the discriminator network. In the feedforward network, each layer learns a slope parameter, which can better adapt to other parameters, such as weights and offsets. The batch normalization layer will be used here, because the main task of identifying the network is to judge the distribution difference between the real image and the image generated by the generated network. It does not need to reconstruct the image details, and adding the batch normalization layer can better relieve the training pressure. Similar to the basic structure of VGG networks, here 8 3 are used × 3 convolutional layers, which will gradually strengthen the confrontation between the discriminator and the generator. This allows the generator to generate a large number of real data samples without prior knowledge, ultimately allowing the generated sample data to reach the fake level. When the training network lacks sample data, GAN networks can be used to generate sample data for training, which is helpful in image generation and high-resolution image reconstruction. When setting the network parameters, 64 convolution cores are used in the first convolution layer, with a step of 1. In the middle feature extraction layer, except that 64 convolution kernels are used in the first convolution block, the step is 2. The remaining part uses 128 to 512 convolution kernels to gradually increase, and the steps use 1 and 2 alternately. Finally, it is judged by two full connection layers and sigmoid activation function.
3.1.3. Loss function
The loss function is divided into the loss function of the generation network and the discrimination network. The loss function of the generation network is expressed by  , which is weighted by the content loss function , the perception loss function
  and the confrontation loss function :
where and are weighting coefficients used to balance the two loss functions. The problem with is that its gradient will jump at the extreme point, and even small differences will bring about large gradients, which is not conducive to learning. Therefore, when using it, a learning rate decay strategy is usually set. When is used as a loss function, due to its own characteristics, it will scale the gradient. To balance these two factors, and are introduced as the weighting coefficients.
The content loss function uses the  loss function to evaluate the distance between the image
  generated by the generator and the true value :
The perception loss function follows the idea of ESRGAN and uses the pre-trained VGG19 network to define the perception loss function. The fifth convolution of the input feature before the sixth largest pooling layer of the VGG19 network does not pass through the activation function. Because the features of the activation function will become sparse, especially after a deep network, sparsity will lead to weak supervision, resulting in poor performance. At the same time, the use of features after activation will result in differences from the actual brightness of the real image [20]. The perception loss function is defined as the Euclidean distance between the features of the reconstructed image  and the real image , where
  represents the feature map extracted through VGG19 network:
The relativistic average discriminator RaD, expressed as , is used for countering losses. The loss function of the discriminant network is defined as:
where, represents the input LR image, and  represents the generated network output feature.
3.2. Target detection algorithm
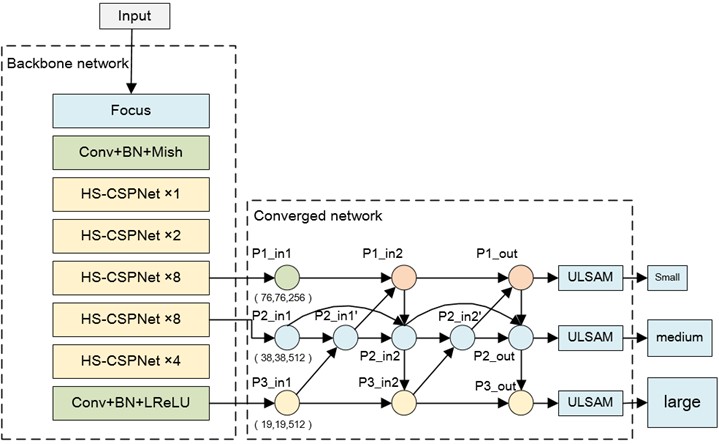
For the detection of small target objects, dense target objects and complex background target objects, YOLOv4 target detection algorithm is selected as the basic framework, and CSPParknet53 [21] network structure is used as the backbone feature extraction network core to deepen the network and improve the network operation speed. Through adding the Focus structure after the image input, the scale feature of the input image is transformed into the channel feature, and the operation amount of the initial convolution is reduced. CSPDarknet53 is the core of the algorithm used to extract target features. From Fig. 7, it can be seen that the backbone network structure includes 5 CSP modules. The down-sampling of each CSP module can be achieved through 3×3 convolutional kernels. The YOLOv4 network model defines the input image as 608×608. After feature extraction by five CSP models in the backbone network, the size of the feature map changes five times, ultimately changing from 608×608 to a 19×19 size feature map. In this way, rapid dimensionality reduction of the feature map is achieved. The advantages of using the CSPMarket53 network structure as the backbone network for YOLOv4 include two aspects. On one hand, it can improve the ability off convolutional network to extract features and improve detection speed without losing detection accuracy; on the other hand, it is necessary to reduce the computational loss of the entire model, enabling it to train the YOLOv4 model even on a simple CPU configuration. Here a multi-layer separable convolution module is introduced into CSPParknet53 to enhance feature extraction ability and enhance the extraction and learning ability of small-scale target feature maps through the sharing of receptive field information in different channels. Through applying a bidirectional feature pyramid network into multi-scale feature fusion, the feature information of different scale resolutions is aggregated. When constructing the feature aggregation network, a lightweight subchannel attention model is also introduced. The semantic information of different features is obtained through deep separable convolution and pooling operations [22]. Through dividing the feature graph into different subspaces to obtain different attention information, the multi-scale feature aggregation ability was improved. The target detection network structure is shown in Fig. 7.
Fig. 7Target detection network structure
3.2.1. Backbone feature extraction network
The backbone feature extraction network is improved based on the CSPParknet53 network. According to introducing the Focus structure and the Hierarchical Split Block [23] (HSB) structure, it can effectively improve the feature extraction capability and enhance the sharing of feature information. This article replaces the residual structure with the CSPNet structure in YOLOv4 target detection algorithm, and replaces the residual convolution operation with HSB operation, to complete the implementation of HS-CSPNet structure. The HS-CSPDarknet53 network is divided into five groups of HS-CSPNet structures. The number of HS-CSPNet is 1, 2, 8, 8, and 4, respectively. Then, the high-level 19×19×1024 extracted from HS-CSPDarknet53 network is input into the SPP structure to further increase the receptive field of deep features, and the channel receptive field of 19×19×2048 is expanded. Then, feature integration and channel number compression are performed through two 34 convolutions. In the backbone feature extraction network, each step of 3×3 convolution uses convolution plus batch normalization plus activation function. The HS-CSPDarknet53 network structure uses the Mish activation function, and other structures use the Leaky ReLU activation function. Finally, the 76×76×256 feature map obtained from the third layer of HS-CSPNet structure. The 38×38×512 feature map obtained from the fourth layer of HS-CSPNet structure and the 19×19×512 feature map after SPP structure operation will be used as the three different dimensional features extracted from the overall backbone network and input into the feature aggregation network for further feature aggregation.
3.2.2. Feature aggregation network
Based on YOLOv4 target detection algorithm, the feature pyramid structure of the aggregation network [25] is improved through Bidirectional Feature Pyramid Network [24] (BiFFN), adding the ULSAM structure at the end of the aggregation network. Improving the feature aggregation network structure and attention mechanism can improve the feature aggregation capability of the overall network. The improved aggregation network structure based on BiFFN and attention mechanism is shown in Fig. 8.
The aggregation network aims to achieve feature aggregation through the feature pyramid structure, thereby effectively combining deep global semantic features and shallow high-frequency detail features. This enables better separation of location information and category information of the target to be detected. BiFFN structure can realize the aggregation and reuse of features between different dimensions, allowing for multiple iterations to deeply integrate both deep and shallow feature information.
3.2.3. Prediction box regression loss
The proposed algorithm uses prediction box regression loss, classification loss, and confidence loss to form a loss function. The prediction frame regression loss uses CloU loss. During training, CloU takes into account the distance between the target prediction frame and a priori frame, the overlap rate, size, and penalty mechanism. The penalty factor combines the prediction frame aspect ratio with the actual frame aspect ratio, making the prediction frame regression more stable. The CloU loss function is shown in Eq. (19):
where, represents the Euclidean distance between two points; and  represent the center points of the prediction frame and the real frame;
 represents the farthest diagonal distance between the prediction frame and the real frame;
 represents the weight parameter formula;
 represents a parameter that measures the consistency of the aspect ratio; and represent the width and height of the real frame, respectively; and represent the width and height of the prediction box.
The class loss function and confidence loss are as follows:
where represents three different types of prior frame sizes, which are 19×19, 38×38 and 76×76;  represents the number of prediction boxes; represents a weight coefficient that is used to reduce confidence losses without targets. When the prediction box contains objects, ,
  , and vice versa; represents the true value;
  represents the predicted value;
  represents the probability of being predicted as a class target, and
  is the true value probability.
The overall loss function is as follows:
4. Experimental results and analysis
4.1. Preprocessing of remote sensing image data sets with different resolutions
DIOR [26] dataset is used to analyze the impact of different resolutions on the performance of target detection tasks. Using the 4-fold down sampling data of the DIOR dataset and the low-resolution data of the NWPU-RESISC45 [27], [38], [39] dataset, the 4-fold super-resolution reconstruction is conducted to improve the resolution of remote sensing images. The super-resolution reconstruction target detection performance of remote sensing images is analyzed.
4.1.1. DIOR dataset preprocessing
DIOR dataset contains 20 different categories, with each image of 800×800 pixels, and 1500 of which are randomly selected as the DIOR dataset used in this chapter. The remote sensing images in the DIOR dataset are performed separately, using 400 for twice the double triple × 400 pixels, triple bicubic interpolation down sampling to 266×266 pixels, and sampling down to 200 using 4x bicubic interpolation × 200 pixels.
4.1.2. NWPU-RESISC45 dataset preprocessing
The NWPU-RESISC45 dataset is a public remote sensing dataset that includes 45 different scene classifications, with 700 remote sensing images in each category, and a total of 31500 images. Each image has a size of 256×256 pixels, with a spatial resolution of 30 to 0.2 meters. 15 categories are selected, and100 for each category. A total of 1500 remote sensing images are as the NWPU-RESISC45 dataset, including 15 categories such as aircraft, airports, baseball fields, basketball courts, bridges, chimneys, golf courses, track and field fields, overpasses, ships, stadiums, oil tanks, tennis courts, train stations, and automobiles.
First, use the LabelImg tool in Python to label and save 1500 images in VOC format as a low-resolution remote sensing target detection dataset for NWPU-RESISC45. Then, using the improved super-resolution remote sensing image reconstruction algorithm based on generative adversarial networks proposed in this article, 1500 images are reconstructed as the NWPU-RESISC45 super-resolution reconstruction remote sensing target detection dataset for 4-fold super-resolution reconstruction.
4.2. Analysis of experimental results
In the target detection of remote sensing image, the resolution of the image to be detected has a certain impact on the detection performance. On the DIOR dataset and NWPU-RESISC45 dataset, the influence of super resolution reconstruction remote sensing image on target detection performance is analyzed. First, the 4-fold down sampled DIOR dataset is reconstructed into 800×800 pixels by using the super-resolution remote sensing image reconstruction algorithm proposed. Then, the improved remote sensing target detection algorithm proposed in this paper is used for target detection, and the mAP value of detection performance is compared and analyzed. Second, the WPU-RESISC45 dataset is reconstructed into 1024×1024 pixels by 4 times super resolution reconstruction, and then the improved remote sensing target detection algorithm proposed in this paper is used for target detection to compare and analyze the detection performance of mAP value. The evaluation of target detection performance for reconstructing remote sensing images is shown in Table 1.
Table 1Target detection performance evaluation of super-resolution reconstructed images
Data set | Reconstruction multiple | Resolving power | mAP |
DIOR | Nothing | 800×800 | 0.684 |
Nothing | 200×200 | 0.287 | |
Quadruple | 800×800 | 0.588 | |
NWPU-RESISC45 | Nothing | 256×256 | 0.342 |
Quadruple | 1024×1024 | 0.635 |
It can be seen from Table 1 that for the DIOR dataset, the mAP value of the image without down-sampling and reconstruction is 0.684. For the target detection after 4 times down-sampling and super-resolution reconstruction, the mAP value is 0.588. Compared with the mAP detected after 4 times down sampling, the performance is nearly doubled. For the NWPU-RESISC45 dataset, the performance of the target detection mAP value after super-resolution reconstruction is nearly doubled compared with the mAP value directly detected. One image is selected from the DIOR dataset and one from the NWPU-RESISC45 dataset to display the detection results, as shown in Fig. 8 and Fig. 9.
Fig. 8Target detection results of super resolution reconstruction of DIOR dataset
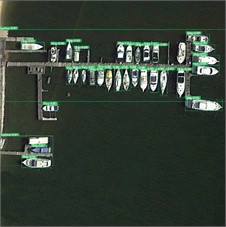
a) Original image (800, 800, 3)
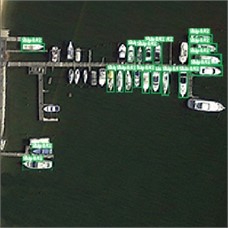
b) 4-fold down sampling diagram (200, 200, 3)
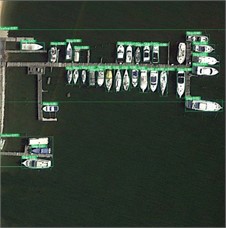
c) 4x super-resolution reconstruction image (800, 800, 3)
Fig. 9Target detection results of super resolution reconstruction of NWPU-RESISC45 dataset
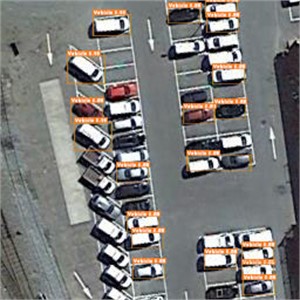
a) Original image (256, 256, 3)
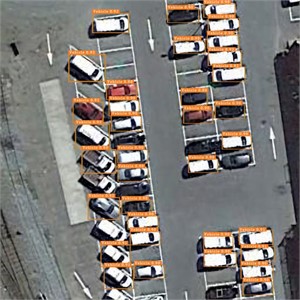
b) 4x super-resolution reconstruction image (1024, 1024, 3)
For NWPU-RESISC45 data set, the 4-fold super-resolution reconstructed image can effectively improve the target detection performance. Only a few cars can be detected in the original image in Figure 10, while the reconstructed image can accurately detect almost all cars.
To verify the effectiveness of the proposed method, traditional algorithms such as Bilinear Interpolation [30], Nearest Neighbor Interpolation [31], and ESRGAN [32] is used in this experiment to improve the quality of low-resolution images. The improved results will be compared with the original image under multiple methods. The high-resolution raster images obtained by this method and different interpolation resampling methods are compared as shown in Table 2.
Table 2Similarity comparison results of different up-sampling methods
Methods | Resolution improvement factor | Similarity with the original raster image |
Ours | 4 | 93.1 % |
Bilinear interpolation | 4 | 82.9 % |
Nearest neighbor interpolation | 4 | 83.6 % |
ESRGAN | 4 | 89.2 % |
As shown in Table 2, the proposed method is better than other conventional approaches in terms of similarity evaluation criteria for the mean hash algorithm. Its superior performance can be attributed to the utilization of a combined pixel attention mechanism and up-sampling method within the super-resolution enhancement model based on ESRGAN. Through constructing a prior knowledge base, the network model can effectively learn the features of converting low resolution images into high resolution images, thereby improving the quality of raster images. Additionally, this method combines edge-oriented convolution modules with multi-parameter concepts, further integrating edge-oriented convolution modules into traditional convolution to reduce model parameters. However, traditional resampling interpolation methods infer unknown pixels solely from neighboring pixels, leading to disparities in similarity indicators.
To verify the impact of the number of generated samples on target recognition results, we continue to increase the number of generated samples in the sample set and incorporate them into the training and validation sets at a 4:1 ratio for training the target recognition model. The recognition accuracy of the detected targets is shown in Table 3. When the number of generated samples is 1000, the recognition accuracy of the target can be improved by 7.9 %. However, as the number of generated samples continues to increase, the detection accuracy of the target declines. When reaching 1500 generated samples, the generated images are greater than the original images, and the richness and diversity of the samples are limited. Consequently, improvements in recognition accuracy become insignificant and even lead to overfitting issues. Therefore, when dealing with imbalanced datasets, the method of generating adversarial network expansion to training samples can effectively balance the dataset and improve target recognition accuracy. However, excessive generation of samples can increase redundant target information to be identified, leading to model overfitting.
Table 3Target detection accuracy of different number of generated samples
Number of generated samples | AP / % | Degree of improvement / % |
500 | 33.9 | 3.9 |
1000 | 39.3 | 7.9 |
1500 | 36.6 | 5.8 |
5. Conclusions
This paper presents an analysis of super-resolution reconstruction algorithms based on generative adversarial networks for enhancing the resolution of low-resolution remote sensing images, followed by the application of an improved target detection algorithm for multi-target detection. According to analyze the impact of different resolutions on the performance of remote sensing target detection using the DIOR dataset, this study confirms significant enhancements in both super resolution remote sensing image reconstruction algorithm and remote sensing target detection algorithm, thereby improving the overall performance of remote sensing target detection tasks. Furthermore, through analyzing the target detection results of super-resolution reconstructed remote sensing images on the NWPU-RESISC45 dataset, and comparing with the original images, it further validates that the proposed method can effectively improve the target detection performance of medium and low-resolution color remote sensing images. These findings demonstrate practical applicability and highlight advancements made in super-resolution remote sensing image-based target detection algorithms.
The performance of the super-resolution reconstruction algorithm still needs further improvement. The next work will study how to better improve the accuracy of the algorithm and how to actually use the proposed object detection algorithm in real scenes.
References
-
S. Sahoo, S. P. Parida, and P. C. Jena, “Dynamic response of a laminated hybrid composite cantilever beam with multiple cracks and moving mass,” Structural Engineering and Mechanics, Vol. 87, No. 6, pp. 529–540, Sep. 2023, https://doi.org/10.12989/sem.2023.87.6.529
-
B. B. Bal, S. P. Parida, and P. C. Jena, “Damage assessment of beam structure using dynamic parameters,” in Lecture Notes in Mechanical Engineering, Singapore: Springer Singapore, 2020, pp. 175–183, https://doi.org/10.1007/978-981-15-2696-1_17
-
S. P. Parida, P. C. Jena, and R. R. Dash, “Dynamics of rectangular laminated composite plates with selective layer-wise fillering rested on elastic foundation using higher-order layer-wise theory,” Journal of Vibration and Control, p. 107754632211383, Nov. 2022, https://doi.org/10.1177/10775463221138353
-
Duan Zhongjing, Li Shaobo, Hu Jianjun, Yang Jing, and Wang Zheng, “Review of deep learning based object detection methods and their mainstream frameworks,” Laser and Optoelectronics Progress, Vol. 57, No. 12, p. 120005, 2020, https://doi.org/10.3788/lop57.120005
-
S. Ren, K. He, R. Girshick, and J. Sun, “Faster R-CNN: towards real-time object detection with region proposal networks,” IEEE Transactions on Pattern Analysis and Machine Intelligence, Vol. 39, No. 6, pp. 1137–1149, Jun. 2017, https://doi.org/10.1109/tpami.2016.2577031
-
Y. Li, J. Li, and P. Meng, “Attention-YOLOV4: a real-time and high-accurate traffic sign detection algorithm,” Multimedia Tools and Applications, Vol. 82, No. 5, pp. 7567–7582, Feb. 2023, https://doi.org/10.1007/s11042-022-13251-x
-
S. P. Parida and P. C. Jena, “Free and forced vibration analysis of flyash/graphene filled laminated composite plates using higher order shear deformation theory,” Proceedings of the Institution of Mechanical Engineers, Part C: Journal of Mechanical Engineering Science, Vol. 236, No. 9, pp. 4648–4659, May 2022, https://doi.org/10.1177/09544062211053181
-
J. Dai, Y. Li, K. He, and J. Sun, “R-FCN: object detection via region-based fully convolutional networks,” in 30th International Conference on Neural Information Processing Systems, pp. 379–387, 2016, https://doi.org/10.5555/3157096.3157139
-
W. Liu et al., “SSD: Single Shot MultiBox Detector,” in Computer Vision – ECCV 2016, pp. 21–37, 2016, https://doi.org/10.1007/978-3-319-46448-0_2
-
J. Redmon, S. Divvala, R. Girshick, and A. Farhadi, “You only look once: unified, real-time object detection,” in IEEE Conference on Computer Vision and Pattern Recognition (CVPR), pp. 779–788, 2015, https://doi.org/10.48550/arxiv.1506.02640
-
J. Redmon and A. Farhadi, “YOLO9000: better, faster, stronger,” in 2017 IEEE Conference on Computer Vision and Pattern Recognition (CVPR), pp. 7263–7271, Jul. 2017, https://doi.org/10.1109/cvpr.2017.690
-
J. Redmon and A. Farhadi, “YOLOv3: an incremental improvement,” arXiv:1804.02767, 2018, https://doi.org/10.48550/arxiv.1804.02767
-
A. Bochkovskiy, C.-Y. Wang, and H.-Y. M. Liao, “YOLOv4: optimal speed and accuracy of object detection,” arXiv:2004.10934, 2020, https://doi.org/10.48550/arxiv.2004.10934
-
Z. Bai et al., “Video target detection of East Asian migratory locust based on the MOG2-YOLOv4 network,” International Journal of Tropical Insect Science, Vol. 42, No. 1, pp. 793–806, Feb. 2022, https://doi.org/10.1007/s42690-021-00602-8
-
S. P. Parida and P. C. Jena, “Selective layer-by-layer fillering and its effect on the dynamic response of laminated composite plates using higher-order theory,” Journal of Vibration and Control, Vol. 29, No. 11-12, pp. 2473–2488, Jun. 2023, https://doi.org/10.1177/10775463221081180
-
M. Tian, X. Li, S. Kong, L. Wu, and J. Yu, “A modified YOLOv4 detection method for a vision-based underwater garbage cleaning robot,” Frontiers of Information Technology and Electronic Engineering, Vol. 23, No. 8, pp. 1217–1228, Aug. 2022, https://doi.org/10.1631/fitee.2100473
-
X. Zhang, H. Zeng, and L. Zhang, “Edge-oriented convolution block for real-time super resolution on mobile devices,” in MM ’21: ACM Multimedia Conference, pp. 4034–4043, Oct. 2021, https://doi.org/10.1145/3474085.3475291
-
X. Ding, X. Zhang, J. Han, and G. Ding, “Diverse branch block: building a convolution as an inception-like unit,” in IEEE/CVF Conference on Computer Vision and Pattern Recognition, pp. 10886–10895, 2021, https://doi.org/10.48550/arxiv.2103.13425
-
H. Zhao, X. Kong, J. He, Y. Qiao, and C. Dong, “Efficient image super-resolution using pixel attention,” in Computer Vision – ECCV 2020 Workshops, pp. 56–72, 2020, https://doi.org/10.1007/978-3-030-67070-2_3
-
T. Zhu, W. Qu, and W. Cao, “An optimized image watermarking algorithm based on SVD and IWT,” Journal of Supercomputing, Vol. 78, pp. 222–237, 2022, https://doi.org/10.1007/s11227-021-03886-2.12
-
R. H. Hou, X. W. Yang, Z. C. Wang, and J. X. Gao, “A real-time detection method for forestry pests based on YOLOv4-TIA,” Computer Engineering, Vol. 48, No. 4, pp. 255–261, 2022, https://doi.org/10.19678/j.issn.1000-3428.0060563
-
Q. Wang, B. Wu, P. Zhu, P. Li, W. Zuo, and Q. Hu, “ECA-Net: efficient channel attention for deep convolutional neural networks,” in 2020 IEEE/CVF Conference on Computer Vision and Pattern Recognition (CVPR), pp. 11531–11539, Jun. 2020, https://doi.org/10.1109/cvpr42600.2020.01155
-
P. Yuan et al., “HS-ResNet: Hierarchical-split block on convolutional neural network,” arXiv:2010.07621, 2020, https://doi.org/10.48550/arxiv.2010.07621
-
M. Tan, R. Pang, and Q. V. Le, “Efficientdet: Scalable and efficient object detection,” in IEEE/CVF Conference on Computer Vision and Pattern Recognition (CVPR), pp. 10778–10787, Jun. 2020, https://doi.org/10.1109/cvpr42600.2020.01079
-
K. He, X. Zhang, S. Ren, and J. Sun, “Spatial pyramid pooling in deep convolutional networks for visual recognition,” IEEE Transactions on Pattern Analysis and Machine Intelligence, Vol. 37, No. 9, pp. 1904–1916, Sep. 2015, https://doi.org/10.1109/tpami.2015.2389824
-
K. Li, G. Wan, G. Cheng, L. Meng, and J. Han, “Object detection in optical remote sensing images: A survey and a new benchmark,” ISPRS Journal of Photogrammetry and Remote Sensing, Vol. 159, pp. 296–307, Jan. 2020, https://doi.org/10.1016/j.isprsjprs.2019.11.023
-
G. Cheng, J. Han, and X. Lu, “Remote sensing image scene classification: Benchmark and state of the art,” Proceedings of the IEEE, Vol. 105, No. 10, pp. 1865–1883, Oct. 2017, https://doi.org/10.1109/jproc.2017.2675998
-
S. P. Parida and P. C. Jena, “A simplified fifth order shear deformation theory applied to study the dynamic behavior of moderately thick composite plate,” in Applications of Computational Methods in Manufacturing and Product Design, Singapore: Springer Nature Singapore, 2022, pp. 73–86, https://doi.org/10.1007/978-981-19-0296-3_8
-
S. Wang, H. Wang, F. Yang, F. Liu, and L. Zeng, “Attention-based deep learning for chip-surface-defect detection,” The International Journal of Advanced Manufacturing Technology, Vol. 121, No. 3-4, pp. 1957–1971, Jul. 2022, https://doi.org/10.1007/s00170-022-09425-4
-
S. Wang and K. J. Yang, “Research and implementation of image scaling algorithm based on bilinear interpolation,” Automation Technology and Application, No. 7, p. 44, 2008.
-
Y. L. Yu and Y. B. Mu, “Research on interpolation algorithms,” Modern Computer, Vol. 5, pp. 32–35, 2014.
-
X. Wang et al., “ESRGAN: enhanced super-resolution generative adversarial networks,” in Lecture Notes in Computer Science, Vol. 11133, pp. 63–79, 2019, https://doi.org/10.1007/978-3-030-11021-5_5
Cited by
About this article
This paper is supported by 2022 Education and Teaching Reform Project of the Guangdong Vocational College Teaching Management Guidance Committee under Grant No. YJXGLW2022Z02, Guangdong Higher Vocational Education Teaching Reform Research and Practice Project under Grant GDJG2021007, DongGuan Polytechnic's 2022 Quality Engineering Project KCSZ202201, Research on microphone product design under the background of the “She Economy” project of Dongguan Science and Technology Commissioner in 2023 under Grant No. 20231800500542, Dongguan Science and Technology Commissioner in 2023 under Grant No. 20221800500732, Guangdong HUST Industrial Technology Research Institute, Guangdong Provincial Key Laboratory of Manufacturing Equipment Digitization Project under Grant No. 2020B1212060014 and Dongguan Science, Technology of Social Development Program under Grant No. 20211800904472, Dongguan Science and Technology of Social Development Program under Grant No. 20231800903592 and No.20211800900252, Dongguan Science and Technology Ombudsman Project under Grant No. 20231800500282, Special Projects in Key Fields of Colleges and Universities in Guangdong Province in 2021 under Grant No. 2021ZDZX1093, Special fund for electronic information engineering technology specialty group of national double high program of Dongguang Polytechnic in 2022 under Grant No. ZXB202203, Special fund for electronic information engineering technology specialty group of national double high program of Dongguang Polytechnic in 2022 under Grant No. ZXC202201 and Special fund for electronic information engineering technology specialty group of national double high program of Dongguang Polytechnic in 2022 under Grant No. ZXD202204.
The datasets generated during and/or analyzed during the current study are available from the corresponding author on reasonable request.
Zhihong Wang: conceptualization, methodology, validation, investigation, writing. Chaoying Wang: resources, visualization, funding acquisition, validation, writing. Yonggang Chen: data curation, formal analysis, software, resources, validation, writing – review, funding acquisition. Jianxin Li: revision, data verification, analysis of experimental results.
The authors declare that they have no conflict of interest.
