Abstract
In this present investigation, four important process parameters of catalyst concentration, molar ratio, reaction time, and reaction temperature were studied and optimized using Box Behnken assisted response surface method (RSM) and Genetic Algorithm (GA) to achieve the maximum mahua oil biodiesel yield. For this purpose, 27 experiments were conducted randomly based on the design matrix using statistical software MiniTab®2019. A maximum yield of 91.32 % is achieved in RSM, catalyst concentration and reaction time are identified as influence parameters in biodiesel yield. GA modelling show an improvement of 4.96 % in biodiesel yield compared to RSM approach. Both techniques are successfully tested in prediction and modelling the biodiesel yield from mahua oil. The obtained biodiesel from the transesterification process is blended with standard diesel fuel at various proportions (B10 to B90) and tested for different fuel properties. All the biodiesel blends are observed within the limits of international standards of ASTMD-6751 and EN-14214. The results indicate that the chosen models are highly accurate in achieving maximum biodiesel yield and mahua biodiesel is recommended as the best alternative fuel to diesel engines without any major modifications in the engine design.
Highlights
- Mahua oil Biodiesel Production through Transesterification Process
- Box Behnken assisted Response Surface Method (RSM) Optimization
- Genetic Algorithm (GA) Modelling
- RSM approach Biodiesel Yield is 91.32%
- GA approach Biodiesel Yield is 96.28%
- B10 to B100 Fuel Properties Analysis as per EN-14214 Standards
1. Introduction
Research on renewable energy is gaining more importance nowadays due to the rapid fall of existing energy sources especially fossil fuels. Several theories and demonstrated projects reveal that the existing and available oil resources are on the verge of extinction due to rapid consumption and increase in the global population. Petrochemicals have become an integral part of the society and they play a vital role in energy (power production) and transportation sectors. On the other hand, their harmful exhaust emissions like carbon monoxide, nitrogen oxide, unburnt hydrocarbons, and etc. are increasing the environmental pollution. Therefore, research on clean burning and renewable fuels especially biodiesel are gaining more attention. In general, edible and non-edible oils are used for production of biodiesels. Jatropha, Mahua, Pongamia, Neem, Palm, Soybean, Animal facts, and etc. are the potential sources for biodiesel production [1]. Approximately 350 potential oil bearing crops are identified for biodiesel production [2] among them, Mahua oil is one of the best oil crops which can grow at any environmental conditions. Raw oils possess high kinematic viscosity therefore the direct application is restricted. The high viscosity of the oil can be minimized by following different viscosity reduction techniques [3] and Transesterification is one of the simplest methods which is widely followed by several researchers [4]. In this endeavor, Mahua oil is used for biodiesel production by following the transesterification process. The production cost of biodiesel is more and different parameters like type of feedstock and chemicals that are used play a major role in biodiesel yield and cost. To mitigate the challenges of cost and yield, proper planning of experiments are necessary. For this purpose, optimization techniques are popular. Several factors influence the biodiesel yield, some of them are: catalyst concentration, methanol to oil ratio, reaction time, reaction temperature, and etc. [5, 6]. By analyzing the influence factors in micro level with the advanced techniques of Analysis of Variance (ANOVA), Response Surface Method (RSM), Artificial Intelligence (AI), and Genetic Algorithm (GA) the contributing factors for maximum biodiesel can be estimated [7-9]. R. Satish Kumar et al. [7] achieved a maximum biodiesel yield of 94.83 % from Manilkara Zapota seed oil using Taguchi optimization technique and they also conclude that methanol to oil molar ratio is the most affecting parameter in optimum biodiesel production. In another investigation by Sharath Satya et al. [8] achieved 91.65 % biodiesel yield from palm oil using orthogonal array and they concluded that the obtained biodiesel meets the international fuel property standards. Artificial neural network (ANN) and RSM techniques have been used by R. Selvaraj et al. [9] to predict the free fatty acid methyl esters from waste cooking oil and the maximum biodiesel yield is estimated by regression values (). It is concluded that both RSM and ANN predicts the biodiesel yield accurately. Genetic Algorithm (GA) is chosen as a tool to reduce the production cost of the biodiesel as investigated by Masoud Goharimanesh et al. [10]. They concluded that reaction temperature is the influence parameter and it is predicted by multi-objective GA. Statistical tools like response surface method (RSM), Taguchi, Screening, and factorial design are popular in MiniTab statistical software on the other hand, Artificial Neural Network (ANN), Genetic Algorithms (GA), Fuzzy logic, and etc. are gaining more importance in solving the complex numerical problems. In this endeavor, RSM based Box-Behnken design matrix is used for conducting 27 experiments and the experimental results are trained in GA for prediction and very limited literature is available on this combo techniques for mahua oil biodiesel production. The modelling and training of GA is based on the fitness function which reveal the optimum process parameters for maximum biodiesel yield which can be considered as a novel approach.
2. Methodology
Raw Mahua oil is collected from the Araku valley in Visakhapatnam, India. Different chemicals of analytical grade were purchased from Merck Chemicals Bangalore, India. Sodium hydroxide, Sulphuric acid, and Methanol were used during the biodiesel production.
2.1. Transesterification of Mahua oil
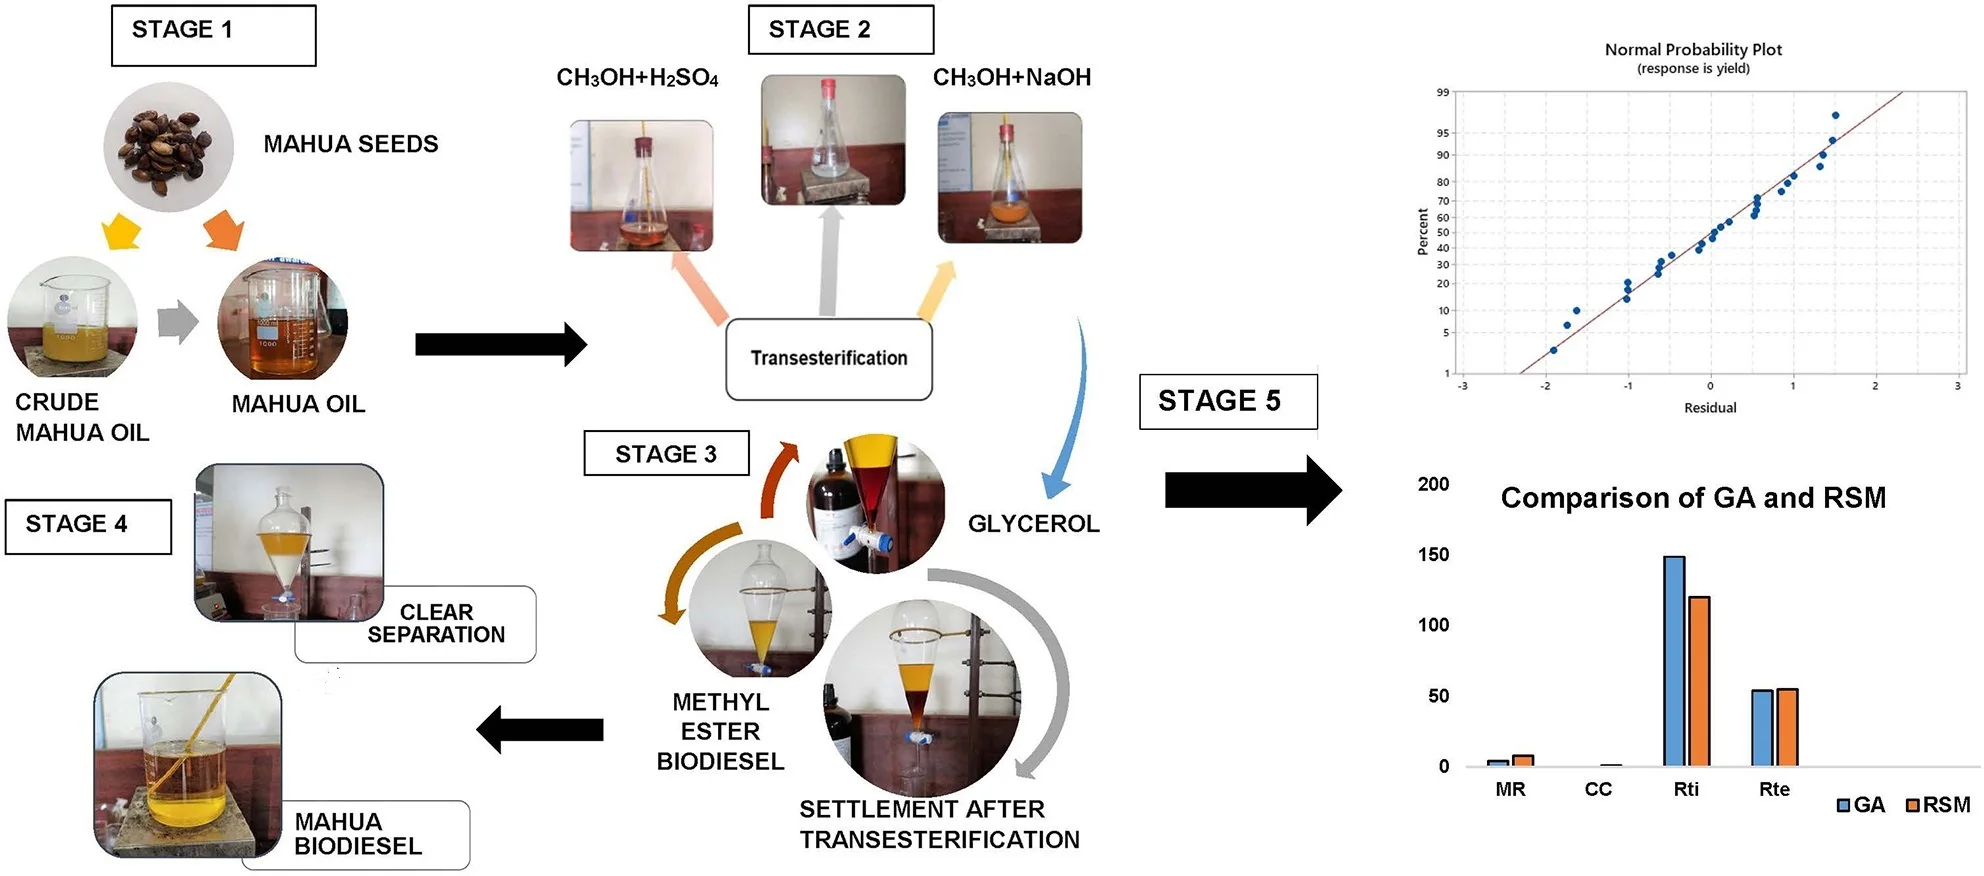
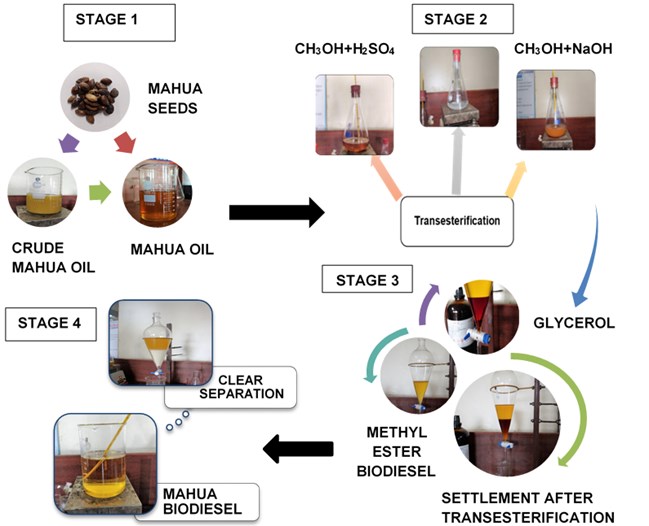
Raw Mahua oil is preheated to 110 °C to remove the moisture and it is filtered with a filter paper to eliminate any traces of impurities or suspended particles. The filtered oil samples are measured to the required quantities and stored in airtight beakers to avoid moisture contact. Raw oils can also be used in diesel engines as investigated by several researchers and they concluded that due to the high viscosity (>8 cSt) of the oil results in poor atomization of the fuel inside the combustion chamber during combustion and excessive smoke with low efficiency were recorded. Therefore, the direct application of high viscous oils is restricted in diesel engines. To mitigate the challenge of high viscosity in raw oils different techniques have been used by the researchers [3]. Transesterification is the commonly used and most popular technique which converts the high viscous raw oils to methyl or ethyl esters in the presence of alcohol and acid. Due to high yield and low energy consumption in this endeavor, the transesterification technique is followed to convert the raw mahua oil to methyl esters of mahua. Fig. 1 represent the detailed stages in the transesterification process and different chemicals that are used during each stage are presented. Eq. (1) represents the chemical formula for the conversion of raw oils to biodiesel. In this, free fatty acids (FFAs) react with alcohol to form esters (Biodiesel). In this research, the effect of Methanol to oil molar ratio (4:1, 8:1, and 12:1), Catalyst Concentration (0.3 %, 0.6 %, and 0.9 %), Reaction time (90, 120, and 150 minutes), and Reaction temperature (45°C, 50 °C, and 55 °C) at different proportions are investigated to achieve the optimum combination for better biodiesel yield. The maximum biodiesel yield is calculated from the Eq. (2). The final samples of the biodiesel are characterized for different property analysis by following the international fuel standards and Table 1 represent the properties in comparison with neat diesel fuel:
Fig. 1Stages of biodiesel production
3. Optimization by response surface method (RSM)
The aim of this investigation is to achieve the maximum biodiesel yield and to predict the important influencing parameters which contribute to achieve maximum biodiesel yield. For this purpose, RSM and Box Behnken design are used with the advent of the statistical software MiniTab®2019. Initially, Methanol to oil molar ratio (MR), Catalyst Concentration (CC), Reaction time (RTi), and Reaction temperature (RTe) levels are chosen based on the selected method as shown in Table 2. Then the experiments were conducted based on the RSM design matrix as shown in Table 3.
Table 1Properties of diesel, mahua biodiesel and its blends
Property | D | B10 | B20 | B30 | B40 | B50 | B60 | B70 | B80 | B90 | B100 |
Viscosity (cSt) | 2.3 | 2.4 | 2.7 | 2.8 | 3.0 | 3.25 | 3.5 | 3.6 | 3.8 | 4 | 4.2 |
Flash point (°C) | 53 | 64 | 76 | 88 | 100 | 112 | 123 | 135 | 146 | 158 | 170 |
Fire point (°C) | 89 | 97.5 | 107 | 116.5 | 125 | 126.5 | 135 | 147 | 161 | 174 | 195 |
Cloud point (°C) | 1 | 2 | 3 | 5 | 6 | 7 | 8 | 9 | 11 | 12 | 13 |
Pour point (°C) | –8 | –7 | –5 | –4 | –2 | –1 | 0 | 2 | 3 | 4 | 6 |
Calorific value (MJ/kg) | 42 | 41.55 | 41.35 | 40.9 | 40.65 | 40.25 | 39.8 | 39.4 | 39.25 | 38.77 | 38.5 |
Sulphur content (%) | 36.4 | 33.5 | 30.1 | 27.5 | 21.6 | 17.3 | 13.4 | 11.3 | 6.2 | 2.1 | Nil |
Density (g/m3) | 0.824 | 0.829 | 0.835 | 0.841 | 0.847 | 0.853 | 0.858 | 0.864 | 0.870 | 0.876 | 0.882 |
Cetane Index | 51 | 51.6 | 52.2 | 52.8 | 53.4 | 54 | 54.6 | 55.2 | 55.8 | 56.4 | 57 |
Table 2Design matrix
S. No | Factors | Range of levels | ||
Low | Medium | Large | ||
1 | Molar ratio | 4:1 | 8:1 | 12:1 |
2 | Catalyst concentration (W %) | 0.3 | 0.6 | 0.9 |
3 | Reaction temperature (°C) | 45 | 50 | 55 |
4 | Reaction time (minutes) | 90 | 120 | 150 |
Table 3Box-Behnken response surface design experimental runs
S. No | Molar ratio | Catalyst concentration | Reaction time | Reaction temperature |
1 | 4 | 0.6 | 120 | 45 |
2 | 4 | 0.3 | 120 | 50 |
3 | 12 | 0.9 | 120 | 50 |
4 | 12 | 0.6 | 90 | 50 |
5 | 8 | 0.6 | 150 | 45 |
6 | 4 | 0.6 | 150 | 50 |
7 | 12 | 0.6 | 150 | 50 |
8 | 8 | 0.6 | 150 | 55 |
9 | 8 | 0.6 | 120 | 50 |
10 | 8 | 0.6 | 120 | 50 |
11 | 12 | 0.6 | 120 | 55 |
12 | 4 | 0.6 | 90 | 50 |
13 | 8 | 0.6 | 120 | 50 |
14 | 8 | 0.3 | 120 | 45 |
15 | 8 | 0.9 | 120 | 45 |
16 | 8 | 0.9 | 120 | 55 |
17 | 4 | 0.6 | 120 | 55 |
18 | 4 | 0.9 | 120 | 50 |
19 | 8 | 0.6 | 90 | 55 |
20 | 8 | 0.3 | 120 | 55 |
21 | 8 | 0.6 | 90 | 45 |
22 | 8 | 0.9 | 90 | 50 |
23 | 8 | 0.9 | 150 | 50 |
24 | 12 | 0.6 | 120 | 45 |
25 | 8 | 0.3 | 90 | 50 |
26 | 12 | 0.3 | 120 | 50 |
27 | 8 | 0.3 | 150 | 50 |
where DF is theDegree of freedom and SS is the sum of squares, and:
where is the number of experimental data, is the predicted values and is the experimental values.
4. Results and discussions
4.1. Property analysis
The obtained mahua methyl ester (MME) from the transesterification process is mixed with neat diesel fuel at different percentages varying from 10 % to 90 % with an increment of 10 % by volume (B10 to B90). All the percentages are mixed evenly with the help of high speed sonicator. Each fuel sample from B10 to B90 are characterized for different physiochemical properties like viscosity, flash point, fire point, cloud point, pour point, calorific value, sulphur content, density, and Cetane index were measured by following international fuel standards of ASTMD-6751 and EN-14214 are presented in Table 1. Mathematical formulas that are used during the calculation of different fuel properties are presented in Eqs. (7-10). The viscosity and Cetane number are increased with the increase in the blend percentage in the diesel fuel. High viscosity may result in poor atomization of the fuel inside the combustion chamber, on the other hand, high Cetane number lower the delay period during the combustion. Lower calorific value is recorded for neat biodiesel and it increases with decrease in blend percentage. All the blends are recorded within the limits of the fuel standards:
The cetane number (CN) for the blends (B10 to B90) are calculated assuming cetane number is linear combination [11] of the components by using the equation:
where base fuel is the diesel fuel CN (60.2) and test fuel CN is neat biodiesel (63.63).
4.2. Analysis of optimization conditions in RSM
Tests were conducted in accordance with the Box-Behnken surface response design using statistical analysis software MiniTab®2019. The biodiesel optimization is carried out using 4 factors at three levels with 27 experimental runs. Molar ratio, catalyst concentration, reaction time and reaction temperature are the four response variables. After the successful completion of selected experimental runs, the response biodiesel yield is applied in a quadratic Eq. (11) which correlates the response variable to the independent variable. Table 4 represents the 27 experimental design matrix and the experimental runs, were randomized to eliminate the systematic errors. Based on the chosen response parameters, the quadratic regression model with their coefficients for statistical prediction is defined in the Eq. (12) and Table 5 represents the coded coefficients with computed T-values and corresponding P-values:
where is the yield (response), is the process (independent) variable (methanol:oil molar ratio, catalyst concentration, reaction temperature and reaction time, i.e., MR, CC, RTi and RTe, respectively), , , and are regression coefficients ( 1, 2, 3, 4 and ).
Table 4Box-Behnken response surface design and predicted yield values for biodiesel yield
S. No | Molar ratio | Catalyst concentration | Reaction time | Reaction temperature | Yield (%) | Pre. yield (%) |
1 | 4 | 0.6 | 120 | 45 | 75.53 | 74.87 |
2 | 4 | 0.3 | 120 | 50 | 75.67 | 74.50 |
3 | 12 | 0.9 | 120 | 50 | 77.71 | 79.83 |
4 | 12 | 0.6 | 90 | 50 | 73.41 | 73.02 |
5 | 8 | 0.6 | 150 | 45 | 84.53 | 85.72 |
6 | 4 | 0.6 | 150 | 50 | 77.65 | 77.36 |
7 | 12 | 0.6 | 150 | 50 | 77.43 | 76.77 |
8 | 8 | 0.6 | 150 | 55 | 87.66 | 89.61 |
9 | 8 | 0.6 | 120 | 50 | 83.82 | 83.99 |
10 | 8 | 0.6 | 120 | 50 | 85.07 | 83.99 |
11 | 12 | 0.6 | 120 | 55 | 77.02 | 77.38 |
12 | 4 | 0.6 | 90 | 50 | 71.54 | 71.52 |
13 | 8 | 0.6 | 120 | 50 | 83.08 | 83.99 |
14 | 8 | 0.3 | 120 | 45 | 82.11 | 82.91 |
15 | 8 | 0.9 | 120 | 45 | 89.31 | 89.99 |
16 | 8 | 0.9 | 120 | 55 | 91.32 | 89.84 |
17 | 4 | 0.6 | 120 | 55 | 75.63 | 76.37 |
18 | 4 | 0.9 | 120 | 50 | 77.42 | 78.79 |
19 | 8 | 0.6 | 90 | 55 | 83.22 | 82.98 |
20 | 8 | 0.3 | 120 | 55 | 88.51 | 87.15 |
21 | 8 | 0.6 | 90 | 45 | 83.77 | 82.77 |
22 | 8 | 0.9 | 90 | 50 | 87.53 | 87.13 |
23 | 8 | 0.9 | 150 | 50 | 90.34 | 90.33 |
24 | 12 | 0.6 | 120 | 45 | 75.83 | 74.78 |
25 | 8 | 0.3 | 90 | 50 | 78.65 | 80.66 |
26 | 12 | 0.3 | 120 | 50 | 74.78 | 74.36 |
27 | 8 | 0.3 | 150 | 50 | 86.93 | 87.03 |
Table 5Analysis of variance for biodiesel yield (%)
S. No | Term | Coef | SE Coef | T-Value | P-Value | VIF |
1 | Constant | 83.990 | 0.840 | 100.03 | 0.000 | |
2 | MR | 0.228 | 0.420 | 0.54 | 0.596 | 1.00 |
3 | CC | 2.248 | 0.420 | 5.36 | 0.000 | 1.00 |
4 | RTi | 2.202 | 0.420 | 5.24 | 0.000 | 1.00 |
5 | RTe | 1.023 | 0.420 | 2.44 | 0.031 | 1.00 |
6 | MR*MR | –9.272 | 0.630 | –14.72 | 0.000 | 1.25 |
7 | CC*CC | 2.061 | 0.630 | 3.27 | 0.007 | 1.25 |
8 | RTi*RTi | –0.142 | 0.630 | -0.22 | 0.826 | 1.25 |
9 | RTe*RTe | 1.331 | 0.630 | 2.11 | 0.056 | 1.25 |
10 | MR*CC | 0.295 | 0.727 | 0.41 | 0.692 | 1.00 |
11 | MR*RTi | –0.522 | 0.727 | –0.72 | 0.486 | 1.00 |
12 | MR*RTe | 0.272 | 0.727 | 0.37 | 0.714 | 1.00 |
13 | CC*RTi | –1.368 | 0.727 | –1.88 | 0.085 | 1.00 |
14 | CC*RTe | –1.098 | 0.727 | –1.51 | 0.157 | 1.00 |
15 | RTi*RTe | 0.920 | 0.727 | 1.27 | 0.230 | 1.00 |
Table 6Significance tests and ANOVA results
S. No | Source | DF | Adj SS | Adj MS | F-Value | P-Value |
1 | Model | 14 | 837.110 | 59.794 | 28.27 | 0.000 |
2 | Linear | 4 | 132.020 | 33.005 | 15.60 | 0.000 |
3 | MR | 1 | 0.626 | 0.626 | 0.30 | 0.596 |
4 | CC | 1 | 60.660 | 60.660 | 28.68 | 0.000 |
5 | TIME | 1 | 58.168 | 58.168 | 27.50 | 0.000 |
6 | TEMP | 1 | 12.567 | 12.567 | 5.94 | 0.031 |
7 | Square | 4 | 687.669 | 171.917 | 81.28 | 0.000 |
8 | MR*MR | 1 | 458.474 | 458.474 | 216.76 | 0.000 |
9 | CC*CC | 1 | 22.651 | 22.651 | 10.71 | 0.007 |
10 | TIME*TIME | 1 | 0.107 | 0.107 | 0.05 | 0.826 |
11 | TEMP*TEMP | 1 | 9.446 | 9.446 | 4.47 | 0.056 |
12 | 2-Way Interaction | 6 | 17.421 | 2.903 | 1.37 | 0.301 |
13 | MR*CC | 1 | 0.348 | 0.348 | 0.16 | 0.692 |
14 | MR*TIME | 1 | 1.092 | 1.092 | 0.52 | 0.486 |
15 | MR*TEMP | 1 | 0.297 | 0.297 | 0.14 | 0.714 |
16 | CC*TIME | 1 | 7.480 | 7.480 | 3.54 | 0.085 |
17 | CC*TEMP | 1 | 4.818 | 4.818 | 2.28 | 0.157 |
18 | TIME*TEMP | 1 | 3.386 | 3.386 | 1.60 | 0.230 |
19 | Error | 12 | 25.381 | 2.115 | ||
20 | Lack-of-Fit | 10 | 23.358 | 2.336 | 2.31 | 0.340 |
21 | Pure Error | 2 | 2.023 | 1.012 | ||
22 | Total | 26 | 862.491 |
4.3. Analysis of variance (ANOVA) analysis
In order to determine the fitness and significance of the model ANOVA test is performed. This test determines the significance of individual parameters and their interaction. From Table 6 it is evident that the chosen model is highly significant based on the highest value of (28.68) and lower value (0.000). The value represents the probability of error and it also used to verify the significance and interaction effect of chosen regression coefficients. From Table 6 value of 0.0000 indicates that a probability of getting a large value due to noise is very low and even negligible. In this case, Catalyst concentration (CC), Reaction time (RTi), and Methanol to oil molar ratio () have a significant effect on mahua biodiesel production. CC is regarded as the most important significant variable during the production of mahua biodiesel and it can be verified by the highest value (28.68). Molar ratio and reaction temperatures show an insignificant effect on biodiesel yield. This may be due to the increase in both molar ratio and reaction temperature may slow down the transesterification reaction. By comparing the values for the response variable and independent variable lack of fit can be defined. In general, if their difference is more than 0.05 then the chosen variables are significant and indicate that there is a good fit between the response and independent variable. From Table 6 value 2.31 and value 0.340 are the lack of fit parameters. The coefficient of determination () from Eq. (3) reveals the quality of the chosen model fitness. In this endeavor, coefficient of determination () is 97.06 % and the adjusted coefficient of determination (Adj ) from Eq. (4) is 93.62 % this shows that the chosen model is having good accuracy.
Regression equation:
4.4. Analysis of response parameters
The interaction effects of the process parameters during transesterification were analyzed by plotting three-dimensional surface and contour plots. Figs. 2-7 represents three dimensional surface responses against two independent variables while keeping other variables at the central level. These plots envisage the interaction effect of the variables and to determine the optimum level of each variable for maximum response.
Fig. 23D surface plot for yield vs CC and MR
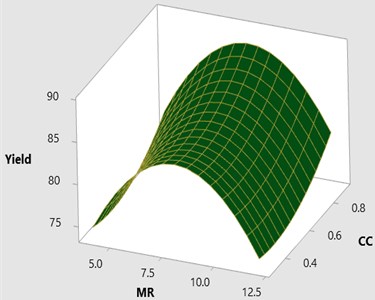
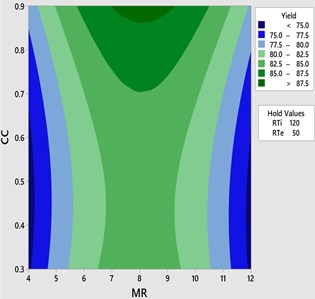
Fig. 3Contour plot for yield vs CC and MR
4.4.1. Effect of MR to CC
Fig. 2-3 shows the 3D response surface and 2D contour plot between methanol to oil molar ratio (MR) and catalyst concentration (CC) for the fixed reaction temperature (RTe) of 50 °C and reaction time (RTi) at 120 minutes as defined by the Box-Behnken matrix. The biodiesel yield is increased with respect to increase in the catalyst concentration from 0.3 to 0.9 and it is observed that maximum biodiesel yield is achieved at a molar ratio of 8:1 with the catalyst concentration of 8:1. However, there is a possibility to increase the methanol percentage (MR) from 8:1 to 12:1 by keeping the catalyst concentration remains unchanged (0.9) at this combination the reaction temperature is maintained at 50°C and it is observed that there is a drop in the mahua biodiesel yield of 77.07 %. This might be due to excess methanol may shift the equilibrium state which results in a low conversion rate of biodiesel. In general, three moles of methanol is required for conversion of one mole of triglyceride. Excess methanol may also result in hinder the glycerin separation and also leads to the heating difficulty which eventually results in high glycerin formation with low yield. From ANOVA results as shown in Table 5 molar ratio is recorded as insignificant with the value of 0.596 and catalyst concentration is recorded as most significant.
4.4.2. Effect of CC to reaction time and temperature
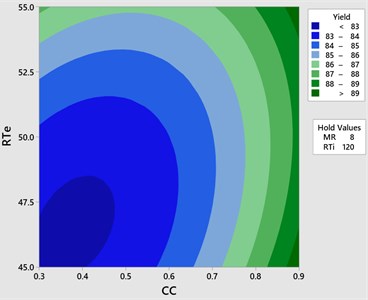
The effect of catalyst concentration (CC), reaction time (Rti) and reaction temperature (Rte) on the mahua biodiesel yield is shown in the surface (3D) and contour (2D) plots in Figs. 4, 5. While keeping the molar ratio and temperature as constant, response surface corresponding to the second-order model indicates that for high RTi, biodiesel production increases with an increasing CC. Maximum biodiesel yield is obtained at catalyst concentration of 0.9 with reaction time of 150 minutes. At maximum reaction time optimum biodiesel yield is recorded and this may be due to dissolution of formed glycerin in methanol at maximum reaction time. Therefore, reaction time is indicated as the second most significant factor as presented in ANOVA Table 6. In general, there are two important reactions that took place when the catalyst NaOH dissolved in methanol: transesterification to produce methyl esters and saponification to produce soap formation. If the reaction time and temperature are favour to the saponification then, the overall process of transesterification is decreased. Here the catalyst NaOH acts as a reagent on saponification reaction and as a catalyst in the transesterification reaction.
From Figs. 6, 7 it is evident that the transesterification reaction is favoured when adequate temperatures are maintained. At low temperatures, the saponification reaction decreases with the increase in the reaction temperatures the reaction rate is also increased due to high energy in the molecules. Increasing the reaction temperature and catalyst concentration resulted in the improvement in biodiesel yield. When the reaction temperatures are higher, the transesterification reaction is faster than the saponification reaction and maximum biodiesel yield is achieved (100 %).
Fig. 43D surface plot yield vs CC & RTe
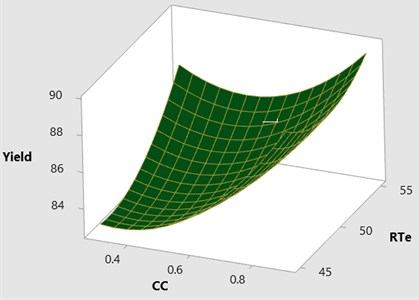
Fig. 5Contour plot yield vs CC & RTe
4.5. Optimization by genetic algorithm analysis
The Genetic algorithm (GA) approach is based on Darwin’s theory of evolution. Due to the wide application of GA in this endeavor, GA is used to check the accuracy of the predicted model. GA is successfully tested to the regression model obtained from RSM for optimization of variable process parameters of MR, CC, Rti, and Rte to achieve the maximum mahua oil biodiesel yield. GA reveals the information regarding probabilistic selection for generating the population of a problem solution. Initially, the population (Iterations) of individuals are chosen by default or random values to test each member of that population through a fitness function. Normally, when GA is trained in the MATLABR2019a it automatically generates the initial population based on the constraints [12]. The selection of variables for population reproduction is defined by the reproduction function. These function repeats the evaluation and reproduction until a desired number of iteration has achieved. At the end, GA presents the best member according to the fitness function. Population size, crossover function, crossover fraction, elite count, number of generations, and mutation fraction are the variable parameters that are used for investigation. The best solution is recorded as an elite solution.
Fig. 63D surface plot yield vs CC and RTi
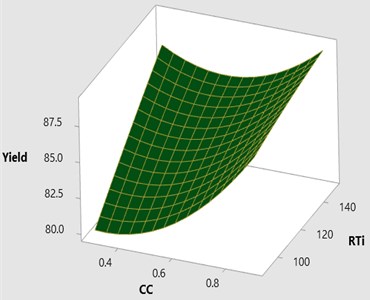
Fig. 7Contour plot yield vs CC and RTi
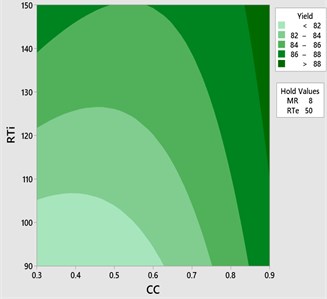
Fig. 8Best fitness –96.2847, mean –96.2811
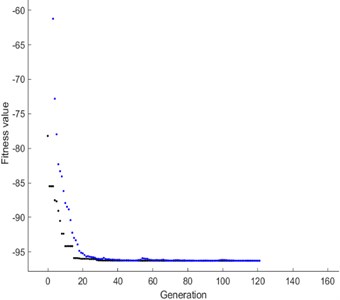
Fig. 9Average distance between individuals
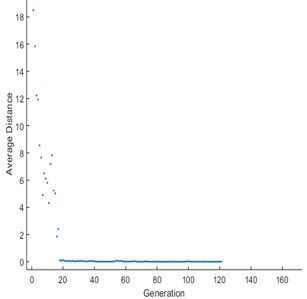
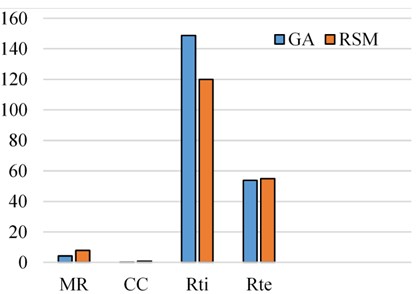
Initially, the population size of 80 is defined and the scaling function (Rank) is used to remove the effect of the spread of the raw scores. The selection function is used to choose the parents for the next generation based on the scaled values from defined scaling function. The Stochastic uniform selection function is used in this endeavor to filter the population by the value. Creation of new children is determined by reproduction function in which elite count and cross over fraction are used. The condition for elite count for implementation, it should be a positive integer and less than or equal to the population size. In this investigation 1 is chosen as elite count and 0.9 as a cross over fraction. Cross over and mutation are known as correction algorithms and they can be varied in accordance to achieve the maximum biodiesel yield. The best and mean value of 96.28 % is recorded from the GA by repeatedly training the process parameters and this process is continued until the limit of stopping condition. The fitness of the best individual in the current population is shown in Figs. 8, 9 and this can be achieved with the increase in the iterations. The fitness values after successive generations showing a gradual convergence to an optimum value. After 121 generations the fitness value reached a minimum value and then remain constant. In general, the best fitness function value can be defined as minimum and also can be termed as zero. From the Fig. 8 the best fitness values is –96.2847 which close to zero. The gradual reduction of fitness value will reached to a condition where further reduction will not takes place and maintain as constant. This shows that total population is improved and optimum solution is achieved. The diversity in the initial population may affect the GA performance, if the average distance between the individuals is large then it represents high diversity on the other hand it represents low diversity. The same can be evident in the average distance versus generation plot as shown in Fig. 9. The effective contributions of process parameters in convergence of mahua oil to biodiesel are shown in Fig. 10. The best optimum conditions obtained after a complete evaluation of GA are methanol-to-oil molar ratio of 4.25:1, catalyst concentration is 0.31, reaction time 148.78 minutes and reaction temperature 53.9 °C with a yield of 96.28 %. Fig. 11 represents the comparative graph between the RSM and GA for the same process parameters.
Fig. 10Current best individual
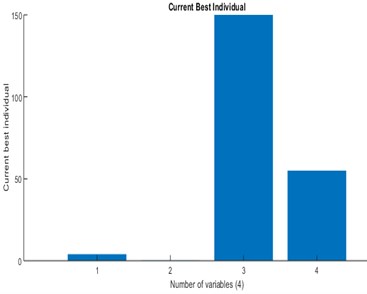
Fig. 11Comparison of GA and RSM
5. Conclusions
The main objective of this present investigation is to introduce the combination of statistical tools of RSM and GA in improving the mahua oil biodiesel yield. GA is chosen as a fast and efficient solution to solve the complex statistical problems in real time. Based on the experimental investigation the following conclusions are drawn.
1) The high viscosity of the raw mahua oil (23 cSt) is reduced to 4.2 cSt successfully by two-stage transesterification process.
2) Neat mahua biodiesel is blended with diesel fuel at various blend ratios from 10 % to 90 % with an increment of 10 % by volume.
3) Neat biodiesel and its blends are tested for different fuel properties by following the international standards of EN-14214 and ASTM-D6751. All the fuel properties of biodiesel and its blends are recorded in acceptable limits.
4) Catalyst concentration, molar ratio, reaction time and temperature are considered as process parameters that are accomplished by response surface methodology using MiniTab2019 statistical software.
5) Based on Box Behnken design matrix experiments were conducted randomly and the optimum biodiesel yield of 91.32 % is recorded at catalyst concentration of 0.9 w%, molar ratio of 8:1, reaction time of 120 minutes, and 55°C reaction temperature.
6) From the analysis of variance (ANOVA) catalyst concentration and reaction time are recorded as most influence factors on the mahua oil biodiesel yield. Coefficient of determination (R2) is 97.06 % is achieved which shows that the chosen model is best fit.
7) Box Behnken assisted response surface method (RSM) optimal result was trained in the Genetic Algorithm (GA) for modelling.
8) For GA approach four input variables are used to optimize the mahua oil biodiesel yield. 96.28 % yield is achieved in GA at catalyst concentration of 0.31 w%, molar ratio of 4.25:1, reaction time 148.78 minutes and reaction temperature at 53.9 °C.
9) GA technique shows an improvement of 4.96 % in mahua oil biodiesel in comparison to the RSM technique at the same reaction variables.
10) From the set of experimental results the fitness function values in GA provide a quick optimum solution.
11) Both RSM and GA are successfully implemented in production optimization and modelling of mahua oil biodiesel. Therefore, it is concluded that mahua oil biodiesel can be used as an alternative fuel in compression ignition engines in neat form or blend with diesel fuel.
References
-
Digambar Singh, Dilip Sharma, S. L. Soni Sumit Sharma, Pushpendra Kumar Sharma, Amit Jhalani A review on feedstocks, production processes, and yield for different generations of biodiesel. Fuel, Vol. 262, 2020, p. 116-553.
-
Selvaraj R., Praveenkumar R., Ganesh Moorthy I. A comprehensive review of biodiesel production methods from various feedstocks. Biofuels, Vol. 10, Issue 3, 2019, p. 325-333.
-
Aditya Kolakoti, Appa Rao B. V. A comprehensive review of biodiesel application in IDI engines with property improving additives. I-manager’s Journal on Mechanical Engineering, Vol. 5, Issue 4, 2015, p. 35-45.
-
Alchris Woo Go, Sylviana Sutanto, Lu Ki Ong, Phuong Lan Tran Nguyen, Suryadi Ismadji, Yi Hsu Ju Developments in in-situ (trans) esterification for biodiesel production. Renewable and Sustainable Energy Reviews, Vol. 60, 2016, p. 284-305.
-
Coello C. A. A comprehensive survey of evolutionary-based multiobjective optimization techniques. Knowledge and Information System, 1999, p. 269-308.
-
Rajesh Y., Aditya Kolakoti, Sheakar Chandra B. G., Bhargavi J. Optimization of biodiesel production from waste frying palm oil using definitive screening design. International Journal of Engineering, Science and Technology, Vol. 11, Issue 5, 2019, p. 48-57.
-
Kumar Sathish R., Sureshkumar K., Velraj R. Optimization of biodiesel production from Manilkara zapota (L.) seed oil using Taguchi method. Fuel, Vol. 140, 2015, p. 90-96.
-
Sharath Satya, Aditya Kolakoti, Naga Raju B., Shyam Sundar R., Ranga Rao Optimization of palm methyl ester and its effect on fatty acid compositions and cetane number. Mathematical Models in Engineering, Vol. 5, Issue 1, 2019, p. 25-34.
-
Selvaraj R., Ganesh Moorthy I., Vinoth Kumar R., Sivasubramanian V. Microwave mediated production of FAME from waste cooking oil, modelling and optimization of process parameters by RSM and ANN approach. Fuel, Vol. 237, 2019, p. 40-49.
-
Masoud Goharimanesh, Ali Lashkaripour, Aliakbar Akbari Optimization of biodiesel production using multi-objective genetic algorithm. Journal of Applied Science and Engineering, Vol. 19, Issue 2, 2016, p. 117124.
-
Abed K. A., El Morsi A. K., Sayed M. M., Elshaib A. A., Gad M. S. Effect of waste cooking-oil biodiesel on performance and exhaust emissions of a diesel engine. Egyptian Journal of Petroleum, Vol. 27, Issue 4, 2018, p. 985-989.
-
Panchanand Jha, Bibhuti Bhusan Biswal Optimization Approach for Inverse Kinematic Solution IntechOpen, 2017, https://doi.org/10.5772/intechopen.71409.
About this article

The authors would like to thank Prof B V Appa Rao for his valuable suggestion on Transesterification process. Fuels laboratory, Raghu Engineering College is acknowledged for providing the facilities to undertaken the research.
