Abstract
The application of biodiesel in internal combustion engines are increasing at a faster rate, due to the fact that biodiesel posses more oxygen content (Approximately 12 %), which helps in the complete combustion of the fuel. On the other hand the production cost of the biodiesel is high compared to mineral diesel fuel. This may be due to the availability of raw oil and its high initial cost. To minimize the high initial cost of the biodiesel used cooking oil is one of the best solutions. In this paper an attempt was made to analyze the fatty acid compositions and other characteristics of used cooking oil. Optimization techniques like response surface methodology (RSM) was successfully used for better yield estimation with the help of advanced software Design Expert. The optimum values of the variables were: oil to methanol ratio (1:8.37), catalyst concentration (0.74 Wt%), reaction temperature (47.950 °C) and reaction time (54.58 min) at 250 rpm. The predicted response value at these optimum values was 96.15 %. To confirm these optimum values, experimentations were conducted based on the optimum values and achieve the yield of 96 %. This shows that the yield of used cooking oil methyl ester is very near to the optimum value with an error of 0.15 % which may be accepted. This showed that the model correctly explains the influence of the process variables on the production of FAME from used cooking oil (UCOME). And from the gas chromatography results there is equal distribution of saturated and unsaturated fatty acids. 14 % oxygen can be acclaimed in UCOME by elemental analysis. Unsaturated level of fatty acids are observed.
1. Introduction
Due to stringent norms imposed by the Government on vehicular emissions, rapid increase of environmental pollutions and increase of crude oil price will lead to search for an alternative fuel. Research has been conducted [1-4] on different types of edible and non-edible oils as an alternative fuel to replace the diesel fuel. It has been concluded that the properties of biodiesel are almost similar or some-times even better in the case of cetane number, heating value and oxygen content. These unique properties will help in improving the combustion efficiency and decrease in exhaust emissions [5, 6].
Despite these various advantages of the biodiesel as mentioned above their practical applications are limited. The reason may be due to the shelf life of the biodiesel is less, fuel injector jam, highly reactive with plastic material, high bulk modulus and the major obstacle is the cost involved in their production. The most significant method to minimize the cost of the raw oil is by proper utilization of used cooking oils which are available abundantly.
An internal survey was conducted in our university hostels regarding the availability of used cooking oils. Approximately 500 liters/day, oil is being used for cooking and there will be around 300 liters/day oil is available as used oil. Likewise, if we collect the used oil from restaurants, hospitals etc. within the city limits, it will be approximately 10000 liters/day of oil being available. If these oils can be utilized for biodiesel production, it can save the raw oil production cost and on the other hand it restricts their dumping into the environment. If one liter of used oil/ waste cooking oil is mixed with water, it will spoil one million liters.
By considering the above factors, an attempt was made to choose used cooking oil in our experimentations. Literature on the used oils reveal that: The tail pipe emissions like NOx, HC, CO and smoke are reduced [7]. The thermal efficiency of the biodiesel fueled engine is increased by 3 % and it act as the best lubricant [8].
The conversion of raw oils to methyl or ethyl ester can be done by different methods [9]. Transesterification is most popular and universally accepted method. Hence in this research transesterification of methyl ester with Optimization technique are collaborated with the help of computer software. These techniques will help in ease of doing the complicated mathematical calculations. In this research Design Expert 11 software was used to calculate the maximum yield of the biodiesel. Literature on optimization techniques reveal that, Chinyere B. et.al [10] used central composite design of response surface methodology to delineate the effects of five levels, four factors on lard biodiesel yield. He concluded that the statistical model predicted that the highest conversion yield of lard biodiesel would be 96.2 %. The optimization technique like central composite design [10-12] can be successfully applied on different feed stokes like palm oil, lard oil, soybean oil, cotton seed oil, rapeseed oil, coconut oil, rice brown etc. and to study their effect of process variables.
2. Materials and methods
2.1. Materials
Raw used cooking oil was collected from our University hostel canteen. Methanol (99.23 % Pure) was obtained from Sigma Aldrich chemical limited India. Sodium hydroxide and sulfuric acid were obtained from Finar-chemicals limited India.
2.2. Data acquisition procedure
2.2.1. Transesterification of used cooking oil
Raw oil which was collected from hostel canteen was heated and filtered with surgical cotton to remove unwanted traces present in it. The production of methyl esters was processed in two stages, initially esterfication followed by transesterification. In general used oil posses high viscosity i.e. presence of high free fatty acids. In order to break down the high free fatty acids, two stage acid and base treatment process is widely used [13-15]. The first step is to esterifies the free fatty acids (FFA) with methanol by acid catalyst (H2SO4) and the second step is transesterification of the pre-treatment product by using base catalyst (NaOH). Although the esterfication reaction in pre-treatment step changes the FFAs in used oil into corresponding fatty acid methyl ester are known as biodiesel. The unconverted FFA and triglycerides were still remaining in the pre-treated oil. For that transesterification reaction process was performed to completed the reaction. Transesterification consists of a sequence of three reversible reactions [8, 16]: consecutive times in which each of the fatty acids bound to the glycerol. The first step is the conversion of triglycerides to diglycerides, followed by the conversion of diglycerides to monoglycerides and finally, monoglycerides to glycerin, producing one ester molecule per glyceride at each step. The Products are the fatty acid esters (biodiesel) and the Glycerol which is another product used in the pharmaceutical industry, food and cosmetics.
In this experiment a batch reactor of 500 ml capacity equipped with a magnetic stirrer with rpm control. Used cooking oil (Fig. 1(a)) was heated to 110 °C to remove the moisture content present in it (Fig. 1(c)). A measured amount of catalyst (Sodium hydroxide) was then thoroughly mixed with methanol till it dissolved completely to give sodium methoxide (Fig. 1(b)). After desired time the mixture is transferred into separating funnel and allowed to settle. There will be two distinct layers, which were observed in the reaction mixture (Fig. 1(d)); a thick brown layer (Glycerol) which is heavy and it is settled at the bottom, the upper layer (Biodiesel). The obtained methyl esters were washed with distilled water to remove un-reacted catalyst, methanol and residual glycerol. After completion of water wash the methyl esters were heated and preserved in glass bottles for property study. The Yield of the biodiesel was calculated by the following Eq. (1):
Fig. 1Stages of biodiesel production
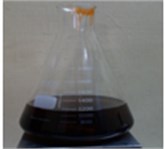
a) Raw oil
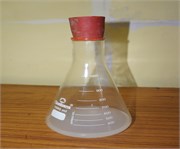
b) Sodium hydroxide preparation
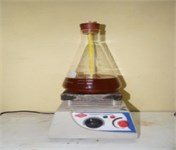
c) Transesterification

d) Methyl ester separation
2.2.2. Fatty acid compositions and characterization
The used cooking oil methyl ester (UCOME) was tested for different property study by following international standards. Table 1, represents the Characterization of UCOME in comparison with standard diesel fuel and its International standards and Table 2 represents the Fatty acid compositions of used cooking oil methyl ester (UCOME) by gas chromatography.
Table 1Characterization of UCOME and diesel
S. No | Properties | Units | UCOME | Diesel | ASTM Standard |
1 | Viscosity | cSt | 3.8 | 2.7 | ASTM-D445 |
2 | Calorific value | kJ/kg | 38500 | 38500 | ASTM-D2382 |
3 | Density | Kg/m3 | 873 | 831 | ASTM-D1298 |
4 | Flash point | °C | 140 | 61 | ASTM-D93 |
5 | Pour point | °C | –5 to 7 | –4 | ASTM-D97 |
6 | Cloud point | °C | –3 to 9.5 | –15 to –5 | ASTM-D93 |
7 | Cetane Number | – | 55 | 46 | ASTM-D613 |
Table 2Fatty acid compositions of UCOME
S. No. | Common name | Symbol | Numerical symbol | Content (Wt%) | Status |
1 | Linoleic acid | Li | C18:2 | 50 | Polyunsaturated |
2 | Palmitic acid | P | C16:0 | 36 | Saturated |
3 | Myristic acid | M | C14:0 | 10 | Saturated |
4 | Caprylic | Cy | C8:0 | 2.5 | Saturated |
6 | Oleic acid | O | C18:1 | 0.5 | Mono saturated |
7 | Remaining acids | – | – | 1 | – |
Table 3Elemental compounds of used cooking oil methyl ester (UCOME)
S. No. | Element | Atomic (%) | Wt (%) |
1 | Carbon | 77.94 | 68.40 |
2 | Oxygen | 10.93 | 14.00 |
3 | Nitrogen | 5.93 | 6.00 |
4 | Chromium | 5.19 | 11.84 |
5 | Cobalt | 0.01 | 0.03 |
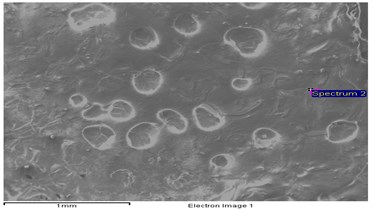
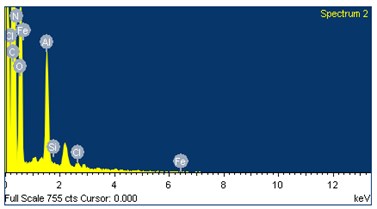
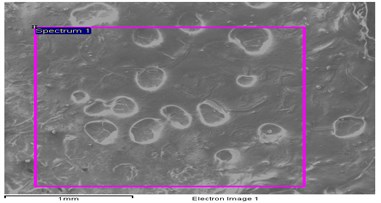
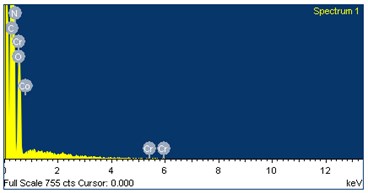
The role of Fatty acid composition plays a vital role in combustion chemistry of the fuels which were used during combustion process. From the literature [17] more amount of unsaturated fats in biodiesel will increase the formation of NOx. Fig. 3 represents the elemental structure and their contribution. From the Table 3 the oxygen content present in the UCOME is around 14 % and nitrogen which is inert in nature which helps in progressive combustion.
Fig. 2Fatty acid composition by gas chromatography
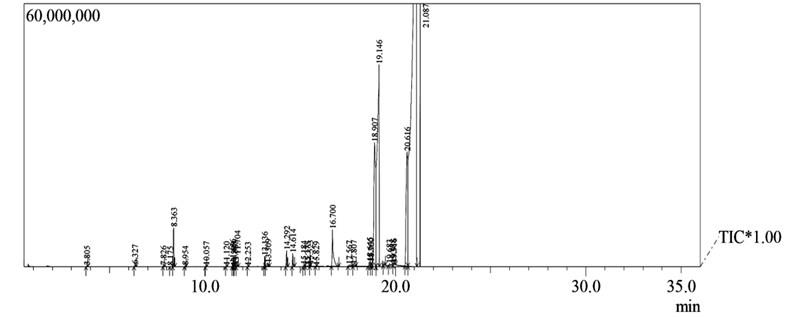
Fig. 3Elemental structures of used cooking oil methyl ester
2.3. Design of experiment
For design and optimization reaction analysis purpose, Design Expert software (version 11.0.05) was used. Central composite design (CCD) a two-level-four-factor (24+2×4+6), including 30 experiments and basic Build Information of design of experiment is shown in the Table 4. Methanol/oil molar ratio (A), Catalyst concentration (B), reaction temperature (C) and reaction time (D) were selected as independent variable factors for the optimization study. The response chosen was the methyl ester yields obtained from transesterification of the used cooking oil. The coded values of the process variables were determined by the following equation Eq. (2):
where – coded value of th variable, – un-coded value of the th test variable, – difference between the proceeding values and – un-coded value of the th test variable at the center point. The factor levels with the corresponding real values and the design matrix are shown in Table 5. The matrix for the four variables was varied at five levels (–, –1, 0, +1 and +). As usual, random experiments were performed to eliminate the system errors.
In this experiment regression analysis was used to estimate the response function, which is a second order polynomial ( yield) Eq. (3):
where is the predicted response, , , and are coefficients estimated from regression and is random error of mathematical model. They represent the linear, quadratic and interactions of the independent variables on the response.
Table 5 shows the independent Experimental range and levels of independent process variables for biodiesel production while Table 6 shows the Experimental set up for 2-level-4-factor response surface design matrix and experimental and predicted values for used co king oil methyl ester from used cooking oil.
Table 4Build information
File version: 11.0.05 (Design – expert 11 trial version software) | |||
Study type | Response surface | Subtype | Randomized |
Design type | Central composite | Runs | 30 |
Design model | Quadratic | Blocks | No Blocks |
Build Time (ms) | 2.00 | – | – |
Table 5Experimental range and levels of independent process variables for biodiesel production
Independent variables | Units | Symbol | Range and level | ||||
– | –1 | 0 | 1 | ||||
Methanol/oil | – | A | 3 | 5 | 7 | 9 | 11 |
Catalyst amount | Wt% | B | 0.5 | 0.6 | 0.7 | 0.8 | 0.9 |
Reaction temperature | °C | C | 17.5 | 30 | 42.5 | 55 | 67.5 |
Reaction time | Min | D | 30 | 45 | 60 | 75 | 90 |
3. Results and discussions
3.1. Evaluation of regression model
The Central composite design (CCD) technique is used to evaluate the correlation between the biodiesel yield and independent process variables. Second order polynomial regression equation fitted between the response yield of UCOME () and the process variables: Methanol/oil molar ratio (), Catalyst amount (), Reaction temperature (), Reaction Time (). From Table 7 the ANOVA results showed that the quadratic model is suitable to analyze the experimental data. The model for percentage of UCOME yield in terms of the coded factors of process variables is given by Eq. (4):
To develop a statistically significant regression model, the significance of the regression coefficients was evaluated based on the p-values. The coefficient terms with p-values more than 0.05 are insignificant [10] and are removed from the regression model. The analysis in Table 7 shows that linear terms of methanol/oil molar ratio, catalyst, temperature, quadratic terms of methanol/oil molar ratio, catalyst, temperature and interactive terms of methanol and catalyst, methanol and temperature and temperature and time that is , , , , , , , and are significant model terms. The model reduces to Eq. (5), after eliminating the insignificant coefficients:
Table 6Experimental set up for 2-level-4-factor response surface design matrix and experimental and predicted values for used co king oil methyl ester from used cooking oil
Std | Run | Factor 1 : Methanol/Oil (–) | Factor 2 : Catalyst amount (Wt%) | Factor 3 : reaction temperature (°C) | Factor 4 : reaction time (Min) | Experimental biodiesel yield (%) | Predicted biodiesel yield (%) | Residual biodiesel yield (% ) |
18 | 1 | 11 | 0.7 | 42.5 | 60 | 84.00 | 83.54 | 0.4583 |
13 | 2 | 5 | 0.6 | 55 | 75 | 86.00 | 82.96 | 3.04 |
22 | 3 | 7 | 0.7 | 67.5 | 60 | 94.00 | 96.88 | –2.88 |
30 | 4 | 7 | 0.7 | 42.5 | 60 | 92.00 | 93.33 | –1.33 |
1 | 5 | 5 | 0.6 | 30 | 45 | 71.00 | 71.63 | –0.6250 |
23 | 6 | 7 | 0.7 | 42.5 | 30 | 95.00 | 94.04 | 0.9583 |
20 | 7 | 7 | 0.9 | 42.5 | 60 | 82.00 | 80.54 | 1.46 |
14 | 8 | 9 | 0.6 | 55 | 75 | 80.00 | 80.83 | –0.8333 |
28 | 9 | 7 | 0.7 | 42.5 | 60 | 95.00 | 93.33 | 1.67 |
3 | 10 | 5 | 0.8 | 30 | 45 | 73.00 | 72.50 | 0.5000 |
7 | 11 | 5 | 0.8 | 55 | 45 | 88.00 | 87.96 | 0.0417 |
16 | 12 | 9 | 0.8 | 55 | 75 | 95.00 | 94.46 | 0.5417 |
10 | 13 | 9 | 0.6 | 30 | 75 | 80.00 | 80.12 | –0.1250 |
25 | 14 | 7 | 0.7 | 42.5 | 60 | 92.00 | 93.33 | –1.33 |
9 | 15 | 5 | 0.6 | 30 | 75 | 74.00 | 74.50 | –0.5000 |
29 | 16 | 7 | 0.7 | 42.5 | 60 | 94.00 | 93.33 | 0.6667 |
15 | 17 | 5 | 0.8 | 55 | 75 | 87.00 | 86.33 | 0.6667 |
6 | 18 | 9 | 0.6 | 55 | 45 | 87.00 | 84.46 | 2.54 |
24 | 19 | 7 | 0.7 | 42.5 | 90 | 95.00 | 95.54 | –0.5417 |
27 | 20 | 7 | 0.7 | 42.5 | 60 | 94.00 | 93.33 | 0.6667 |
21 | 21 | 7 | 0.7 | 17.5 | 60 | 84.00 | 80.71 | 3.29 |
8 | 22 | 9 | 0.8 | 55 | 45 | 96.00 | 95.83 | 0.1667 |
12 | 23 | 9 | 0.8 | 30 | 75 | 94.00 | 93.50 | 0.5000 |
19 | 24 | 7 | 0.5 | 42.5 | 60 | 65.00 | 66.04 | –1.04 |
26 | 25 | 7 | 0.7 | 42.5 | 60 | 93.00 | 93.33 | –0.3333 |
11 | 26 | 5 | 0.8 | 30 | 75 | 75.00 | 77.63 | –2.63 |
5 | 27 | 5 | 0.6 | 55 | 45 | 86.00 | 86.83 | –0.8333 |
2 | 28 | 9 | 0.6 | 30 | 45 | 76.00 | 77.00 | –1.00 |
4 | 29 | 9 | 0.8 | 30 | 45 | 85.00 | 88.12 | –3.12 |
17 | 30 | 3 | 0.7 | 42.5 | 60 | 70.00 | 70.04 | –0.0417 |
3.2. Model adequacy check
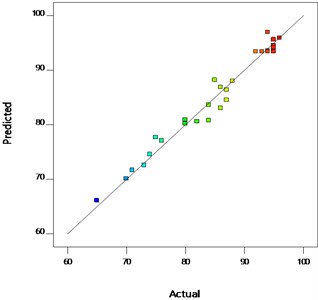
The analysis of variance indicated that the quadratic polynomial model was significant and adequate to represent the actual relationship between yield of used cooking oil methyl ester (UCOME) and the significant model variable factor as depicted by very small p-value of 0.0001. From Table 8 the significance and adequacy of the established model was also elaborated by high value of coefficient of determination () value of 0.9712 and adj. value of 0.9442 for the developed correlation. It implies that the model explains 97.12 % of the total variation in the yield of UCOME which was attributed to the experimental variables.
Table 7Analysis of variance (ANOVA) for the regression model equation, values of regression coefficients and their significant tests and effects
Source | Coefficient estimate | Sum of squares | DF | Mean square | F-value | Standard error | p-value | |
Model | 93.33 | 2281.45 | 14 | 162.96 | 36.08 | 0.8676 | < 0.0001 | Significant |
A-Methanol/ Oil | 3.37 | 273.37 | 1 | 273.37 | 60.53 | 0.4338 | < 0.0001 | |
B-Catalyst amount | 3.62 | 315.37 | 1 | 315.37 | 69.82 | 0.4338 | < 0.0001 | |
C-Reaction temperature | 4.04 | 392.04 | 1 | 392.04 | 86.80 | 0.4338 | < 0.0001 | |
D-Reaction time | 0.3750 | 3.38 | 1 | 3.38 | 0.7472 | 0.4338 | 0.4010 | |
AB | 2.56 | 105.06 | 1 | 105.06 | 23.26 | 0.5313 | 0.0002 | |
AC | –1.94 | 60.06 | 1 | 60.06 | 13.30 | 0.5313 | 0.0024 | |
AD | 0.0625 | 0.0625 | 1 | 0.0625 | 0.0138 | 0.5313 | 0.9079 | |
BC | 0.0625 | 0.0625 | 1 | 0.0625 | 0.0138 | 0.5313 | 0.9079 | |
BD | 0.5625 | 5.06 | 1 | 5.06 | 1.12 | 0.5313 | 0.3065 | |
CD | –1.69 | 45.56 | 1 | 45.56 | 10.09 | 0.5313 | 0.0063 | |
A2 | –4.14 | 469.07 | 1 | 469.07 | 103.85 | 0.4058 | < 0.0001 | |
B2 | –5.01 | 688.57 | 1 | 688.57 | 152.45 | 0.4058 | < 0.0001 | |
C2 | –1.14 | 35.36 | 1 | 35.36 | 7.83 | 0.4058 | 0.0135 | |
D2 | 0.3646 | 3.65 | 1 | 3.65 | 0.8072 | 0.4058 | 0.3831 | |
Residual | 67.75 | 15 | 4.52 | |||||
Lack of fit | 60.42 | 10 | 6.04 | 4.12 | 0.0658 | Not significant | ||
Pure error | 7.33 | 5 | 1.47 | |||||
Cor total | 2349.20 | 29 |
The line of perfect fit with points corresponding to zero error between the predicted values and actual values was shown in Fig. 4. It indicate that the model show a relatively good description of the experimental data on the UCOME yield. It could be seen from the graph that all the points are very close to the line of perfect fit. Hence, there is adequate correlation between the predicted values and the experimental values of the independent variable which further elaborated the adequacy of the model. It has been proved from the Table 7 the “Lack of Fit F-value” of 4.12 implies the Lack of Fit is not relatively significant to the pure error. Non-significant lack of fit is appreciated for the model to fit.
Table 8Fit statistics representation
S. No | Standards | Values |
1 | Std. Dev. | 2.13 |
2 | Mean | 85.40 |
3 | C.V. % | 2.49 |
4 | 0.9712 | |
5 | Adjusted | 0.9442 |
6 | Predicted | 0.8474 |
7 | Adeq precision | 20.5176 |
3.3. Response surface analysis
From the Fig. 5 represent the 3D plot for the interaction effect between oil to methanol ratio and catalyst amount for UCOME yield. The reaction temperature and reaction time were fixed at 60 minutes and 42.5 °C respectively. The 3D response surface shows the maximum yield of UCOME is 95.20 % was obtained at oil to methanol ratio of 1:8.12 and catalyst amount of 0.75 Wt%. The probable reasons for the methyl ester yield may be due to the theoretically stoichiometric molar ratio of alcohol to oil is 3:1, which can produce 3 moles of methyl esters and one mole of glycerine. Increase of molar ratio above stoichiometric ratio, has a positive effect on the methyl ester conversion up to 6:1, because the more concentration of alcohol accelerates the reaction and helps in the improvement of methyl ester yield. If the molar ratio is above 8.2:1, it causes a slight decrease of yield. Because the presence of excess alcohol may cause the reaction reversible and combines methyl esters to form glycerin. The excess alcohol also creates a separation problem and requires more number of water washes. When it comes to catalyst concentration the yield was decreased at low catalyst concentration due to slow and incomplete reaction. If the catalyst concentration increases above the required (0.8 Wt%) then also the methyl ester yield is decreased. This will lead to formation of soap.
Fig. 4Polt of the predicted versus the actual values of UCOME
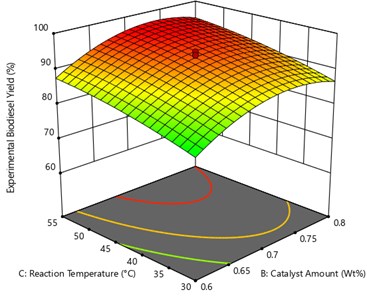
From the Fig. 6 oil to methanol ratio and reaction time were kept constant at 1:7 and 60 min. The effects of catalyst amount and reaction temperature were analyzed on the UCOME yield. It was observed that the methyl ester yield starts increasing as the reaction temperature increased from 45 °C to 55°C. And it was also observed that there is a gradual decrease in the methyl ester yield when the reaction temperatures exceed 55 °C. This may be due to the fact that the boiling temperature of the methanol is greater than 55 °C [18]. In this stage the maximum yield of UCOME was obtained is 96.57 % at catalyst amount of 0.73 Wt% and reaction temperature of 54.65 °C.
Fig. 5Surface plot of the interaction effect of Methanol/oil and catalyst amount
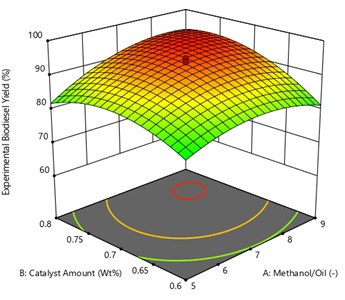
Fig. 6Surface plot of the interaction effect of Catalyst amount and reaction temperature
From the Fig. 7, the oil to methanol ratio and catalyst amount were kept constant at 1:7 and 0.7 Wt% respectively and the plot was drawn between reaction temperatures and reaction time. The graph shows that the maximum yield of UCOME was obtained is 97.67 % were obtained at reaction temperature of 54.87 °C and reaction time of 45.30 minutes.
From the Fig. 8 the oil to methanol ratio and reaction temperature was kept constant at 1:7 and 42.5 °C respectively and the plot was drawn between catalyst amount and reaction time. As the reaction time increase from 30 minutes, the methyl ester yield starts to increase. The desired time interval helps in conversion methyl ester yield, for instance if the reaction time exceeds the desired time there may be chance of reversible process that may occur, if there is any excess menthol present in it. From the figure the maximum yield of UCOME obtained is of 95.17 % in 74.59 minutes at a catalyst amount of 0.73 Wt% was achieved.
Fig. 7Surface plot of the interaction effect of reaction temperature and reaction time
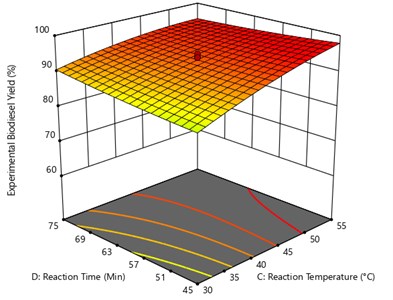
Fig. 8Surface plot of the interaction effect of catalyst amount and reaction time
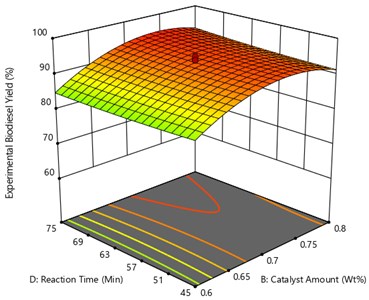
Fig. 9 represents the interaction oil to methanol ratio and temperature. In this the catalyst amount and reaction time are kept constant at 0.7 Wt% and 60 minutes to observe the methyl ester yield. It can be seen that at lower oil to methanol ratio the yield is low because of the poor phase separation and the yield increases with an increase in reaction temperature up to 60 °C and then decreases for higher reaction temperatures. From the figure the maximum yield of UCOME obtained is of 96.29 % and were obtained at oil to methanol ratio of 1:7.4 and at the reaction temperature of 54.47 °C.
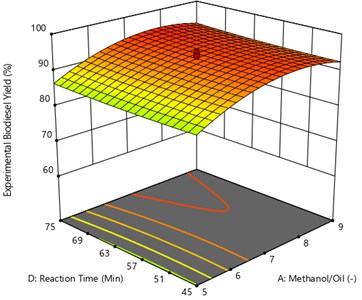
Fig. 10 represents that the correlation between process variable of oil to methanol ratio reaction time with respective to response variable of methyl ester yield (UCOME). The other parameters like reaction temperature and Catalyst amount are kept constant. The maximum used cooking oil yield of 94.77 % was achieved at oil to methanol ratio of 1:7.76 and reaction time of 74.07 minutes.
Fig. 9Surface plot of the interaction effect of methanol/oil and reaction temperature
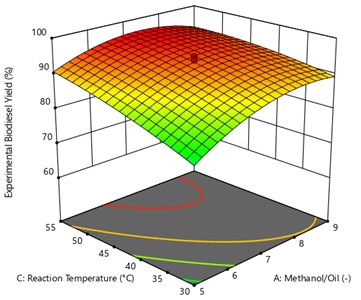
Fig. 10Surface plot of the interaction effect of methanol/oil and reaction time
3.4. Process optimization technique
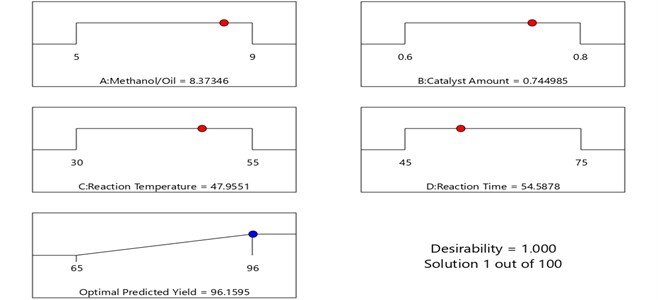
The regression polynomial Eq. (5) obtained from RSM model was used to determine the maximum response factor at the optimal level of each operating parameters. The optimum values of operating parameters for used cooking oil methyl ester (UCOME) are represented in the Fig. 11. The optimum variable values are: oil to methanol ratio (1:8.37), catalyst concentration (0.74 Wt%), reaction temperature (47.95 °C) and reaction time (54.58 min). The predicted response value at these optimum values was 96.15 %. Experimentations were conducted based on the optimum values and achieved the yield of 96 %. This shows that the yield of used cooking oil methyl ester is very near to the optimum value with an error of 0.15 % which can be accepted.
Fig. 11The optimal levels of the operating parameters
4. Conclusions
Based on the analysis of the experimental results, the following conclusions are drawn:
1) Used cooking oil which is abundantly available, is the best choice for biodiesel production. This can reduce the overall production cost of the biodiesel.
2) From the fatty acid compositions analysis the used cooking oil methyl ester possess 48.5 % saturated, 0.5 % mono unsaturated and 50 % poly unsaturated fatty acid compositions. Increasing in unsaturated fatty acids may lead to formation of NOx emissions. There is 14 % of Oxygen content in the UCOME which can help in complete combustion of the fuel.
3) Processing variable like oil to methanol ratio, catalyst concentration, reaction temperature and reaction time were optimized by using response surface methodology and analysis of variance (ANOVA) techniques.
4) The optimum values of the variables were: oil to methanol ratio (1:8.37), catalyst concentration (0.74 Wt%), reaction temperature (47.95 °C) and reaction time (54.58 min) at 250 rpm. The predicted response value at these optimum values was 96.15 %.
5) Experimentations were conducted based on the optimum values and achieve the yield of 96 %. This shows that the yield of used cooking oil methyl ester is very near to the optimum value with an error of 0.15 % which may be acceptable. And the experimental value of methyl ester yield 96 % was well within the estimated optimal value of the model.
6) This demonstrated that the response surface methodology with appropriate experimental design can be more effectively applied to the optimization of the process parameters in the used cooking oil methyl ester production.
References
-
Abraham M. Bio-fuels as future fuels for automotive vehicles – OEM’s viewpoint of requirements and view point issues. 5th International Bio-Fuels Conference, New Delhi, 2008.
-
Wan Omar W. N. N., Nor Aishah S. A. Optimization of heterogeneous biodiesel production from waste cooking palm oil via response surface methodology. Biomass and Bioenergy, Vol. 35, Issue 3, 2011, p. 1329-1338.
-
Tan K. T., Lee K. T., Mohamed A. R. Potential of waste palm cooking oil for catalyst-free biodiesel production. Energy, Vol. 35, Issue 3, 2011, p. 2085-2088.
-
Zhang Y., Dube M. A., Mclean D. D., Kates M. Biodiesel production from waste cooking oil: 2. Economic assessment and sensitivity analysis. Bio Resource Technology, Vol. 90, Issue 3, 2003, p. 229-240.
-
Aditya Kolakoti, Rao Appa B. V. Effect of fatty acid composition on the performance and emission characteristics of an IDI supercharged engine using neat palm biodiesel and coconut biodiesel as an additive. Biofuels, 2016, https://doi.org/10.1080/17597269.2017.1332293.
-
Aditya Kolakoti, Rao Appa B. V. Performance and emission analysis of a naturally aspirated and supercharged IDI diesel engine using palm methyl ester. Biofuels, 2017, https://doi.org/10.1080/17597269.2017.1374770.
-
Santosh Babji P., Appa Rao B. V., Aditya Kolakoti Performance and emission analysis of supercharged IDI diesel engine fueled with waste cooking. Oil Biodiesel International Journal of Engineering Science and Computing, Vol. 7, Issue 10, 2017, p. 15126-15129.
-
Ganapathi Vedulla, Rao Appa B. V., Aditya Kolakoti Biodiesel production from beef tallow – a procedural change. International Journal of Advance Engineering and Research Development, Vol. 4, Issue 8, 2017, p. 398-405.
-
Aditya Kolakoti, Rao B. V. A. A Comprehensive review of biodiesel application in IDI engines with property improving additives. I-Manager’s Journal on Mechanical Engineering, Vol. 5, Issue 4, 2015, p. 35-45.
-
Chinyere Ezekannagha B., Callistus Ude N., Okechukwu Onukwuli D. Optimization of the methanolysis of lard oil in the production of biodiesel with response surface methodology. Egyptian Journal of Petroleum, Vol. 26, Issue 4, 2017, p. 1001-1011.
-
Onukwuli Dominic Okechukwu, Emembolu Lovet Nwanneka, Ude Callistus Nonso, Aliozo Sandra Ogechukwu, Menkiti Mathew Chukwudi Optimization of biodiesel production from refined cotton seed oil and its characterization. Egyptian Journal of Petroleum, Vol. 26, Issue 1, 2017, p. 103-110.
-
Giovanilton Silva F., Camargo Fernando L., Ferreira Andrea L. O. Application of response surface methodology for optimization of biodiesel production by transesterification of soybean oil with ethanol. Fuel Processing Technology, Vol. 92, Issue 3, 2011, p. 407-413.
-
Zahira Yaakob, Masitamohammada, Mohammadalherbawi, Zahangiralam, Kamaruzaman Sopian Overview of the production of biodiesel from waste cooking oil. Renewable and Sustainable Energy Reviews, Vol. 18, 2013, p. 184-193.
-
Man Kee Lam, Keat Teong Lee, Abdul Rahman Mohamed Homogeneous, heterogeneous and enzymatic catalysis for transesterification of high free fatty acid oil (waste cooking oil) to biodiesel: A review. Biotechnology Advances, Vol. 28, Issue 4, 2010, p. 500-518.
-
Refaat A. A. Different techniques for the production of biodiesel from waste vegetable oil. International Journal of Environmental Science and Technology, Vol. 7, Issue 1, 2010, p. 183-213.
-
Musa Idris Atadashi The effects of alcohol to oil molar ratios and the type of alcohol on biodiesel production using transesterification process. Egyptian Journal of Petroleum, Vol. 25, Issue 1, 2016, p. 21-31.
-
Sukumar Puhan, Saravanan N., Nagarajan G., Vedaraman N. Effect of biodiesel unsaturated fatty acid on combustion characteristics of a DI compression ignition engine. Biomass and Bioenergy, Vol. 34, Issue 8, 2010, p. 1079-1088.
-
Santosh Babji P., Appa Rao B. V., Aditya Kolakoti Optimization of process variables for the production of methyl esters from waste cooking oil. International Journal of Science and Research, Vol. 6, Issue 10, 2017, p. 1201-1204.
About this article

