Abstract
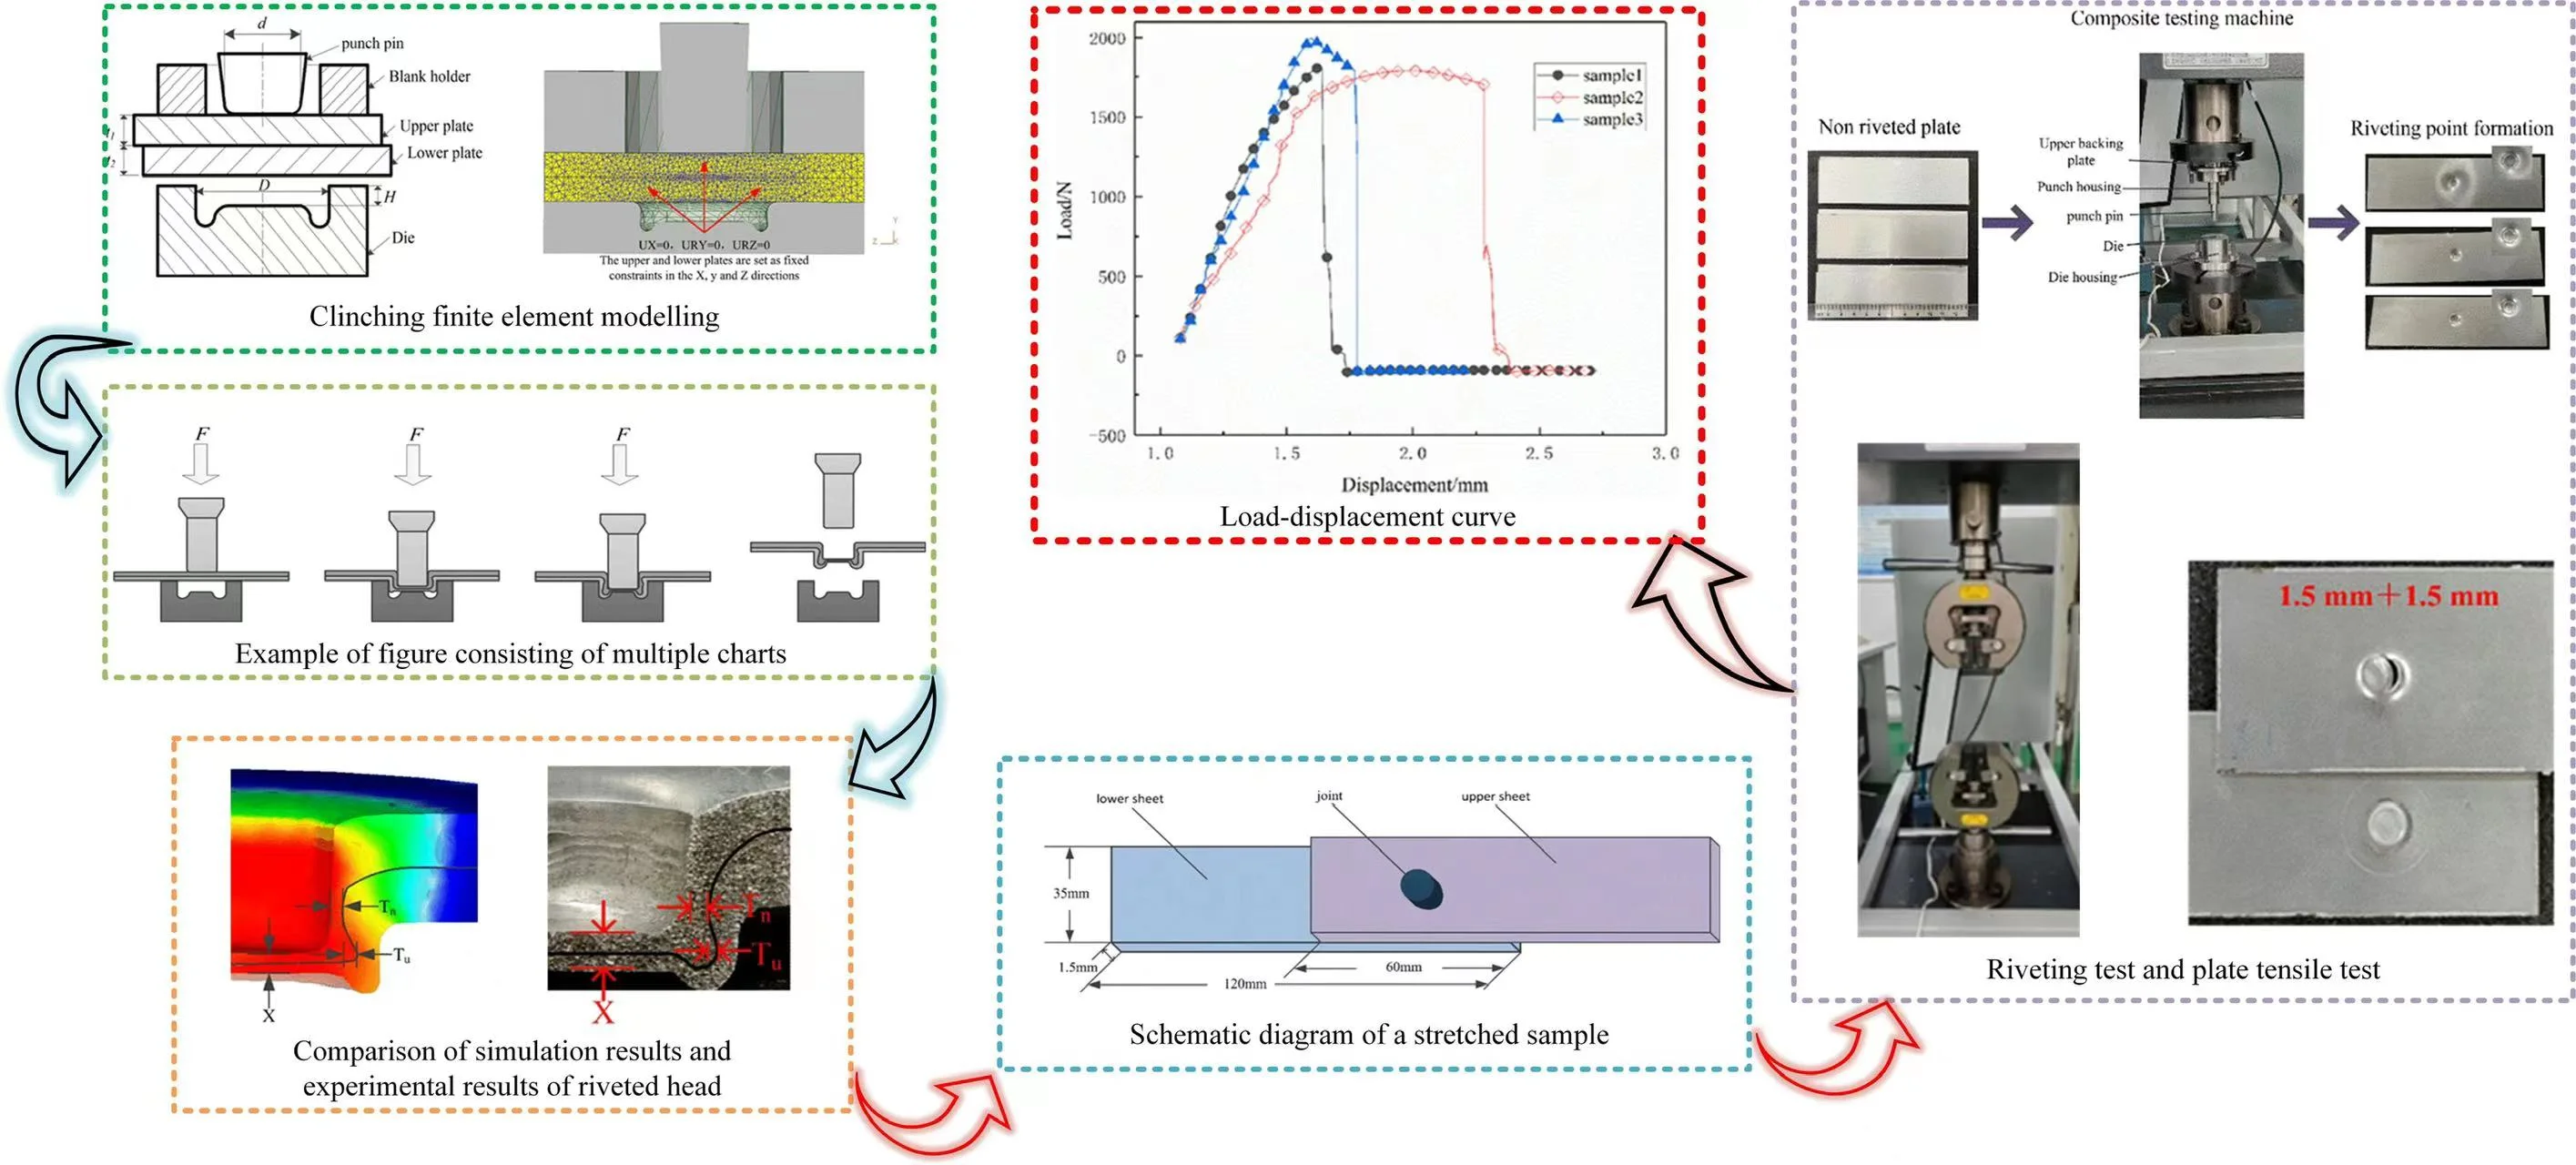
In this paper, the effects of the interaction between punch diameter, die depth and punch speed on the quality of riveted joints are investigated using the BBD response surface test method. The results show that the mold depth has the greatest influence on the key dimensional parameters of riveted joints, followed by the punching speed, and then the punch diameter, while the punch diameter and the mold depth are the two factors with the most obvious interaction. The optimum riveted joint process parameters determined are punch diameter of 5.24 mm, die depth of 1.44 mm, and stamping speed of 5.00 mm/s. The corresponding relative errors predicted by numerical simulation and response surface optimization objective are 5.96 % for neck thickness, 3.29 % for interlocking value, and 1.37 % for bottom thickness; and the relative errors predicted by experimental results and optimization objective are 13.42 % for neck thickness, 13.42 % for interlocking value, and 1.37 % for bottom thickness. 13.42 %, interlock value is 4.23 %, and bottom thickness is 2.23 %, the model accuracy is high, and the optimization method of response surface test can effectively improve the quality of riveted joints. Through numerical simulation, the metal flow law and stress distribution during the riveting and forming process of aluminum alloy plate were analyzed, and the strength test of riveted joint was carried out, and the maximum destructive shear load of the joint was 1.8 KN, and the strength of the joint was improved, which verified the validity of the response surface optimization method.
Highlights
- A new optimisation experimental method, BBD Response Surface Method, is used for riveting quality optimisation design tests to establish a prediction model between punch diameter, recessed die depth and stamping speed.
- Considering the influence of each factor on the values of neck thickness, interlocking value and bottom thickness, the optimum combination of process parameters is determined as: punch diameter of 5.24 mm, concave die depth of 1.44 mm, and stamping speed of 5 mm/s.
- The mould depth has the greatest influence on the key dimensional parameters of the joint, followed by the stamping speed and then the punch diameter. The experimental results show that the model has high accuracy and the BBD response surface method is very suitable for riveted joint quality optimisation.
- The calculated joint strength is compared with the experimentally obtained joint strength. The results show that the response surface optimisation method improves the strength of the joint, which verifies that the riveting parameters obtained by the response surface method are real and reliable, and the maximum destructive shear load of the joint is 1.8KN, which meets the riveting requirements.
1. Introduction
The automobile industry is an important pillar of the economy, and body lightweight is one of the important measures for all kinds of automobile manufacturers to achieve energy saving and environmental protection, the key challenge is to reduce the cost of manufacturing structures using these new materials [1]. Lightweighting is one of the key strategies to address these challenges. Maximizing weight reduction (i.e., minimizing vehicle weight) requires systems engineering design optimization and iteration, combining material properties and manufacturing processes to meet product requirements at the lowest possible quality or cost [2]. However, due to the characteristics of the aluminum alloy material itself, it can only be processed by cold processing, and the rivetless riveting technology has been widely used in automotive production design due to its advantages of high connection strength, low surface damage, high reliability, and the ability to achieve multi-layer lightweight plate connection. Therefore, it is of great significance to carry out research on the optimization of riveting process parameters of lightweight plates to solve the connection problems between lightweight plates, expand the application range of lightweight plates and promote the process of automotive lightweighting.
As a new plate joining technology, in recent years, scholars at home and abroad have conducted many studies around the clinching joining process and riveting quality. Zhao Huan [3] et al. combined riveting tests with finite element (FE) modelling to systematically investigate the effects of top plate thickness (), bottom plate thickness () and rivet length () on the joint formation mechanism. Also, the study also highlights the fact that the FE model is an excellent tool for analyzing the formation of riveted joints. Zhang Yue [4] et al. used three different types of aluminum alloy sheets: 7075, 6061 and 5754. these sheets were joined together by self-pierce riveting technique. The geometrical parameters, microhardness, quasi-static mechanical properties, and fatigue properties of the three aluminum alloy joints were studied and compared. Xu Fan [5] et al. analyzed the factors affecting the strength of riveted joints and obtained the influence law of the number of joints, different tensile speeds and different combinations on the strength of the joints; Shen Yongfei [6] et al. through the tensile shear experiments on joints of different riveted specimens, combined with the mechanical properties of the unriveted riveted joints, came to the conclusion that the interfacial breakage and the joints tensile shear strength depended on the thickness of the cracking of the neck of the upper plate; Benzegaou Ali [7] et al. obtained the geometrical mechanical parameters affecting the quality of riveted joints during riveting and performed tensile tests to obtain the mechanical strength of riveted joints. Liu Yahui [8] et al. investigated the metal deformation behavior during self-pierce riveting of thin aluminum alloy plates and the mechanical behavior of self-pierce riveting joint head in destructive testing, with a view to establishing a general strength model for self-pierce riveting joint head and realizing the data processing and strength prediction of riveted joints. Liu Yang [9] et al. proposed a deep learning-based prediction method for riveting process, obtaining the original images of the model dataset according to the simulation results, and using image segmentation technology to classify the damage patterns. The adopted deep learning model can accurately predict the deformation state and damage evolution of riveted materials in different connection stages.
The above study started from the factors affecting the quality of riveted joints, and obtained the key process parameters affecting the quality of riveted joints; by comparing different riveting forms, different joint damage forms were obtained, which provide a basis for riveted joints in different applications; through the destructive test of riveted shaped specimens, the mechanical strength of riveted joints was obtained, and at the same time, it was concluded that the quality of riveted joints was affected differently by different process parameters. At the same time, it is concluded that different process parameters have different effects on the quality of riveted joints. The influence of different process parameters on the quality of riveted joints varies. The above studies have mentioned how to optimize the riveting process parameters to improve the quality of riveted joints, to reduce the workload in the actual processing and reduce the cost. Therefore, this paper proposes a method to optimize the riveting process parameters on this basis, taking the rivetless joining process of 6061 aluminum alloy with a single-layer plate thickness of 1.5 mm as the object of study, numerical simulation of the rivetless joining forming process is carried out by using the DEFORM-3D finite element software, which reproduces the flow law of the metal and the distribution of the stress-strain in the riveting process, and the riveted process parameters of necking without riveting are selected based on the response surface test scheme. According to the riveting response surface test scheme to select the process parameters, the neck thickness value, the interlocking value and the bottom thickness value as the evaluation index, to determine the 6061 aluminum alloy mold riveting die depth, stamping speed and punch diameter, to derive what kind of factors on the riveting quality has a greater impact on riveted joints, riveted joints for the riveting process to provide a certain reference significance.
2. Finite element modeling
2.1. Clinching forming mechanism
Instead of using rivets, the rivetless joining process uses a special convex-concave die to stamp the joining plate and then uses the plastic deformation capacity of the plate to embed the plate for joining [10]. Fig. 1 illustrates the molding mechanism. Firstly, in the positioning stage, two layers of plates are stacked between the punch and the die. The punch, the die and the center of the joint are placed coaxially. As the forming process proceeds, the plates are compressed under pressure and further stretched at the neck, and the thickness of the plates at this position gradually decreases.
Fig. 1Example of figure consisting of multiple charts
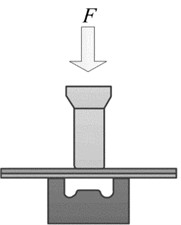
a) Positioning
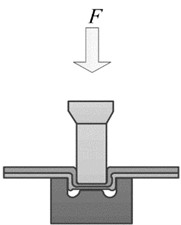
b) Early stage of forming
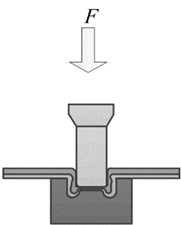
c) Late forming
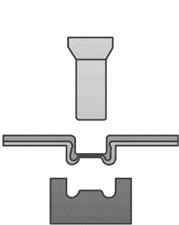
d) Demolding
2.2. Geometric modeling of clinching
The axisymmetric geometric model of riveted joint created by UG software is shown in Fig. 2(a). The punch, crimping ring and concave mould are set as rigid bodies, and the upper and lower plates are set as plastic bodies. The downward speed of the punch is set to 5 mm/s, the friction coefficient between the plates is set to 0.2, and the mesh is refined using the local mesh refinement technique. The upper and lower plates are made of 6061 aluminum alloy with a thickness of 1.5 mm and their main mechanical properties are shown in Table 1 [11]. To improve the accuracy of the finite element simulation, the Lagrange increment is used as the simulation form, and the conjugate gradient method is chosen to directly simulate the boundary conditions of the upper and lower plates in the , , and directions, while keeping the position fixed. The finite element model of the riveting mould is shown in Fig. 2(b).
Fig. 2Clinching finite element modelling: d – punch diameter; D – die diameter; H – die depth; t1, t2 – upper and lower plates
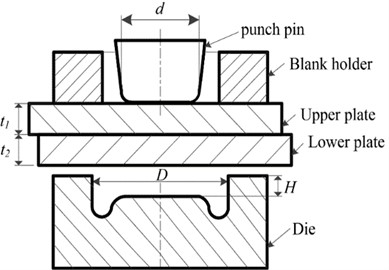
a) Left chart
b) Right chart
Table 1Mechanical properties of AL6061
Parameters | Elastic modulus / GPa | Yield strength / MPa | Tensile strength / MPa | Elongation / % |
Value | 70 | 168.1 | 207 | 11.0 |
2.3. Geometric modeling of clinching
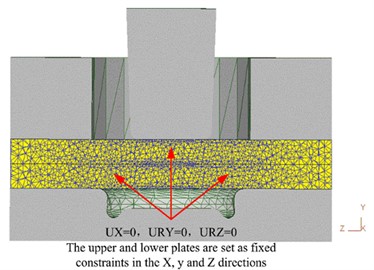
The quality of the riveted joint is determined by measuring and comparing the interlock value , neck thickness value and base thickness value of the geometric parameters of the center section of the rivet head as shown in Fig. 3. According to literature [12], the interlocking value reflects the reliability of the riveted joint. the higher the , the more reliable the riveted joint is, whereas the lower the , the more easily the connected plates can be separated. When the neck thickness value is lower, the joint is more brittle. In addition, the bottom thickness value determines the tensile strength of the joint. Obviously, , and are closely related.
Fig. 3Three evaluation parameters
3. Optimization of the process parameters for clinching using response surface testing
3.1. Experimental design by response surface methodology
Response surface methodology, as an optimization method combining experimental design and mathematical modelling, has the advantages of high precision and accuracy in deriving regression equations and good predictive performance. When the number of levels of test factors is large, the response surface method can effectively reduce the number of tests and can respond to the interaction between the influencing factors [13]. In the rivetless riveting and forming process, the main variables affecting the quality of riveting and forming are the punch diameter, the depth of the concave die and the stamping speed. To test the model fit, parameter significance and misfit, as well as to analyze the variance and make model judgements, a Box-Behnken Design (BBD) response surface experimental design and analysis was used to develop the predictive model. The model was optimally solved to obtain the best test scenario.
3.2. Response surface method modeling
The parameters affecting the quality of riveted joints, i.e., neck thickness value, interlock value and bottom thickness value are used as the center point of the optimization experimental design and the combination of these three parameters is used as the optimization objective.
To establish the response surface approximation model, the relationship between the design variables and the analysis objectives must be clarified and the appropriate functional relationship must be selected. The relationship between the system response and the design variable generally satisfies Eq. (1):
where 𝑓(𝑥) is the approximation of the unknown function, ; 𝑛 means there are 𝑛 groups of independent variables; and 𝜉 is the total error.
The polynomial representation is expressed by Eq. (2):
where, is the coefficient of the basis function, is the basis function, is the number of dimensions, and is the number of basis functions.
The Box-Behnken Combined Design method in Design-Export software was used to determine the design of the flat-bottomed rivetless joint test. A level value was selected as the response surface test design level for the upper and lower regions, centered on the optimum value point of each test single factor. The level values and design factors are shown in Table 2.
Table 2Design factors and levels
Factors | Variables | Level | ||
–1 | 0 | +1 | ||
Punch diameter / mm | 5.0 | 5.2 | 5.4 | |
Concave die depth / mm | 1.2 | 1.4 | 1.6 | |
Stamping speed / (mm/s) | 2 | 5 | 8 | |
As shown in Table 3, a table of test protocols is created after each factor and its level values are entered sequentially in the Design-Expert system. The simulation is then performed according to the test protocol. The simulation results are measured for each set of factor combinations and the simulation results are filled in sequentially into the protocol combinations. Due to certain numerical fluctuations in the simulation process, the results can be slightly different even for the same set of simulation combinations. Therefore, repeat the test for several groups in the protocol.
Table 3Response surface test design and results
Number | ||||||
1 | 5.0 | 1.2 | 5.0 | 0.494 | 0.310 | 0.510 |
2 | 5.4 | 1.2 | 5.0 | 0.501 | 0.168 | 0.950 |
3 | 5.0 | 1.6 | 5.0 | 0.376 | 0.256 | 0.483 |
4 | 5.4 | 1.6 | 5.0 | 0.385 | 0.296 | 0.562 |
5 | 5.0 | 1.4 | 2.0 | 0.391 | 0.288 | 0.550 |
6 | 5.4 | 1.4 | 2.0 | 0.421 | 0.330 | 0.591 |
7 | 5.0 | 1.4 | 8.0 | 0.448 | 0.294 | 0.562 |
8 | 5.4 | 1.4 | 8.0 | 0.414 | 0.330 | 0.607 |
9 | 5.2 | 1.2 | 2.0 | 0.465 | 0.246 | 0.466 |
10 | 5.2 | 1.6 | 2.0 | 0.350 | 0.233 | 0.610 |
11 | 5.2 | 1.2 | 8.0 | 0.492 | 0.272 | 0.464 |
12 | 5.2 | 1.6 | 8.0 | 0.388 | 0.380 | 0.501 |
13 | 5.2 | 1.4 | 5.0 | 0.457 | .0435 | 0.561 |
14 | 5.2 | 1.4 | 5.0 | 0.467 | 0.403 | 0.573 |
15 | 5.2 | 1.4 | 5.0 | 0.462 | 0.415 | 0.568 |
16 | 5.2 | 1.4 | 5.0 | 0.452 | 0.426 | 0.576 |
17 | 5.2 | 1.4 | 5.0 | 0.449 | 0.420 | 0.567 |
Significance tests were performed on the linear function, second order model and third order model. To select the appropriate model, the data from the significance test, the test of misfit term and the correlation test were compared for the three models. The second-order model was recommended for neck thickness values, and the third-order model was recommended for interlock and bottom thickness values. The test results were analyzed using Design-Expert software.
Table 4Variance analysis table of regression equation-neck thickness value (mm)
Type | ss | DF | MS | F | Pr > F | |
Model | 0.03253 | 9 | 0.003614 | 79.19857 | < 0.0001 | ** |
0.00002 | 1 | 0.000018 | 0.394428 | 0.5499 | ||
0.02565 | 1 | 0.025651 | 562.0844 | < 0.0001 | ** | |
0.00165 | 1 | 0.001653 | 36.22437 | 0.0005 | * | |
0 | 1 | 0.000001 | 0.021913 | 0.8865 | ||
0.00102 | 1 | 0.001024 | 22.43857 | 0.0021 | * | |
0.00003 | 1 | 0.00003 | 0.662858 | 0.4424 | ||
0.00059 | 1 | 0.000589 | 12.90131 | 0.0088 | * | |
0.00018 | 1 | 0.000182 | 3.988624 | 0.0860 | ||
0.00309 | 1 | 0.003087 | 67.63453 | < 0.0001 | ** | |
Residuals | 0.00032 | 7 | 0.000045 | |||
Loss of proposed items | 0.00011 | 3 | 0.000035 | 0.664478 | 0.6162 | Insignificant |
Pure Error | 0.00021 | 4 | 0.000053 |
Table 5Variance analysis table of regression equation-interlocking value (mm)
Type | ss | DF | MS | F | Pr > F | |
Model | 0.09830 | 12 | 0.0081916 | 57.004803 | 0.0007 | ** |
0.00152 | 1 | 0.001521 | 10.584551 | 0.0313 | * | |
0.00226 | 1 | 0.0022563 | 15.701113 | 0.0166 | * | |
0.00748 | 1 | 0.0074823 | 52.068546 | 0.0020 | * | |
0.00828 | 1 | 0.008281 | 57.627001 | 0.0016 | * | |
0 | 1 | 0.000009 | 0.0626305 | 0.8147 | * | |
0.00366 | 1 | 0.0036603 | 25.474168 | 0.0072 | * | |
0.01907 | 1 | 0.0190565 | 132.61328 | 0.0003 | * | |
0.03803 | 1 | 0.03802 | 264.579 | < 0.0001 | ** | |
0.00744 | 1 | 0.0074362 | 51.748178 | 0.0020 | * | |
0 | 1 | 0.00005 | 0.3836117 | 0.5692 | ||
0.00349 | 1 | 0.0034861 | 24.259743 | 0.0079 | * | |
0.00405 | 1 | 0.00405 | 28.183716 | 0.0061 | ||
Residuals | ||||||
Loss of proposed items | Insignificant | |||||
Pure Error | 0.00058 | 4 | 0.0001437 |
Table 6Variance analysis table of regression equation-bottom thickness (mm)
Type | ss | DF | MS | F | Pr > F | |
Model | 0.18632 | 12 | 0.0015527 | 463.4773 | < 0.0001 | ** |
0.00185 | 1 | 0.001849 | 55.19403 | 0.0018 | * | |
0.00819 | 1 | 0.00819 | 244.4851 | < 0.0001 | * | |
0.00308 | 1 | 0.00308 | 91.94776 | 0.0007 | * | |
0.03258 | 1 | 0.03258 | 972.5448 | < 0.0001 | * | |
0 | 1 | 0.000004 | 0.119403 | 0.7471 | * | |
0.00286 | 1 | 0.002862 | 85.4403 | 0.0008 | * | |
0.01632 | 1 | 0.016316 | 487.0463 | < 0.0001 | * | |
0.00011 | 1 | 0.000105 | 3.142184 | 0.1510 | ** | |
0.01264 | 1 | 0.012164 | 363.1186 | < 0.0001 | * | |
0.04440 | 1 | 0.044402 | 1325.433 | < 0.0001 | ||
0.00242 | 1 | 0.002415 | 72.09328 | 0.0011 | * | |
0.02344 | 1 | 0.023436 | 699.5858 | < 0.0001 | ||
Residuals | ||||||
Loss of proposed items | Insignificant | |||||
Pure Error | 0.00013 | 4 | 0.0000335 |
3.3. Fitting and evaluation of response surface models
Based on the analysis of the simulation results in Tables 4-6, the response fitting equations for the neck thickness values, interlocking values and bottom thickness values were derived as shown in Eqs. (3-5):
where, , and represent punch diameter, die depth and stamping speed respectively. , and represent neck thickness value, interlocking value, and bottom thickness value respectively.
Table 7Statistical analysis of regression equation error of neck thickness
Statistical items | Value | Statistical items | Value |
Std.Dev. | 0.006755 | R-Squared | 0.990275 |
Mean | 0.436 | Adj R-Squared | 0.977771 |
C.V. % | 1.549409 | Pred R-Squared | 0.938105 |
PRESS | 0.002033 | Adeq Precision | 28.29958 |
Table 8Statistical analysis of error of regression equation for interlock value
Statistical items | Value | Statistical items | Value |
Std.Dev. | 0.011987 | R-Squared | 0.994187 |
Mean | 0.323647 | Adj R-Squared | 0.976746 |
C.V. % | 3.703878 | Pred R-Squared | N/A |
PRESS | N/A | Adeq Precision | 24.02039 |
Table 9Statistical analysis of regression equation error of bottom thickness
Statistical items | Value | Statistical items | Value |
Std.Dev. | 0.005788 | R-Squared | 0.999281 |
Mean | 0.570647 | Adj R-Squared | 0.997125 |
C.V. % | 1.014273 | Pred R-Squared | N/A |
PRESS | N/A | Adeq Precision | 96.02109 |
The above fitted regression equations were further analyzed by error statistics and the results are presented in Tables 7-9. If the value of the fitted term Pr > F of ANOVA is less than 0.05, the model is significant; if the value of the fitted term Pr > F is greater than 0.05, the model is not significant, i.e., the model is well fitted throughout the regression region of the study. The regression model adequately describes the process when the value of Adj R-squared is close to the value of Pred R-squared (RAdj2-RPred2 < 0.2) and both values are high. However, if both values are low, the process is not adequately explained, and some other important factors need to be considered. When the CV is less than 10 per cent, it indicates that the reliability and accuracy of the test is high. Precision (Adeq Precision) is the effective signal to noise ratio and if it is greater than 1, the accuracy is considered reasonable [14]. Tables 4-6 shows that the fitted regression equations comply with the above test principles, indicating their adaptability (Note: SS-Sum of Squares of Variance, DF-Degrees of Freedom, MS-Mean Square, Pr > F-No Significant Effect probability, ** highly significant, * significant).
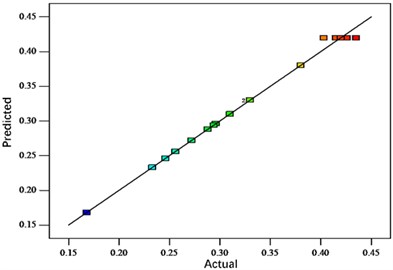
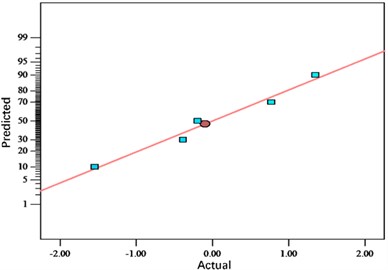
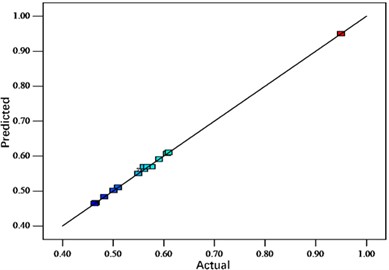
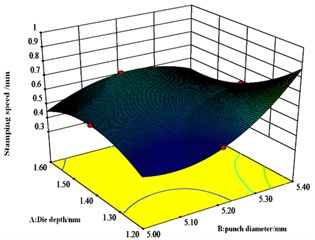
The analysis shows that the distributions of the residuals are all close to the center straight line, indicating a good adaptation of the response surface fitting model. Figs. 4-6 show the normal probability distribution of the residuals of neck thickness values, interlocking values and bottom thickness values, the distribution of the residuals with respect to the predicted values and the distribution of the predicted values with respect to the actual values, respectively. Fig. 10 shows the response surface plots of each interaction factor for neck thickness value, interlock value and bottom thickness value. The effect of any two factors on the response surface interaction can be visualized from the above figure to determine the optimum factor level for the indicator.
Fig. 4Residual error distribution of neck thickness
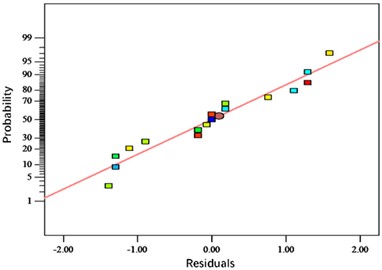
a) Normal probability distribution
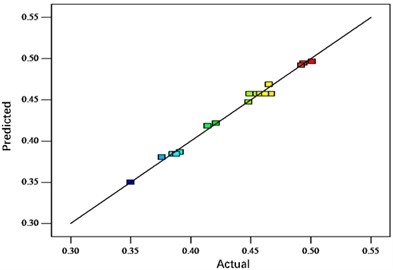
b) Predicted vs. actual value distribution
Fig. 5Distribution diagram of interlock value residuals
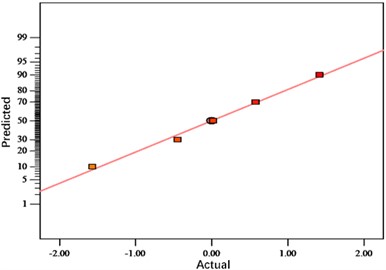
a) Normal probability distribution
b) Predicted vs. actual value distribution
Fig. 6Residual distribution of bottom thickness value
a) Normal probability distribution
b) Predicted vs. actual value distribution
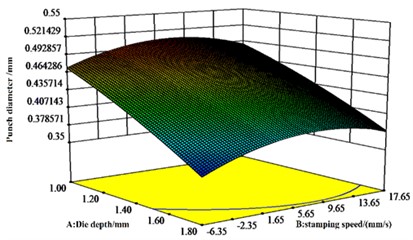
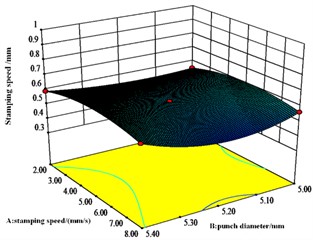
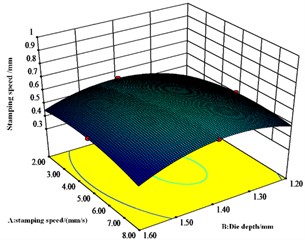
The results in Fig. 7 agree with the results of the ANOVA of the regression equation for the values of neck thickness. From Fig. 7(b), there is a significant interaction effect of punch diameter and stamping speed. The maximum effect of mold depth on neck thickness value is followed by stamping speed, while the minimum effect of punch diameter is observed.
Fig. 7Effect of A, B and C on neck thickness values
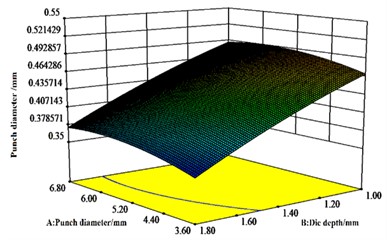
a) response surface
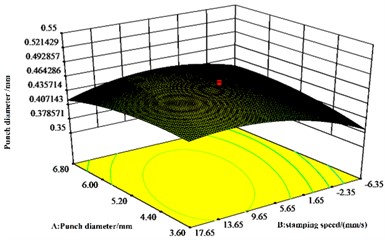
b) response surface
b) response surface
Fig. 8Effect of A, B and C on interlocking values
a) response surface
b) response surface
b) response surface
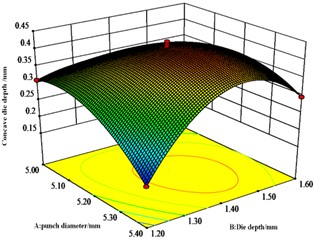
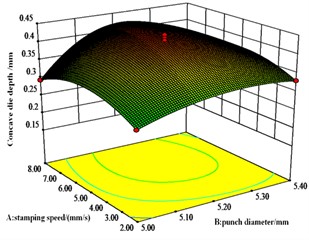
Fig. 8 shows that die depth and punch diameter have significant effect on the interlocking values. The most significant interaction effect is between punch diameter and die depth, followed by the interaction effect between die depth and stamping speed. There is also an interaction effect between die depth and press speed.
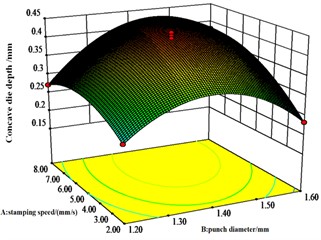
From Fig. 9, the interaction between die depth and stamping speed is significant and is an important variable affecting the value of bottom thickness, but the interaction between punch diameter and both die depth and stamping speed respectively is not significant.
Response surface interaction analysis shows that the concave die depth, punch speed and punch diameter are all critical dimensional parameters that affect the joint. Analysis of the results of the response surface methodology shows that the ideal dimensions of the die are a punch diameter of 5.24 mm, a die depth of 1.44 mm, a punching speed of 5.00 mm/s. For the values of neck thickness, interlocking and bottom thickness, the most obvious of the pairwise interactions of neck thickness, interlocking and bottom thickness values is the pairwise interaction of punch diameter and concave die depth.
Fig. 9Effect of A, B and C on bottom thickness values
a) response surface
b) response surface
b) response surface
4. Optimization of the process parameters for clinching using response surface testing
4.1. Target optimization and experimental validation
The response surface methodology was used to determine the following stamping parameters: punch diameter of 5.24 mm, die depth of 1.44 mm, stamping speed of 5.00 mm/s In addition, the model was optimized using response surface software and the optimized parameters are shown in Table 10.
Table 10Optimal parameter combinations and indicator projections
Optimal combination of parameters | Optimization of target prediction values (Unit: mm) | ||||
Punch diameter / mm | Depth of concave die / mm | Stamping speed / (mm/s) | Neck thickness value | Interlock value | Bottom thickness value |
5.24 | 1.44 | 5.00 | 0.447 | 0.426 | 0.582 |
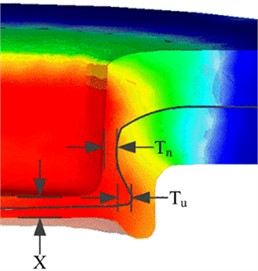
Numerical simulations were performed in DEFORM-3D with the friction coefficient set to 0.2. As shown in Fig. 13, the predicted thickness of the response surface is 0.420 mm at the neck, 0.412 mm at the interlock, and 0.574 mm at the bottom. This corresponds to the corresponding relative errors of 5.96 %, 3.29 % and 1.37 %, respectively, as predicted by the response surface optimization objective. According to literature [14], the interlock value indicates the reliability of the riveted joint. The higher the Tu value, the more reliable the riveted joint is and vice versa. The lower the value, the more prone the riveted joint is to fracture.
Fig. 10Joint process parameters
4.2. Experimental verification of optimization results
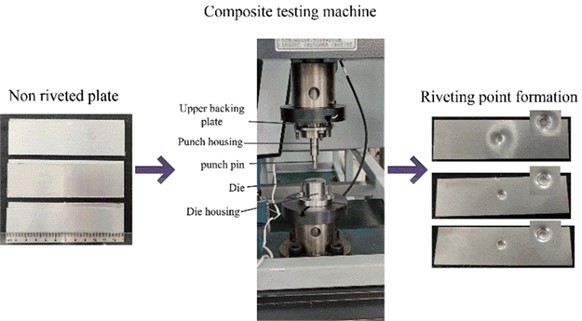
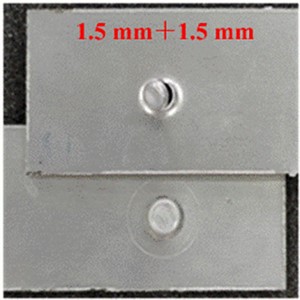
Practical experiments were carried out based on the desired test parameters and the obtained experimental values were compared with the model predictions to further test the validity of the response surface method. The riveting experiments were carried out on a WDW-100 microcomputer-controlled electro-hydraulic servo composite testing machine by stacking two plates on a concave mold. The punch position was adjusted to hold the plates in place, the preload force was entered to compress the plates, and the punch speed was entered in the software to move the punch downwards. The connected plates were then pressed into the recessed die until they filled the die with the preload force. The test procedure is shown in Fig. 14. After the riveting was completed, a wire cutter was used to cut the test piece along the center of the test piece to obtain an axial section of the riveted joint. The evaluation metrics were measured using a video meter and the results are shown in Fig. 11 and Table 11.
Fig. 11Rivet joint experiment
The relative errors of the objective predictions for the response surface optimization were 13.42 % for the neck thickness, 4.23 % for the interlock value and 2.23 % for the bottom thickness.
The inverted shape produced by the plates riveted using the optimized process parameters is more complete as shown in Fig. 12. According to literature [15], the range of bottom thickness value is 20 % of the plate thickness. The optimum bottom thickness value is 0.569 mm. the smaller the value of the bottom thickness, the smaller the possibility of separation of the upper and lower plates and the higher the reliability of the connection, provided that the quality of the connection is guaranteed. By comparing the simulation error, the actual test error, and the target prediction error for response surface optimization, the neck thickness value has the largest error. This is since the neck of the aluminum alloy plate is subjected to the greatest tensile force during the clamping process and the internal metal grain movement in this area is also the most intense. These results show that the target optimization prediction model provided by response surface analysis is a reasonable, fast, and efficient method.
Fig. 12Experimentally obtained joint shape
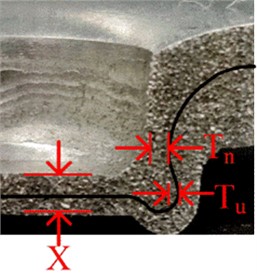
Table 11Test measurement results
Combination of mold parameters | Measured value (Unit: mm) | ||||
Punch diameter / mm | Depth of concave die / mm | Stamping speed / (mm/s) | Neck thickness value | Interlock value | Bottom thickness value |
5.24 | 1.44 | 5.00 | 0.387 | 0.408 | 0.569 |
4.3. Riveted joint strength and failure mode prediction
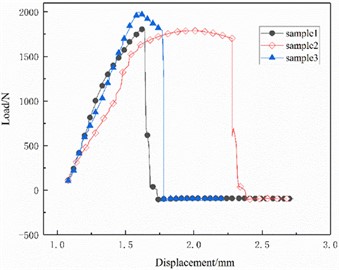
After the riveting is completed, the plates are lapped as shown in Fig. 13, and the riveting is implemented in the center region of the lap, and then the specimens are subjected to tensile shear experiments on the tensile equipment shown in Fig. 14(a), with a tensile shear speed of 5 mm/s. According to the joint failure mode prediction method given in reference [16], the prediction equations for the tensile shear strength of the joints are derived in this paper as follows:
where is the maximum shear force that the joint can withstand; is the proportionality coefficient, aluminum alloy is usually taken as 0.7; is the rotational compensation coefficient of the joint in the case of pulling and shearing, and it is 1.55 for 1.5 mm thick aluminum alloy plate; is the ultimate strength of the upper plate.
Under the optimal parameters obtained according to Eq. (6), the tensile shear strength of the joint is 1.739 KN. Fig. 14(b) shows the joint damage form of shear fracture of the plate, and the experimental load-displacement curves of the plate in the process of shear are shown in Fig. 15, which indicates that the experimental value of the joint tensile shear strength is 1.8 KN and is higher than that of the theoretically calculated value, with an error of only 3.4 %. The rivetless riveted joint tensile shear experiments show that the response surface method optimized joint strength to meet the requirements and get a small range of enhancement.
Fig. 13Schematic diagram of a stretched sample
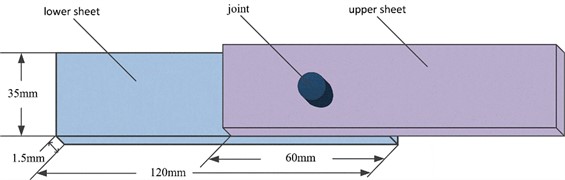
Fig. 14Tensile test
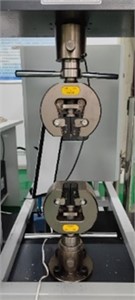
a) Tensile testing equipment
b) Riveting point neck break failure
Fig. 15Load-displacement curve
5. Conclusions
1) A new optimization experiment method, BBD Response Surface Method, is used to carry out the riveting quality optimization design test, to establish a prediction model between the punch diameter, concave die depth and stamping speed, and to consider the influence of each factor on the neck thickness value, interlocking value and bottom thickness value, the optimal combination of the process parameters is determined as follows: the punch diameter of 5.24 mm, the depth of the die is 1.44 mm, the stamping speed of 5 mm/s. The obtained neck thickness of the riveted head under this process parameter is 0.387 mm, the interlocking value is 0.408 mm, and the bottom thickness value is 0.569 mm. Under this process parameters, the thickness of the riveted head neck is 0.387 mm, the interlock value is 0.408 mm, and the bottom thickness value is 0.569 mm.
2) ANOVA is performed on the response surface model to determine the influence of each factor on the optimization objective as follows: punch diameter and die depth are the two factors with the most obvious interaction. The mold depth has the most significant effect on the key dimensional parameters of the joint, followed by the stamping speed and then the punch diameter. The experimental results show that the model has high accuracy, and the BBD response surface method is very suitable for riveted joint quality optimization.
3) By comparing the calculated joint strength with the experimentally obtained joint strength. The results show that the response surface optimization method improves the strength of the joint, which verifies that the riveting parameters obtained by the response surface method are real and reliable, and the maximum destructive shear load of the joint is 1.8 KN, which meets the riveting requirements.
References
-
A. Taub, E. de Moor, A. Luo, D. K. Matlock, J. G. Speer, and U. Vaidya, “Materials for automotive lightweighting,” Annual Review of Materials Research, Vol. 49, No. 1, pp. 327–359, Jul. 2019, https://doi.org/10.1146/annurev-matsci-070218-010134
-
A. I. Taub and A. A. Luo, “Advanced lightweight materials and manufacturing processes for automotive applications,” MRS Bulletin, Vol. 40, No. 12, pp. 1045–1054, Dec. 2015, https://doi.org/10.1557/mrs.2015.268
-
H. Zhao, L. Han, Y. Liu, and X. Liu, “Analysis of joint formation mechanisms for self-piercing riveting (SPR) process with varying joining parameters,” Journal of Manufacturing Processes, Vol. 73, pp. 668–685, Jan. 2022, https://doi.org/10.1016/j.jmapro.2021.11.038
-
Y. Zhang, B. Lei, T. Wang, L. Zhu, Y. Lu, and J. Jiang, “Fatigue failure mechanism and estimation of aluminum alloy self-piercing riveting at different load levels,” Engineering Fracture Mechanics, Vol. 291, p. 109583, Oct. 2023, https://doi.org/10.1016/j.engfracmech.2023.109583
-
F. Xu, S. D. Zhao, M. Z. Zhu, and W. Zhu, “Factors affecting the strength of rivetless joints of lightweight sheet metal for automobiles,” Light Alloy Fabrication Technology, Vol. 47, No. 2, pp. 56–65, 2019, https://doi.org/10.13979/j.1007-7235.2019.02.012
-
Y. F. Shen, H. Li, Z. M. Xiong, M. Lou, and Y. B. Li, “Mechanical properties of lightweight sheet riveting without rivets and joint fracture mechanism,” Machine Design and Research, Vol. 34, No. 1, pp. 99–102, 2018, https://doi.org/10.13952/j.cnki.jofmdr.2018.0023
-
B. Ali and B. Benabderrahmane, “Finite element simulation of the hybrid clinch joining,” The International Journal of Advanced Manufacturing Technology, Vol. 89, No. 1-4, pp. 439–449, Mar. 2017, https://doi.org/10.1007/s00170-016-9094-2
-
Y. Liu, Z. Zhu, H. Yu, and J. Wang, “Strength modeling of Al-alloy sheet self-piercing riveting considering different failure modes,” The International Journal of Advanced Manufacturing Technology, Vol. 127, No. 5-6, pp. 2487–2503, Jul. 2023, https://doi.org/10.1007/s00170-023-11635-3
-
Y. Liu, Q. Wu, P. Wang, and W. Zhuang, “Forming process prediction of a self-piercing riveted joint in carbon fibre reinforced composites and aluminium alloy based on deep learning,” Journal of Manufacturing Processes, Vol. 106, pp. 453–464, Nov. 2023, https://doi.org/10.1016/j.jmapro.2023.10.015
-
M. Opprecht, G. Roux, J.-P. Garandet, and C. Flament, “A study of the mechanical properties of Al6061-Zr1,2 alloy processed by laser beam melting,” Journal of Materials Engineering and Performance, Vol. 32, No. 4, pp. 1840–1855, Feb. 2023, https://doi.org/10.1007/s11665-022-07218-0
-
C. Chen et al., “Study on the flat-reshaping technology with no rivet for joining,” Journal of Mechanical Engineering, Vol. 53, No. 18, pp. 42–48, 2017, https://doi.org/10.3901/jme.2017.18.042
-
X. He et al., “Investigations of strength and energy absorption of clinched joints,” Computational Materials Science, Vol. 94, No. 11, pp. 58–65, Nov. 2014, https://doi.org/10.1016/j.commatsci.2014.01.056
-
P. Zhao, Q. Wu, Y.-L. Yang, and Z. Chen, “Process optimization of the hot stamping of AZ31 magnesium alloy sheets based on response surface methodology,” Materials, Vol. 16, No. 5, p. 1867, Feb. 2023, https://doi.org/10.3390/ma16051867
-
C.-J. Lee, J.-Y. Kim, S.-K. Lee, D.-C. Ko, and B.-M. Kim, “Design of mechanical clinching tools for joining of aluminium alloy sheets,” Materials and Design, Vol. 31, No. 4, pp. 1854–1861, Apr. 2010, https://doi.org/10.1016/j.matdes.2009.10.064
-
Z. Z. Xu et al., “Numerical simulation analysis and experimental study of no rivet connection,” Die and Mold Industry, Vol. 39, No. 12, pp. 35–40, 2013, https://doi.org/10.16787/j.cnki.1001-2168.dmi.2013.12.007
-
Z. H. Yu, D. S. Tan, and M. Lou, “Strength and failure mode prediction of mechanical clinching,” Machine Design and Research, Vol. 35, No. 4, pp. 91–95, 2019, https://doi.org/10.13952/j.cnki.jofmdr.2019.0236
About this article

This research was funded by the Shaanxi Provincial Natural Science Basic Research Project (No.: 2023-JC-YB-452).
The datasets generated during and/or analyzed during the current study are available from the corresponding author on reasonable request.
Shi Liu was mainly responsible for the final data collection and analysis, as well as the planning of the research content and thesis writing. The revision of the research results and thesis is mainly responsible by Yongqiang Zhao. The creation of the finite element model is mainly responsible by Dahai Wang. Numerical simulation and analysis were carried out by Miao Yuan Mei and Tao Huang. Data collation and analysis were mainly responsible by them.
The authors declare that they have no conflict of interest.
