Abstract
Due to its high precision, productivity, and surface quality, computer numerical control turning (CNC) is a desirable processing tool in the traditional processing area. CNC machining procedures have a huge number of process parameters, making it challenging to find the best combination of parameters for increased accuracy. In this research work, the Taguchi method and ANOVA were used to study the effects of CNC machining parameters in EN8 steel turning: Surface roughness (Ra) value of component affected due to cutting speed, depth of cut and feed rate. Three-level three-parameter experimental design, using Minitab 17 software using L9 orthogonal array, using coated carbide insert cutting tools, using signal-to-noise ratio (S/N) to study the performance characteristics of EN8 steel turning. In this study, statistical approaches such as the signal-to-noise ratio (S/N ratio) and analysis of variance (ANOVA) were used to explore the effects of cutting speed, depth of cut, and feed rate on surface roughness. Nature-inspired algorithms play a vital role in solving real life. In this study, the bat algorithm can be used to predict the optimal surface value (Ra) and process parameters. Verify the results by conducting confirmation experiments. The current research shows that the feed rate is the most important factor affecting the surface roughness (Ra) of EN8 steel turning.
Highlights
- Surface roughness prediction of EN8 steel from Turning process
- Linear regression from design of experiments and ANOVA performing
- Applying Bat algorithm to the real life problem and getting optimum result
1. Introduction
Modern precision manufacturing requires extremely high dimensional accuracy and surface finish. Even if it is not a skilled operator, if not impossible, it is difficult to achieve such a performance manually. When possible, it will take more time due to frequent dimensional measurements to prevent overcutting. Therefore, it is obvious that in modern manufacturing, CNC control will replace manual lathe machines. The development of computer numerical control (CNC) machines has also made it possible to automate the machining process, and can flexibly handle the production of small and medium batches of parts. This led to the development of computer-based automatic machine tool controls, also known as numerical control (NC) systems. To optimise the surface roughness (RA) in CNC machining of EN8 steel, the proposed new methodology combines two methodologies. EN8 steel was chosen for the study because it has a wide range of applications, making it important to improve its quality. The experiments and analysis designed by Taguchi are used to analyze the process parameters that affect Ra [1]. Mathematical relationships have been developed to correlate input process parameters and surface roughness values. Now a days modern trending technique of optimization are being used on to real life problems for getting the output in optimal way. In this research paper also a modern and effective optimization method which is a bio-inspired method is used to optimize the parameters. The parameters in this research which are responsible for surface roughness and which are considered are Machine speed, Feed rate and depth of cut.
Nowadays, nature-inspired and biological-inspired algorithms are more effective in solving real-life problems. An optimization problem is proposed and optimized using the bat optimization algorithm. Nowadays, there are many evolutionary and Bat inspired optimization algorithms available, such as Grey Wolf Optimizer (GWO) [2], Particle Swarm Optimization (PSO) [3], Ant Colony Optimization (ACO) [4], Grasshopper Optimization Algorithm (GOA) [5], Firefly Algorithm (FA) [6], Salp Swarm Algorithm (SSA) [7], Cuckoo Search Algorithm (CS) [8], Genetic Algorithm (GA) [9], etc. Socially inspired algorithms such as Cohort Intelligence (CI) [10] and ideology algorithm [11] are also algorithms that help find the best parameters for the problem. Bat-inspired algorithms [12] have their own set of benefits and functions, which are explored in the following sections.
1.1. Major parameters which Influence the process
The most important performance indicators in CNC machining are the surface finish value and material removal rate. They depend on machining parameters such as cutting speed, feed rate, depth of cut, tool workpiece material, tool geometry and coolant conditions. These parameters have a great influence on the turning input parameters, and these parameters will greatly affect the response variables. In CNC turning, various response variables such as surface roughness, material removal rate, chipping method, etc. participate [13, 14].
1.2. Surface roughness ()
Surface roughness is usually used in short as roughness only, which is a factor of surface texture. It is quantified by the deviation of the normal vector direction of the real surface from its ideal form. If these deviations are large, the surface will be rough; otherwise, the surface will become rough. The surface is smooth if they are little. Roughness is commonly defined in surface metrology as the high-frequency and short-wave components of the measured surface [15, 16]. In practice, however, knowing the amplitude and frequency at the same time is frequently required to verify that the surface is acceptable for a given function. Roughness is a key factor in influencing how actual objects behave [17, 18].
2. Methodology
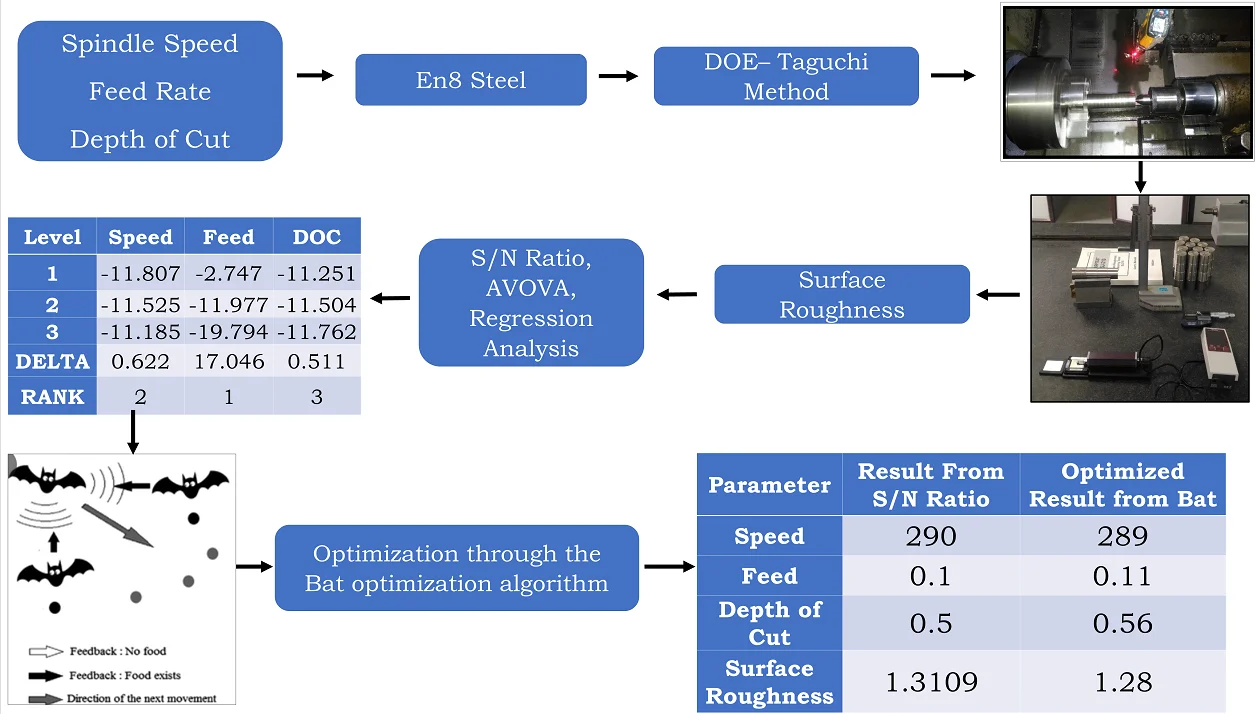
Experiments were performed using the Taguchi experimental design, which involved 3 input parameters and a performance index as an improved surface roughness (RA Analyze the impact of input factors on RA and identify other important parameters. Regression analysis was used to create the mathematical model. A bat heuristic optimization algorithm is used to solve an issue. The process parameters were chosen after a thorough review of the literature, and upper and lower limits were established. Compare the optimization results with Taguchi's signal-to-noise ratio analysis. The whole methodology and process for the research work is plotted in the graphical form which is presented in Fig. 1.
2.1. Selection of Work piece material and their properties
EN8 carbon steel is a common medium carbon and medium tensile steel, and its strength is higher than that of low carbon steel and medium hardened carbon steel. EN8 carbon steel can be easily machined under any circumstances. EN8 steel is usually used in an untreated state [19, 20]. However, EN8 steel can be further surface hardened through an induction process to produce components with higher wear resistance [21, 22]. The EN8 steel material in the form of heat treatment has a good uniform metallurgical structure and consistent machining performance. The purpose of this study is to use the response surface method to develop a theoretical model of surface roughness on EN8 steel using main cutting parameters (such as cutting speed, feed rate and depth of cut). EN8 steel has a good homogenous metallurgical structure, consistent machining performance, and good tensile strength after heat treatment [23, 24]. EN8 is commonly utilized in a wide range of traditional engineering applications. Tables 1 and 2 indicate the chemical composition and physical parameters of the specified EN8 steel.
Fig. 1Methodology layout of the research
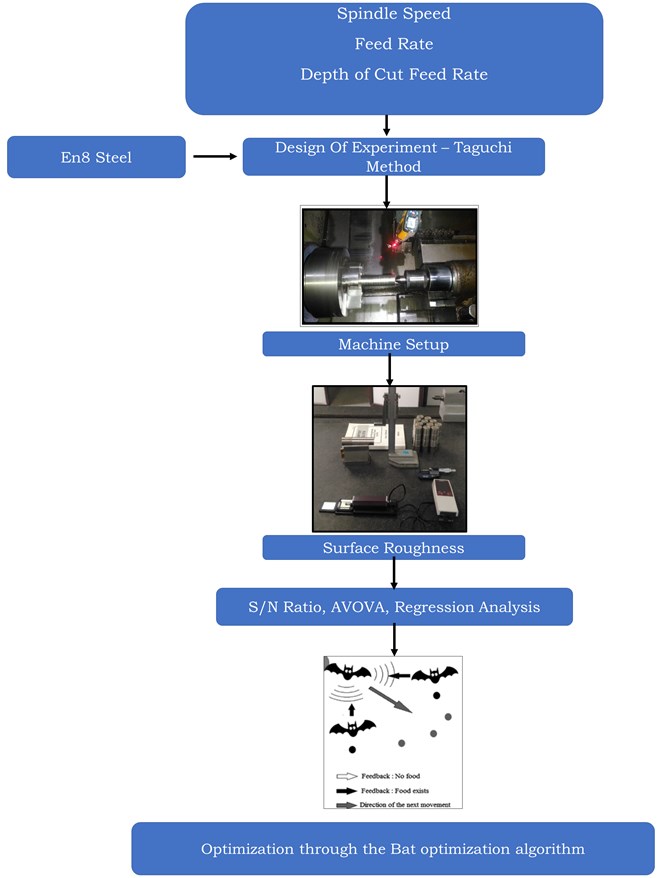
Table 1Properties of EN8
Parameter | Specific value |
Hardness | 201.0-255.0 BHN |
Proof Stress (0.2 %) | 450.0 N/mm2 |
Elongation | 16.0 % |
Yield stress | 465.0 N/mm2 |
Density | 7.870 gm/cm3 |
Maximum stress | 850.0 N/mm2 |
Table 2Chemical properties of EN8 steel
Elements | Standard value | Observed value |
C%-CARBON | 0.35-0.45 | 0.40 |
SI%-SILICON | 0.050-0.35 | 0.20 |
MN%-MANGANESE | 0.60-1.00 | 0.74 |
P%-PHOSPHORUS | 0.060 max. | 0.023 |
S%-SULPHUR | 0.060 max. | 0.020 |
2.2. Selection of cutting tool materials
Cutting tools must have three properties in order to generate high-quality products: hardness, toughness, and wear resistance. Choose the carbide-coated tool to cut the selected work piece [25, 26]. Table 3 gives the specifications of the selected tools, and Table 4 mentions the insert specifications.
Table 3Cutting tool specification TNMG Insert
Tool type | Manufacturer | Designation | Code | Geometry | Grade |
Carbide tool | KORLOY | TNMG | 160404 | VF | CC115 |
Table 4Insert specifications
Insert type | Code | Length of the insert in mm | Thickness of insert in mm | Radius of insert |
TNMG is a triangular insert | 160404 | 16 | 04 | 0.4 |
2.3. Machine tool and Surface Roughness Ra Measurement Apparatus used
On the CNC machine tool, the turning operation is performed on the specified work piece EN8 steel bar. The specifications of the CNC machine tool are similar to the Fanuc bi-Mate TD CNC system, the number of workstations is 8, the chuck size is 169 mm, and the spindle speed range is 45-4500 rpm. Roughness is usually a good predictor of the performance of mechanical parts, because surface irregularities may form cracks or corroded nucleation sites. Roughness is a measure of surface texture. It is quantified by the vertical deviation of the actual surface from its ideal form. In the trials, a digital surface tester was utilized to measure surface roughness Ra and a digital weighing machine was utilized to measure metal removal rate. SURFTEST, S. J. 210, sr.no: 178-561-02A, MITUTOYO MECH, an experimental device for the surface roughness tester of JAPAN.
2.4. Design of experiments
Designers can use Design of Experiments (DOE) technology to determine the individual influences and interactions of various aspects that can affect the outcome of any design. DOE also gives a comprehensive understanding of the interactions between design parts, assisting in the transformation of any conventional design into a trustworthy one. In the design stage, the following introduces the selection of workpiece materials, machine tools, inserts, process and performance parameters, and the program selected for optimization.
2.5. Turning parameters selected with different levels
In turning operations performed in CNC Lathe, 3 process parameters are used: cutting speed , which is spindle speed (in rpm), feed “” (in mm/rev), and depth of cut DOC (in mm). It is crucial for reaching the desired degree of output quality. The different parameter levels are listed in Table 5.
Table 5Levels of turning process parameters
Process parameters | 1 | 2 | 3 |
Spindle speed (m/min) | 200 | 250 | 290 |
Depth of cut (mm) | 0.5 | 0.8 | 1.2 |
Feed (mm/rev) | 0.1 | 0.2 | 0.3 |
As a result, these cutting process parameters and their associated levels for machining EN8 steel are chosen based on preliminary testing, literature reviews, and catalogues provided by cutting tool manufacturers.
2.6. Orthogonal array and experimental factors
The Taguchi technique begins with the selection of a suitable orthogonal array. Table 6 displays the L9 (3 3) orthogonal array, which is a standardized experimental design based on Taguchi. The basic design uses up to three control factors, of which three levels are used for cutting speed , cutting depth and feed . A total of 9 experimental runs must be performed, using the control factors shown in Table 6 Horizontal combination. Table 6 shows the parameters that were chosen, as well as the codes and values that were utilized in the Table 6 Research on Taguchi parameter design. The dependent variable is called the response variable.
Table 6Control factor and levels
Experiment No. | Speed | Feed rate | Depth of cut |
1 | 200.0 | 0.10 | 0.50 |
2 | 200.0 | 0.20 | 0.80 |
3 | 200.0 | 0.30 | 1.20 |
4 | 250.0 | 0.10 | 0.50 |
5 | 250.0 | 0.20 | 0.80 |
6 | 250.0 | 0.30 | 1.20 |
7 | 290.0 | 0.10 | 0.50 |
8 | 290.0 | 0.20 | 0.80 |
9 | 290.0 | 0.30 | 1.20 |
The purpose of the experiment is to examine how turning factors affect EN8 steel surface roughness and material removal rate. Taguchi's orthogonal array was utilized to create the experiment, lowering the number of trials. The experiment is carried out using the three factors of the L9 orthogonal array’s three levels.
3. Bat inspired algorithm
3.1. Echolocation technique of Bats.
“Bats are fascinating animals. They are the only winged mammals with advanced features of echolocation. It is estimated that there are about 1,000 different species, accounting for about one-fifth of all mammalian species. They vary in size, from small bumblebee bats (about 1.5-2 g) to giant bats with a wingspan of about 2 m and weighing about 1 kg. The length of the forearm of a bat is usually about 2.2-11 cm. Most bats use echolocation to some extent. Among all species, microbat is a famous example. Micro bats widely use echolocation, while giant bats do not. Most bats are carnivorous” [12].
Bats use sonar called echolocation to detect prey, avoid obstacles and find gaps in the dark. These bats emit very large pulses and hear echoes from surrounding objects. These pulses have different characteristics and may depend on their type and their hunting strategy. Most bats use short-frequency modulation signals to scan approximately octaves, while other bats usually use constant-frequency signals for echolocation.
“Their signal bandwidth varies from species to species, and is usually increased by using more harmonics. Each pulse lasts only a few thousandths of a second (up to about 8-10 milliseconds). However, the frequency is constant, usually in the range of 25-150 kHz. The typical frequency range of most bat species is 25-100 kHz, but some species can emit higher frequencies up to 150 kHz. Each ultrasonic pulse usually lasts 5 to 20 milliseconds, and microbats emit about 10 to 20 such sound pulses per second” [12]. When looking for prey, when they are flying near the prey, the pulse emission speed may be as high as 200 pulses per second. Such a short sound represents the powerful ability of bats to process signals. According to research, the integration time of bat ears is typically around 300-400 milliseconds. Because sound travels at 340 m/s in air, the wavelength l of an ultrasonic wave bursting at a constant frequency equals /. This is the standard 2-14 mm zoom range. The frequency range is 25 to 150 kHz. This wavelength is the same as the size of the prey. Surprisingly, the transmitted pulse can be as high as 110 dB. Fortunately, they are in the ultrasound zone. The loudness varies from the maximum loudness when looking for prey to the quiet base when looking for prey. The range of motion of such short pulses is usually a few meters, depending on the actual frequency. Mini bats can avoid small obstacles, such as small human hair. Studies have shown that bats use the time delay of echo emission and detection, the time difference between ears, and changes in echo loudness to create a three-dimensional scene around them. “It can detect the distance and direction of the target, the type of prey, and even the moving speed of prey such as small insects. Indeed, research shows that bats seem to be able to distinguish targets by Doppler effect changes caused by the flapping rate of target insects. Obviously, some bats have good eyesight, and most bats have a very sensitive sense of smell. In fact, they use a combination of all senses to effectively detect prey and maximize smooth navigation” [12]. However, we are only interested in echolocation and related behaviors here. This echolocation behavior of bats can be formulated to associate it with the objective function to be optimized, so that new optimization algorithms can be formulated. The rest of this white paper explains BA’s core concept before delving into its implementation and comparison [12].
3.2. Bat algorithm
By idealizing certain echolocation characteristics of bats, you can develop algorithms or BA inspired by different bats. For simplicity, please use the following approximation or idealization rules. “All bats use echolocation to sense distance and magically “recognize” the difference between prey/prey and the background barrier. Bats fly randomly at position at speed , fixed frequency , and change wavelength and loudness to find prey. The wavelength (or frequency) of the emitted pulse can be automatically adjusted according to the proximity of the target, and the pulse emission rate r can be adjusted within the range of [0 1] [12]. Loudness may be measured in a variety of ways, but we’ll suppose that it ranges from a big (positive) to the lowest constant number.” [12].
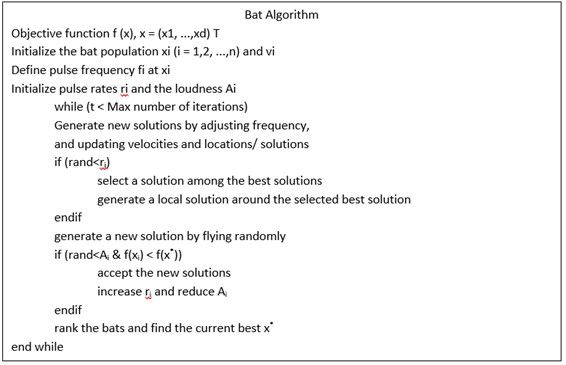
Another obvious simplification method is not to use ray tracing to estimate the time delay and 3D terrain. For computational geometry applications, this may be a good feature, but for multi-dimensional, it is computationally very expensive, so we will not use it. We employ the following approximations in addition to these reduced assumptions for ease of usage. Generally, the frequency f in the range of [, ] corresponds to the wavelength range [, ]. For example, the frequency range of [20, 500 kHz] corresponds to the wavelength range of 0.7 to 17 mm. Any wavelength can also be used for easy implementation to solve specific problems. In practice, you may modify the range by changing the wavelength (or frequency). The detectable range (or maximum wavelength) should be chosen to fit the target field’s size and then adjusted downwards. The range is very small. Moreover, it is not always necessary to use the wavelength itself. Alternatively, you can alter the frequency while maintaining the wavelength constant. This is due to the fact that and are connected, as is a constant. We shall employ the following approaches during the implementation phase. We can simplify by assuming that is in the range [0, ]. Higher frequencies, we know, have shorter wavelengths and propagation distances. A few metres is common for bats. The pulse frequency is merely [0, 1]. Where 0 denotes no pulses at all and 1 denotes the greatest rate of pulse emission. Fig. 2 indicates the step by step process of Bat algorithm and it’s process. The fundamental BA stages can be represented as the pseudo code Fig. 3 using these approximations and idealizations.
Fig. 2Flow chart of Bat algorithm [12]
![Flow chart of Bat algorithm [12]](https://static-01.extrica.com/articles/22148/22148-img2.jpg)
3.3. Velocity and position vectors of virtual bats
Virtual bats are used to create a realistic environment. The indicates the function value which is indicated by Eq. (1). In the -dimensional search space, you must specify rules for updating location and velocity as seen in Eq. (2). At time step , the new solution and velocity are provided by:
where [0, 1] is a random vector produced from a uniform distribution among them. After evaluating all answers across all bats, is the current global best position (solution) which is indicated in Eq. (3). We may utilize (or to alter the speed change while adjusting other factors (or ), depending on the type of concern, because the product is the speed increment. According to the domain size of the problem of interest, we’ll use 0 and 100 in our implementation. Initially, each bat was given a frequency based on [, ]” [12], which was determined at random. Once a solution is chosen from the current best solutions for the local search section, a local random walk will be utilized to produce a new solution for each bat as shown in Eq. (4):
where [–1 1] is a random number, and is the average loudness of all bats in this time step. The update of the speed and position of the bat is somewhat similar to the process in the standard particle swarm optimization, because it actually controls the speed and range of the movement of the swarm particles. To a certain extent, BA can be seen as a balanced combination of standard particle swarm optimization and dense local search controlled by loudness and pulse rate [12].
Fig. 3Pseudo code of Bat algorithm
3.4. Variations of loudness and pulse emission
In addition, as the iteration progresses, the loudness as seen in Eq. (5) and the pulse emission rate must be updated accordingly. Since once the bat finds its prey, the loudness usually decreases, as the rate of pulse emission rises, the loudness may be set to any setting that is appropriate. We can take 100 and 1 as examples. We may alternatively use 1 and 0 for convenience, assuming that 0 indicates that the bat has just identified its prey and has momentarily ceased producing any noises as per the Eq. (5) [12]. Now we have:
where and are constants. In fact, a is similar to the cooling factor of the cooling plan in simulated annealing. For any 0, , 1, 0, , we have:
“In simple cases, we can use , while in simulation we have actually used 0.9. The choice of parameters requires some experimentation. Initially, each bat should have a different loudness and pulse emission rate value, which can be achieved by randomization. For example, the initial loudness can usually be [1 2], and the initial emissivity can be about zero, if used, it can be any value [0 1]. Only when new solutions are improved, their loudness and emissivity will be updated, which means that these bats are moving towards the best solution” [12].
4. Result analysis and discussion
4.1. Mean value of surface roughness
Table 7 depicts the whole factorial design of the experiment with independent process parameters, including the response variable's level and assessed roughness value. In addition, we also found the average roughness.
Table 7L9 Taguchi orthogonal array design layout matrix and experimental
Exp No | Cutting speed | Feed rate | Depth of cut | Ra1 | Ra2 | Ra3 | Ra4 | Mean Ra |
1 | 200 | 0.1 | 0.5 | 1.272 | 1.758 | 1.240 | 1.207 | 1.3692 |
2 | 200 | 0.2 | 0.8 | 4.371 | 4.062 | 4.327 | 4.479 | 4.3097 |
3 | 200 | 0.3 | 1.2 | 9.936 | 9.622 | 10.358 | 10.095 | 10.0027 |
4 | 250 | 0.1 | 0.5 | 1.289 | 1.252 | 1.254 | 1.488 | 1.3207 |
5 | 250 | 0.2 | 0.8 | 4.088 | 3.648 | 4.180 | 4.357 | 4.0682 |
6 | 250 | 0.3 | 1.2 | 10.432 | 10.498 | 9.297 | 9.642 | 9.9672 |
7 | 290 | 0.1 | 0.5 | 1.314 | 1.667 | 1.424 | 1.308 | 1.3109 |
8 | 290 | 0.2 | 0.8 | 3.661 | 3.554 | 3.559 | 3.705 | 3.5697 |
9 | 290 | 0.3 | 1.2 | 9.030 | 9.108 | 9.389 | 9.832 | 9.3397 |
4.2. Values of the signal-to-noise ratio
Table 8 demonstrates that the total service factor, or surface roughness , is essentially constant across all levels of cutting speed and cutting depth DOC, however it is unclear if the quality of the surface roughness diminishes as the feed speed rises. The third level’s cutting speed = 290 m/min, the second level’s cutting depth = 0.5 mm, and the first level’s feed = 0.1 mm offer the greatest overall practical value. According to the primary effect diagram of the mean value, the feed is the most significant regulating element influencing the performance characteristics of the surface roughness .
Table 8Response table for signal to noise ratios
Level | Speed | Feed | DOC |
1 | –11.807 | –2.747 | –11.251 |
2 | –11.525 | –11.977 | –11.504 |
3 | –11.185 | –19.794 | –11.762 |
DELTA | 0.622 | 17.046 | 0.511 |
RANK | 2 | 1 | 3 |
4.3. Application of analysis of variance (ANOVA)
To assess the suitability of the created model, the analysis of variance (ANOVA) approach was applied. The results of fitting linear regression equations are provided in the form of analysis of variance to assess the significance of each model coefficient (ANOVA).
Table 7 shows the findings of the experiment, which were examined using analysis of variance (ANOVA) to find the factors that had a significant impact on the performance indicators. The ANOVA results with surface roughness are shown in Table 9. The table’s last column displays the present contributions of major sources of overall change, as well as the degree of effect they have on the outcomes.
Table 9Analysis of variance
Source | DF | Adj SS | Adj MS | F-Value | P-Value |
Speed | 1 | 0.288 | 0.288 | 0.27 | 0.623 |
Feed | 1 | 105.769 | 105.769 | 100.43 | 0.000 |
Doc | 1 | 0.063 | 0.063 | 0.06 | 0.817 |
Error | 5 | 5.266 | 1.053 | ||
Total | 8 | 111.386 |
4.4. Regression analysis
Multiple linear regressions was used to predict the link between the factors of cutting speed , cutting depth , and feed , as well as the performance measurement surface roughness . The final regression model in terms of the encoding parameters of the following parameters is denoted:
Surface Roughness () = –6.290 – 0.00528, Cutting Speed – 67.7, Feed rate + 31.38 DOC.
5. Results and discussion
Performing a verification experiment is the last step that is crucial to a robust design methodology. The conformation experiment is carried out under the best control factors. The third-level cutting speed 290 rpm, the second-level cutting depth 0.5 mm, and the first-level feed 0.1 mm/min are the optimal control factors. Calculate the signal-to-noise ratio for this condition using the surface roughness value. Table 10 displays these figures. The Bat heuristic algorithm is used to solve the formulated optimization issue, and the result is achieved and compared to the S/N ratio result. The bat algorithm code was run on Matlab version 2020 with machine specification as 4 GB ram and i5 processor. The graph representation the optimization obtained from the bat algorithm is shown in Fig. 4.
Fig. 4Optimum answer obtained from Bat algorithm
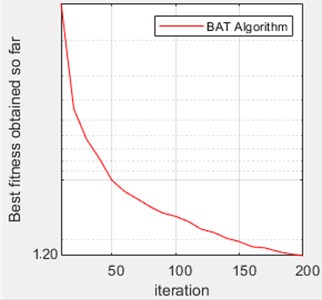
Table 10Result table
Parameter | Result from S/N ratio | Optimized result from bat |
Speed | 290 | 289 |
Feed | 0.1 | 0.11 |
Depth of cut | 0.5 | 0.56 |
Surface roughness | 1.3109 | 1.28 |
6. Conclusions
The current work involves determining the optimal settings of single parameter optimization and multi-response optimization process parameters for machining on CNC machine tools of EN8 steel based on the Taguchi method and Bat-inspired algorithm. The advantage of Taguchi method in simplifying experiments is effectively used in the design and analysis of surface quality in this study. The experimental test results demonstrate that the feed speed has the greatest influence on the surface roughness of EN8 steel during the CNC turning process. The quality of the machined surface decreases as the feed and speed increases. The bat-inspired algorithm solves the same problem and obtains the best result. The minimum surface roughness () reaching 1.302 corresponds to: cutting speed 290 m/min depth of cut, 0.5 mm/rev and feed = 0.1 mm. The surface roughness obtained from the bat-inspired algorithm is 1.28 (mm). Since the surface roughness should be minimized, the bat algorithm improves the surface roughness by 3 %.
References
-
D. Kanakaraja, D. Anjan Kumar Reddy, M. Adinarayana, and L. Vamsi Krishna Reddy, “Optimization of CNC turning process parameters for prediction of surface roughness through Taguchi’s parametric design approach,” International Journal of Mechanical Engineering and Robotics Research, Vol. 3, No. 4, pp. 708–714, 2014.
-
O. Kulkarni and S. Kulkarni, “Process parameter optimization in WEDM by Grey Wolf optimizer,” Materials Today: Proceedings, Vol. 5, No. 2, pp. 4402–4412, 2018, https://doi.org/10.1016/j.matpr.2017.12.008
-
N. K. Kulkarni, S. Patekar, T. Bhoskar, O. Kulkarni, G. M. Kakandikar, and V. M. Nandedkar, “Particle swarm optimization applications to mechanical engineering – a review,” Materials Today: Proceedings, Vol. 2, No. 4-5, pp. 2631–2639, 2015, https://doi.org/10.1016/j.matpr.2015.07.223
-
L. Patekar et al., “Ant colony optimization and its applications in mechanical engineering review,” Industrial Engineering Journal, Vol. 9, No. 2, pp. 41–45, 2016.
-
A. G. Neve, G. M. Kakandikar, O. Kulkarni, and V. M. Nandedkar, “Optimization of railway bogie snubber spring with grasshopper algorithm,” in Advances in Intelligent Systems and Computing, Singapore: Springer Singapore, 2020, pp. 941–952, https://doi.org/10.1007/978-981-15-1097-7_80
-
G. M. Kakandikar, O. Kulkarni, S. Patekar, and T. Bhoskar, “Optimising fracture in automotive tail cap by firefly algorithm,” International Journal of Swarm Intelligence, Vol. 5, No. 1, p. 136, 2020, https://doi.org/10.1504/ijsi.2020.106396
-
S. P. Mhatugade, G. M. Kakandikar, O. K. Kulkarni, and V. M. Nandedkar, “Development of a multi-objective Salp swarm algorithm for benchmark functions and real-world problems,” Optimization for Engineering Problems, pp. 101–130, Jul. 2019, https://doi.org/10.1002/9781119644552.ch5
-
A. S. Joshi, O. Kulkarni, G. M. Kakandikar, and V. M. Nandedkar, “Cuckoo search optimization – a review,” Materials Today: Proceedings, Vol. 4, No. 8, pp. 7262–7269, 2017, https://doi.org/10.1016/j.matpr.2017.07.055
-
M. T. Bhoskar, M. O. K. Kulkarni, M. N. K. Kulkarni, M. S. L. Patekar, G. M. Kakandikar, and V. M. Nandedkar, “Genetic algorithm and its applications to mechanical engineering: A review,” Materials Today: Proceedings, Vol. 2, No. 4-5, pp. 2624–2630, 2015, https://doi.org/10.1016/j.matpr.2015.07.219
-
A. J. Kulkarni, I. P. Durugkar, and M. Kumar, “Cohort intelligence: a self supervised learning behavior,” in 2013 IEEE International Conference on Systems, Man and Cybernetics (SMC 2013), pp. 1396–1400, Oct. 2013, https://doi.org/10.1109/smc.2013.241
-
S. Patel, G. M. Kakandikar, and O. Kulkarni, “Applicability and efficiency of socio-cultural inspired algorithms in optimizing mechanical systems – a critical review,” Review of Computer Engineering Studies, Vol. 7, No. 2, pp. 31–41, Jun. 2020, https://doi.org/10.18280/rces.070203
-
X.S. Yang and A. Hossein Gandomi, “Bat algorithm: a novel approach for global engineering optimization,” Engineering Computations, Vol. 29, No. 5, pp. 464–483, Jul. 2012, https://doi.org/10.1108/02644401211235834
-
R. Pranav Kshirsagar, R. Somesh Pise, A. Sunil Pokalekar, Mahindra Goudadaba, and Duradundi Sawant. Badkar, “Optimization of surface roughness of EN8 Steel in CNC turning operation by Taguchi concept,” in International Conference on Recent Innovations in Engineering and Management, 2016.
-
M. Ranganath S., Vipin, and Harshit, “Surface roughness prediction model for CNC turning of EN8 steel using response surface methodology,” International Journal of Emerging Technology and Advanced Engineering, Vol. 5, No. 6, pp. 135–144, 2015.
-
P. Surulimani, A. Karthikraja, V. Sivaganesan, J. Gowthaman, and M. Yojiith, “Optimization of CNC turning parameters on EN36B steel using Taguchi method,” International Journal of Innovative Research in Science, Engineering and Technology, Vol. 5, No. 2, pp. 1692–1700, Feb. 2016.
-
N. Ganesh, M. Udaya Kumar, C. Vinoth Kumar, and B. Santhosh Kumar, “Optimization of cutting parameters in turning of EN8 steel using response surface method and genetic algorithm,” International Journal of Mechanical Engineering and Robotics Research, Vol. 3, No. 2, pp. 75–86, 2014.
-
R. Ramya, T. T. M. Kannan, S. Giridharan, R. Baskaran, and J. Madhan, “Optimization of turning parameters o fEN8 steel cylindrical rods using Taguchi methodology,” International Journal of Mechanical Engineering and Robotics Research, Vol. 3, No. 4, pp. 360–366, 2014.
-
Chintan Kayastha and Jaivesh Gandhi, “Optimization of process parameter in turning of copper by combination of Taguchi and principal component analysis method,” International Journal of Scientific and Research Publications, Vol. 3, No. 6, 2013.
-
K. G. Nikam and S. S. Kadam, “Optimization of surface roughness of en8 steel by changing cutting parameters and insert geometry in turning process,” International Journal of Science and Research (IJSR), Vol. 3, No. 11, pp. 1331–1335, 2014.
-
Basil M. Eldhose, Cijo Mathew, and Binumar Kose, “Optimization of the cutting parameters of SS 304 FOR CNC turning operation,” International Journal of Innovative Research in Advanced Engineering, Vol. 1, No. 8, pp. 22–31, 2014.
-
Arshad Qureshi, Madhukar Sorte, and S. N. Teli, “Optimization of cutting parameters for surface roughness in CNC turning of P20 steel,” International Journal of Scientific and Engineering Research, Vol. 6, No. 12, pp. 133–138, Dec. 2015.
-
K. Shunmugesh, K. Panneerselvam, M. Pramod, and Amal George, “Optimization of CNC turning parameters WITH carbide tool for surface roughness analysis using Taguchi analysis,” International Journal of Engineering Research and Technology (IJERT), Vol. 3, No. 6, pp. 103–107, 2014.
-
S. N. Naik, J. S. Sidhu, and S. S. Kulkarni, “Optimization of cutting parameters of SS316 using different cutting tools on CNC lathe,” International Journal of Scientific Research and Management Studies, Vol. 1, No. 9, pp. 275–282, 2013.
-
Dalip Kumar and Kulbhushan Sharma, “Optimization of CNC turning parameters for surface roughness by using Taguchi method on EN-24,” International Journal of Mechanical and Production Engineering (IJMPE), Vol. 4, No. 8, pp. 17–20, 2016.
-
Sushilkumar Sharma and Sandeep Kumar, “Optimization of surface roughness in CNC turning of mild steel (1018) using Taguchi method,” International Journal of Engineering Research and Technology (IJERT), Vol. 3, No. 1, pp. 2928–2932, Jan. 2014.
-
P. Madhava Reddy, P. Vijaya Bhaskara Reddy, Y. Ashok Kumar Reddy, and N. Naresh, “Optimization of machining parameter for turning of EN16 steel using grey based Taguchi method,” ARPN Journal of Engineering and Applied Sciences, Vol. 9, No. 3, pp. 215–222, 2014.
Cited by
About this article

