Abstract
According to the convexity theory, the working principle of the disc brake of mining motor vehicle is analyzed. The dry friction force between brake disc and brake block is mainly composed of three mechanisms, such as meshing effect, adhesion effect and furrow effect. The Link NVH 3900 device is used to simulate the long downhill braking condition with bench test method, which can obtain friction performance with high credibility in different brake conditions. The average friction coefficient and friction stability coefficient are chosen as the evaluation parameter for friction performance judgment. Through the research results, it can be known that the average friction coefficient of the brake decreases linearly with brake pressure increases, the friction stability coefficient under different braking pressure showed numerically larger and smaller fluctuations. When the temperature of disc surface exceeds 200 °C, the resin lubricating film will be produced in the brake block, which will decrease the friction coefficient obviously. The actual braking torque does not increase linearly with the increase of braking pressure, especially when the brake speed is high, the friction coefficient will decrease obviously.
1. Introduction
With the improvement of coal mining capacity, the mining motor vehicle is developing rapidly in the direction of high speed and high carrying capacity, which requires higher reliability of the braking system [1]. The coal industry standard shows that motor vehicle brake in the main mandatory requirements the precise control of braking torque, the ability of constant velocity keeping, good parking capacity, and stable service life. At present, the type and structure of the locomotive brake are varied. Among them, the hydraulic disc brake is widely applied in the braking system of mining motor vehicle, and gradually replaced the traditional brake-shoe brake, due to the advantages of large braking torque and good heat dissipation [2, 3].
In this paper, the type of ventilated disc brake is taken as the research object. Based on the related brake standards, the friction performance of the brake is studied based on the bench test method. Through the experimental study of friction parameters, the braking performance under different working conditions can be inferred, which would provide important basis and technical support for the reliability of mining motor vehicle braking system.
2. Analysis of disc brake friction mechanism
2.1. Contact state of friction pair
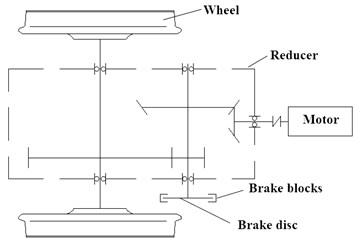
The disk brake used in the mining motor vehicle consists of one brake disc and two brake blocks, which are mounted on the speed shaft of the reducer, as shown in Fig. 1. According to the working principle of disc brake and friction micro protruding theory, the dry friction between brake disc and brake block is composed of different mechanisms.
There is a certain degree of roughness between the friction pairs, which results in the forced deformation resistance of the convex bodies in the actual contact area between the brake disc and the brake blocks, namely the engaging force [4]. According to the theory of mechanical-molecular action proposed by Cola Gailes Ki, the meshing friction force caused by the meshing action [5] can be expressed as followed:
where is the meshing friction resistance, is the micro meshing area, is tangential stress, is the normal load factor, is compressive stress, and is an index that tends to 1.
Fig. 1Schematic diagram of brake installation
Because of the difference of materials physical properties between the brake disc and brake block, the softer material surface will occur plastic deformation and contact adhesion under the working pressure, similar to the cold welding effect. The real contact area of the adhesive contact under the steady state condition can be expressed as followed:
where is the true contact area of the adhesive contact under steady condition, is brake pressure, is the compression yield limit of the brake disc.
During the braking process, the adhesive contact between the pairs of friction pairs will be plastic flow, which makes the real contact area increase. According to the modified adhesion theory [6], the real contact area under the non-steady state of the adhesive contact can be obtained as followed:
where is the real contact area under sliding friction, is tangential force, is adhesive shear strength that affected by the roughness, hardness and temperature.
The constant formation and disappearance of the adhesive contacts will result in the adhesive force of , of which calculation formula is:
The disk brake of the mine motor vehicle does not belong to sealing work device, so the friction surface will inevitably fall off or fall into some hard particles, which will lead furrow action. Taking the conical furrow model as an example, the friction resistance can be expressed as followed:
where is the projection area in the vertical plane model, is the radius of the conic model, is the penetration depth of hard particles.
2.2. The solution of braking torque
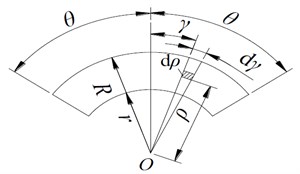
Braking torque is one of the basic indexes to measure the brake performance. The size of the brake torque is directly related to the structure size of the brake disc. The schematic diagram of brake structure is shown in Fig. 2. Assume that the friction pair of the disc brake has uniform contact and no local compression, then the braking torque per unit area is:
where stands for friction coefficient, stands for friction surface pressure per unit, stands for radial size of brake, stands for angle displacement.
The friction surface pressure per unit of the brake disc is:
where is the hydraulic pressure of the push disk, is mechanical transfer efficiency, is outer radius, is inner radius.
Due to the symmetry distribution of the brake disc, the braking torque of the whole brake can be obtained by the integrating of Eq. (6):
Fig. 2Schematic diagram of brake disc structure
3. Design of friction test
3.1. Type of test and choice of scheme
Disc brakes are widely used in many fields and fields, as a result, a series of test standards have been formed [7]. At present, there are mainly three methods of disc brake in the standard tribology and industry, such as standard sample test, bench test and real vehicle test. Considering the characteristics of these three test types, the bench test method based on Link NVH 3900 test bench is adopted to simulate the long downhill braking condition of mine motor vehicle. The test bench is one of the most advanced equipment used for disc brake friction test at present. It can not only get comprehensive parameters, but also exert the air flow condition of electric locomotive at different driving speeds. The reliability of the test results is very high.
3.2. Test design and installation
In order to avoid test errors caused by machining accuracy, the geometric tolerance of brake discs should be measured before testing, especially flatness and cylindricity, so as to ensure that the size accuracy of the tested samples is accords with the brake test standard. The installation sketch of disc brake performance test is shown in Fig. 3, where the brake disc is located on the output shaft of the tester, and the external sensors include temperature sensors, torque sensors, speed sensors and pressure sensors. In order to research the effect of braking temperature on the friction performance, the temperature sensor was selected with fine armored thermocouple, of which thermal response time is less than 0.01 s. During installation, a small drill is punched on the surface of the brake disc, where the temperature sensor is embedded into.
3.3. Test design and installation
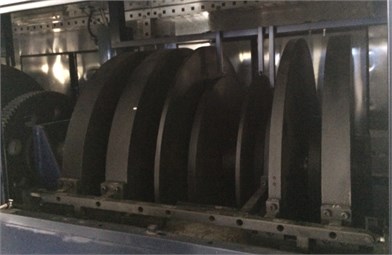
In the Link3900 NVH test platform, the inertia control is realized by the combination of mechanical simulation and electrical stimulation. In order to ensure the differential conditions, the mechanical flywheel (as shown in Fig. 4) and the number of inertia mainly has three kinds of combinations, such as arithmetic, geometric and arithmetic geometric mixing. Mechanical inertia is easy to control, but it cannot simulate the resistance of the vehicle, such as air resistance, road condition resistance and so on. But the electrical simulation can make up for this problem effectively. The principle of electric simulation is to simulate the friction work through the electromagnetic torque output by the motor, so that the bearing condition of the brake is basically the same with the actual working condition, and the number of mechanical flywheels is greatly reduced. During the braking process, the vehicle has a forward trend due to inertia. Therefore, the braking pressure of the front and rear brakes is different. The braking moment of the front wheel is greater, and the inertia of the brake is 70 %-80 % of the total inertia of the vehicle.
Fig. 3The installation sketch of disc brake
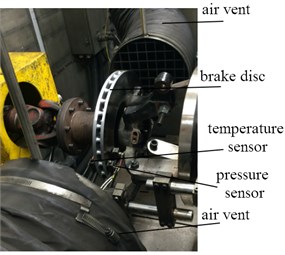
Fig. 4Mechanical flywheel structure
4. Test of friction performance parameters
4.1. Evaluation parameter definition
In tribology, there are very many parameters that can be used to measure friction properties. According to the working condition of mining motor vehicle, the two parameters are taken as evaluation parameter of friction performance, including friction coefficient and friction stability coefficient (also called friction coefficient stability). The friction coefficient is a non-stationary physical quantity, which is related to the material properties and external loads of the friction pair. It can comprehensively measure the stability of the friction torque. In the bench test, the friction coefficient is calculated as follows:
where is friction force, is the macro contact area of brake.
The friction stability coefficient is a common performance parameter in modern tribology, which can show the fluctuation of the friction coefficient. Generally speaking, for the brake material, if the friction stability coefficient keeps stable in a relatively high range, it shows that the reliability of the brake is good. If obvious fluctuations occur, the material needs to be further adjusted and optimized. In the bench test, the friction stability coefficient can be obtained directly by programming, and the formula in the single test period can be expressed as follows:
where is average friction coefficient in the single period, is the maximum friction coefficient in the single period.
4.2. Test cycle setting
According to the sampling frequency of each sensor, the test period is set as 1second. The time step of the data acquisition system is set as 0.01 second, and the number of test cycles under each working condition is set as 100 times. The test data are greatly influenced by the temperature. Therefore, the temperature condition should be considered as the sampling period. The adjacent test period needs a certain interval. During the period, the temperature of the chamber is adjusted by the thermostat, which makes the initial temperature of each cycle test consistent. The velocity parameter in the test means constant braking speed with long downhill slope, and the relation between the braking speed and wheel speed can be expressed as follows:
where is wheel speed, is braking speed, is wheel radius.
4.3. Change characteristics of transient friction coefficient
In each test period, the load and boundary conditions of the brake are set to constant ambient temperature, constant brake pressure and constant braking speed. Finally, the variation curve of the friction coefficient in the single test period is obtained as shown in Fig. 5. As can be seen in Fig. 5, the coefficient of friction shows three distinct stages of change.
(1) The stage of initial braking. In the instant contact of the friction pair, the friction coefficient increases linearly in a very short time, and then the slow nonlinearity increases. At this stage, the friction is dominated by the meshing action, and the adhesion gradually increases.
Fig. 5Change of friction coefficient in single test period
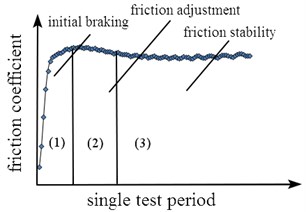
(2) The stage of friction adjustment. With the continuation of braking, the braking pressure increases gradually and tends to be stable. The influence of adhesion on total frictional force increases. The increasing rate of real contact area is greater than that of contact separation, which makes the friction coefficient decrease.
(3) The stage of friction stability. When the three factors of friction formation reach dynamic equilibrium, the dynamic friction coefficient will show a stable state that means fluctuating in a very small range.
5. Analysis of test results
5.1. Effect of brake pressure on friction properties
Braking pressure is one of the most critical factors to determine the friction torque. The research of the relationship between brake pressure and friction performance can provide an important basis for the improvement of the braking efficiency of the motor vehicle and the optimal control of the hydraulic system. In the study of the effect of brake pressure, the braking speed is used as a single variable, and the ambient temperature is set as constant value of 26 °C. Data acquisition is carried out at six different brake speed respectively, and the relationship between brake pressure and average friction coefficient is obtained as shown in Fig. 6. The relationship between brake pressure and the coefficient of friction stability is shown in Fig. 7.
Fig. 6Change of average friction coefficient
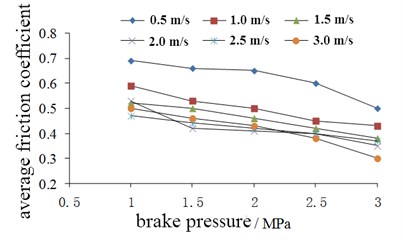
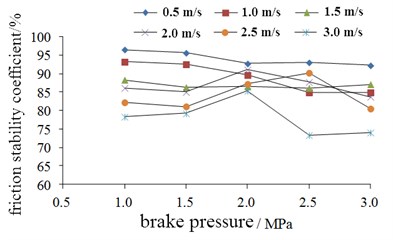
Fig. 7Change of friction stability coefficient
In Fig. 6, it can be seen that the average friction coefficient of the brake will approximately linearly decrease with the increase of the braking pressure under each different condition of braking speed. When the brake speed is 0.5 m/s, the average friction coefficient is always greater than 0.5. With the increase of the brake speed, the average friction coefficient shows a tendency of decreasing.
In Fig. 7, it can be seen that the friction stability coefficient shows larger values and smaller fluctuations under different braking pressures. It also shows that the brake friction material of HT250 has good friction stability. When the brake pressure is less than 1.5 MPa, the friction stability coefficient of the brake shows decrease state with the increase of the brake speed. When the brake pressure is 2 MPa, the difference of the friction stability coefficient at different speeds is not obvious.
According to the above analysis results, it can be known that the actual braking torque does not increase linearly with the increase of braking pressure, especially when the brake speed is high, the friction coefficient will decrease obviously.
5.2. Effect of temperature on friction properties
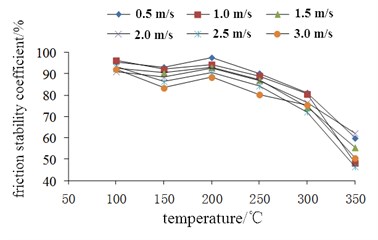
Temperature is the essential factor affecting the friction performance of the brake, and it is also the fundamental cause of the thermal fatigue failure. In this test, the braking pressure is constantly defined as 2 MPa. Finally, the average friction coefficient at different brake speeds and the variation characteristics of the friction stability coefficient with temperature are shown in Fig. 8 and Fig. 9 respectively.
In Fig. 8, it can be seen that the average friction coefficient increases first and then decreases with the increase of temperature. The average friction coefficient reaches the maximum at 200 °C, and decreases sharply when it is over 300 °C. This is due to the fact that there is a certain binder in the brake block. The lagging resistance is most significant at 200 °C. When the temperature is over 200 °C, the resin lubrication film will be produced inside the brake block, which makes the meshing effect obviously reduced.
From Fig. 9, it can see that the relationship between friction stability coefficient and temperature is similar to the average friction coefficient, and it shows very small difference in the condition of different brake speed.
According to the above analysis results, it can be known that optimizing the design of materials and structures to further improve the heat dissipation ability of disc brakes and reduce the peak temperature of brake discs is an important way to improve the reliability and safety of the mining motor vehicle brake system.
Fig. 8Change of average friction coefficient
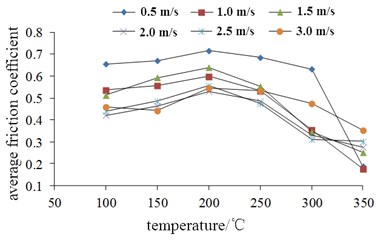
Fig. 9Change of friction stability coefficient
6. Conclusions
The bench test can simulate the braking condition of the mining motor vehicle, and the credibility of the test result is very high, which can provide an important basis for the optimization design of disc brake. The results showed that the change of friction coefficient of the brake test period is the common effect of meshing effect, adhesion effect and result of the furrow, showed three stages obviously. The brake torque of the brake does not necessarily increase with the increase of braking pressure, and in order to ensure the braking effect, the brake should have good heat dissipation capability.
References
-
Cuisu K., Fenfen L. Design of brake test bed for mine motor vehicle. Coal Mine Machinery, Vol. 31, Issue 8, 2010, p. 160-161.
-
Xiandong L., Zengjie R. Test and analysis of friction characteristics and brake scream of disc brake. Vibration Test and Diagnosis, Vol. 33, Issue 5, 2013, p. 746-750.
-
Xiangzhou Q., Haixin T. Research on transportation brake system based on coal mine motor vehicle. Engineering Technology: Digest Version, Vol. 44, Issue 5, 2016, p. 318.
-
Rong F., Fei G., et al. Tribological behavior of copper based composites under dry and wet conditions. Journal of Composite Materials, Vol. 27, Issue 1, 2010, p. 79-85.
-
Zhendong D., Qunji X. Thermodynamic study of friction and wear: current situation and prospect. Chinese Science: Technical Science, Vol. 39, Issue 7, 2009, p. 1211-1215.
-
Dengfeng W., Yuwei., Haitao H. Finite element analysis and test of brake scream of disc brake. Automobile Engineering, Vol. 29, 8, p. 705-709.
-
Junwang D., Pingping Y., Xiang X. Effect of pressure on friction and wear properties of space docking friction materials. Nonmetallic Ore, Vol. 29, Issue 5, 2006, p. 59-62.
About this article

