Abstract
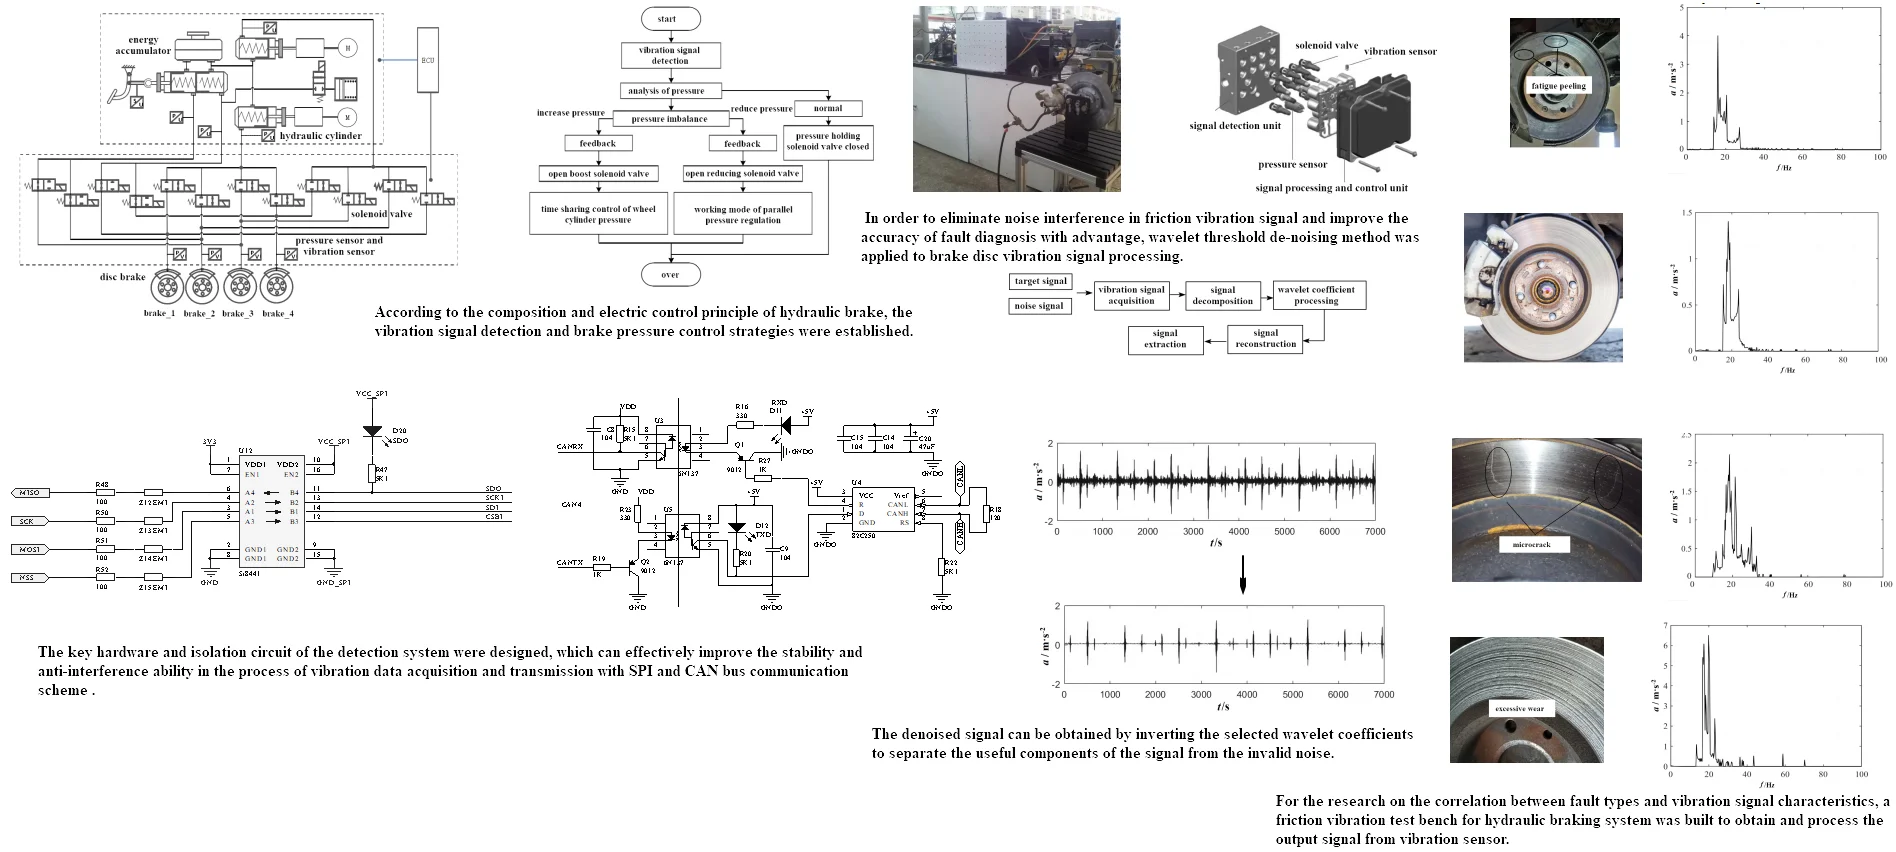
The friction vibration signal corresponding to different fault types of brakes is significantly different, thus a hydraulic disc brake fault diagnosis and judgment scheme based on vibration signal detection was proposed and validated in the paper. According to the composition and electric control principle of hydraulic brake, the vibration signal detection and brake pressure control strategies were established. The key hardware and isolation circuit of the detection system were designed, which can effectively improve the stability and anti-interference ability in the process of vibration data acquisition and transmission with SPI and CAN bus communication scheme. In order to eliminate noise interference in friction vibration signal and improve the accuracy of fault diagnosis with advantage, wavelet threshold denoising method was applied to brake disc vibration signal processing. The denoised signal can be obtained by inverting the selected wavelet coefficients to separate the useful components of the signal from the invalid noise. For the research on the correlation between fault types and vibration signal characteristics, a friction vibration test bench for hydraulic braking system was built to obtain and process the output signal from vibration sensor. The frequency spectrum response laws of vibration signals were compared and analyzed when the brake disc was normal and had surface defects, including microcracks, excessive wear and fatigue peeling. The external parameters such as brake pressure and spindle speed were keeping constant, thus eliminating the influence of working factors on vibration characteristics. In order to study the influence of brake pressure failure on friction vibration, the variation law of vibration signal is compared and analyzed under the condition of hydraulic valve leakage and pressure maintaining failure. The results show that the friction vibration signal can be used as an effective basis for judging the surface defects and brake pressure faults of brake discs. Under the condition of wavelet threshold denoising, accurate and effective vibration parameters can be obtained, which is of great significance to the safety and reliability of the braking system.
Highlights
- Wavelet threshold denoising method is applied to brake disc vibration signal processing to eliminate noise interference in friction vibration signals and improve the accuracy of fault diagnosis.
- The denoised signal was obtained by inverting the selected wavelet coefficients to separate the useful components of the signal from the invalid noise.
- Through the spectrum response law of vibration signal processing, surface defects such as normal and existing microcracks, excessive wear, and fatigue peeling of brake discs are actively identified.
1. Introduction
At present, the brake system fault detection [1] is still mainly based on regular maintenance, which is not conducive to finding the cause of the fault, nor can it monitor whether the working status of the brake and hydraulic system is within the normal working range [2]. Therefore, the real-time fault diagnosis [3] of hydraulic braking system is a necessary requirement for the development of vehicle intelligence. The research shows that in the process of braking, if the brake pressure from different wheel cylinders is uneven, one of the most direct manifestations is the increase of brake vibration and noise [4]. When the braking force interacts with the inertial force of the vehicle itself, excessive or small local load will cause abnormal vibration of friction pairs due to mutual impact, which belongs to uneven braking [5, 6]. The time-domain and frequency-domain characteristics of vibration signals are obviously different from the balanced steady state braking. Vibration analysis is widely used in fault identification and diagnosis [7-10]. The components in the vibration signal (such as frequency, amplitude, etc.) can be used as the key indicators to judge whether the brake pressure matches the stationary state of the vehicle. In addition, when the brake has undetectable faults, such as surface microcracks, excessive wear, fatigue peeling and other problems, the vibration signal can also show the characteristic change law. The detection and judgment of vibration signal can effectively diagnose the fault of the brake system, avoid the brake failure problem, and improve the safety of vehicle driving. Therefore, the detection and analysis of vibration signal can realize two functions in hydraulic brake, including pressure distribution control and fault diagnosis. Generally speaking, most vibration sensors are cheap and reliable, so they are widely used in vibration detection engineering. In this paper, an innovative scheme based on vibration signal detection is proposed to achieve the fault diagnosis of the brake itself and the hydraulic circuit. The research and application can not only improve the safety and stability of the braking process, but also accurately determine the fault type, which is convenient for equipment repair and maintenance.
2. Design of electronic control scheme for hydraulic brake system
2.1. Composition of braking system
In order to realize the detection and feedback control of the vibration signal synchronously, the electronic control system of the hydraulic brake is designed as shown in Fig. 1.
Fig. 1Electronic control structure of hydraulic braking
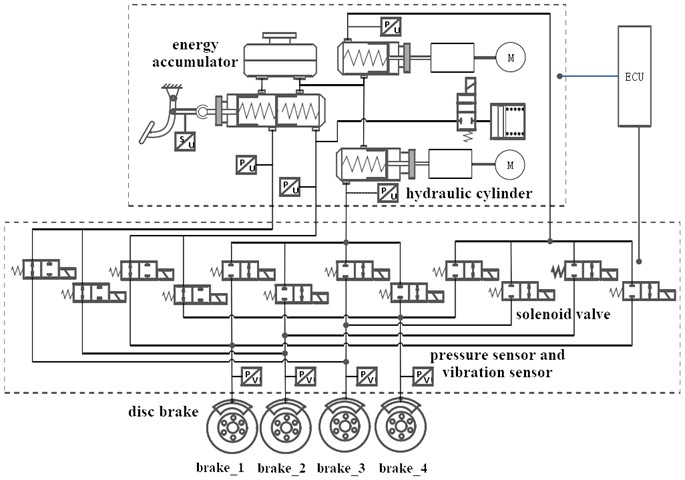
In the drive module, the drive motor is used to push the brake master cylinder or other energy supply devices (such as high-pressure accumulator, hydraulic pump, etc.), which is mainly used to provide the pressure source required in the system to meet the functional requirements of the brake system for rapid active braking control. The pressure regulating module is composed of normally open/normally closed solenoid valve, one-way valve and corresponding hydraulic circuit. It controls the solenoid valve and other actuating elements to realize the regulation of braking force of each wheel. On the one hand, in order to meet the requirements of the braking system for the braking force control accuracy, the linear proportional solenoid valve can be used in the pressure regulating device to achieve the accurate control of the braking force of each wheel by controlling the linear solenoid valve, or the multi-channel multiplexing time-sharing pressure regulating method can be used to achieve the accurate control of the braking force of each wheel by precisely controlling the medium pressure source of the driving device and cooperating with the action of the solenoid valve. On the other hand, in order to meet the requirements of the vehicle braking energy recovery function, the control of the isolation solenoid valve can be used in the pressure regulating device to achieve partial or complete decoupling between the brake pedal and the brake pressure.
2.2. Electronic control process of brake pressure
When the brake disc operates under different working conditions, it will produce different degrees of vibration. The frequency, amplitude and other characteristics of its vibration signal are the key indicators to determine the braking state. The acquisition of these vibration signals mainly depends on the brake pressure and acceleration sensors. Because the brake will be interfered by a large number of external vibrations in the working process, the data directly collected from the equipment are often mixed with strong redundant noise, which will seriously affect the judgment of braking stability, and cannot be used directly. Therefore, it is necessary to preprocess the collected vibration signal to reduce the interference of noise on the effective components of the signal and reconstruct a new feature data set. The stationary state feature of the vehicle in the braking process is to extract the time-domain and frequency-domain statistical features from the vibration signal, and extract the feature set of the vibration signal by using the energy value, spectral kurtosis, amplitude and other indicators. It is the key to improve the detection accuracy to extract the feature values comprehensively and accurately.
Fig. 2Electric control principle of brake pressure
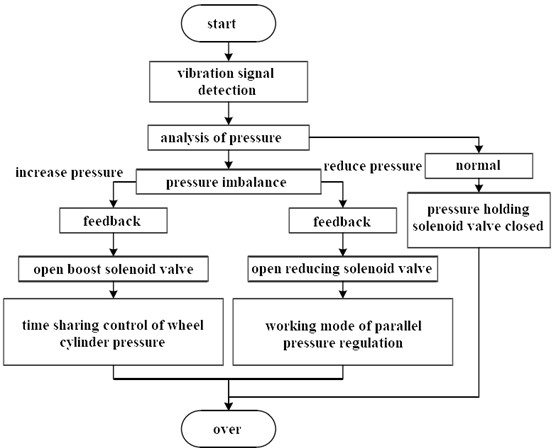
In the vehicle’s electronic braking mode, each hydraulic cylinder is connected to two brake wheel cylinders through two solenoid valves. The control unit calculates the target pressure of each wheel cylinder according to the pressure of the manual brake cylinder and the vibration sensor as shown in Fig. 2. The layout structure of the hydraulic braking circuit can be adjusted by cooperating with the action of the solenoid valve in the hydraulic regulating unit. Then, the motor torque will be automatically adjusted, and the piston of the hydraulic cylinder will be pushed. At the same time, the solenoid valves corresponding to each brake circuit are opened synchronously, so that the brake fluid flows into the brake wheel cylinder from the hydraulic cylinder, realizing the pressure increase or pressure reduction control of each wheel cylinder. The brake in the braking system can realize independent pressure control, so different braking effects can be obtained through different control schemes. According to the principle of the electro-hydraulic braking system designed in this paper, the pressure in the cavity of at least one hydraulic cylinder must be kept greater than the target pressure under the condition of parallel control, so as to obtain the instantaneous supercharging effect. In addition, the pressure in the cavity of the hydraulic cylinder needs to be greater than the minimum target pressure value to obtain effective braking pressure.
2.3. Hardware design of the detection unit
According to the electric control structure of the hydraulic brake, the whole control system can be modularized, including general control module, monitoring module, equalization module [11], acquisition module, communication module, etc. These modules work together to realize the functions of data acquisition, transmission, feedback, protection and display of vibration and pressure signals. The pressure sensor of strain type structure is used to detect the change of hydraulic braking force [12]. When the pressure increases, the length of the diaphragm and the piezoresistive measuring bridge connected to it changes. When the length changes, there are forces on the piezoelectric bridge element in the measuring bridge, which change the charge distribution in the piezoelectric element. When the charge distribution changes, the electrical characteristics of piezoelectric bridge elements will change. The electrical signal is proportional to the pressure and transmitted to the control unit as the amplified sensor signal. The core component of the brake pressure sensor is a piezoelectric element on which the brake fluid pressure acts. The other is the sensor electronics. If the brake fluid pressure acts on the piezoelectric element, the charge distribution on the element will change. If there is no pressure, the charge distribution is uniform. This voltage is amplified by the electronic device and then transmitted to the control unit as a signal. Therefore, the voltage is a direct reflection of the brake pressure. The three-axis vibration sensor [13] is selected for monitoring the vibration signal. When it works, it does not directly convert the original mechanical quantity to electrical quantity, but takes the original mechanical quantity to be measured as the input quantity of the vibration sensor, and then receives it by the mechanical receiving part to form another mechanical quantity suitable for transformation, and finally converts it into electrical quantity by the mechanical transformation part. Therefore, the working performance of the sensor is determined by the working performance of the mechanical receiving part and mechanical transformation part. The signal processing mode of the acquisition module is one of the key factors to determine the detection accuracy of the control system. From the structure point of view, the detection process of the acquisition module is mainly the signal acquisition and analog-to-digital conversion of Hall current element. Hall current element flows through the power signal line, and the induced voltage signal needs to be amplified before being transmitted to the controller. The controller can directly calculate the collected current value. In order to improve the stability of vibration signal in detection and transmission, digital signal isolation module is added, and its wiring structure is shown in Fig. 3. With the signal isolation module, it can not only protect the bus line, but also effectively avoid the mutual interference of signals between different modules and circuit faults.
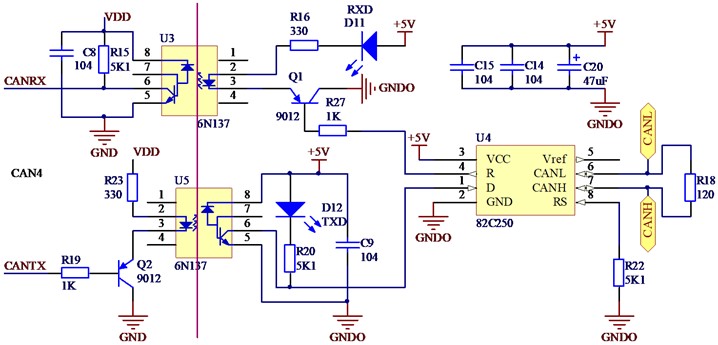
Communication module is the key module to realize vibration signal transmission, which can ensure the real-time of the measured data. The system adopts two communication modes, namely SPI communication and CAN bus communication [14, 15]. The application scope of these two communication methods is different. SPI communication is used for the transmission of various sensor signals. Its signal source is LTC6803-3 acquisition chip. CAN bus communication is mainly used to connect the main control module and the data display terminal. It can also be used to connect the debugging equipment during debugging to facilitate signal reading. The power terminals of SPI communication and CAN bus communication are set independently, and the interference is effectively reduced through the non common grounding isolation method. In terms of communication, the control core adopts PCA82C250 series chips. The chip can be directly connected with the physical bus, so it can effectively determine the working position and working state of the bus. The isolation circuit of CAN bus communication in the system is shown in Fig. 4, which can achieve good common mode signal suppression effect. In addition, the protection function is also very important. The high-speed optocoupler selected for the control module is 6N137 series, with strong anti-interference capability.
Fig. 3The wiring circuit of digital signal isolation module
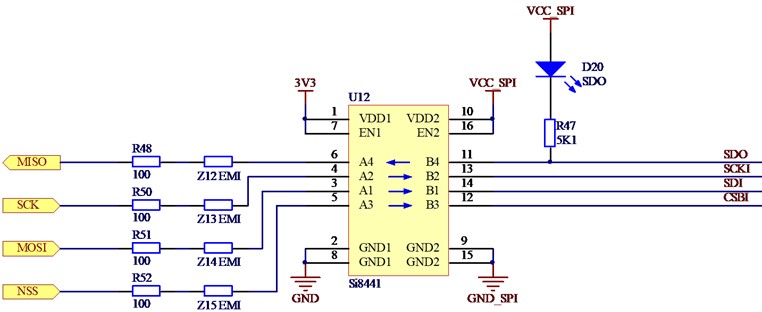
Fig. 4The isolation circuit of CAN bus communication
3. Decomposition and extraction of vibration signals
3.1. Signal preprocessing principle based on wavelet threshold denoising
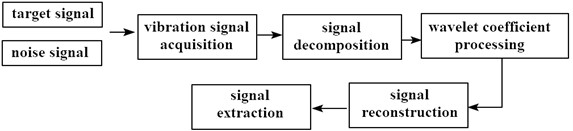
During braking, it is inevitable to be interfered by a large amount of external mechanical vibration, which leads to a large amount of noise in the collected friction vibration signal, making the signal show strong nonlinear and non-stationary characteristics. In some cases, if the signal is directly analyzed without considering the influence of noise, the extracted fault features may be annihilated by noise, which seriously affects the subsequent diagnosis accuracy. Therefore, reducing the influence of noise on the original vibration signal, optimizing the signal-to-noise ratio, and improving the quality of signal feature extraction are of great significance for brake fault analysis. The principle of wavelet threshold denoising method [16] is simple and the denoising effect is excellent, which can be used in the vibration signal processing of brake disc. To denoise the noisy signal is essentially to separate the relevant data of the signal as shown in Fig. 5. Because the distribution characteristics of noise energy in the wavelet domain of noisy signals are different, the useful characteristic components and invalid noise components in the signals can be decomposed into a series of different wavelet coefficients through wavelet trade noising’s form. Then, these coefficients are thresholded to select the wavelet coefficients that can further characterize the signal characteristics. Finally, the denoised signal is obtained by inverting the selected wavelet coefficients. According to the basic principle of wavelet threshold, the useful components and invalid noises of the signal are scattered in different parts of the wavelet domain. Based on this, the wavelet threshold denoising method can be summarized into the following three steps:
(1) According to different signal characteristics, the signal is decomposed by wavelet, and the wavelet coefficients of the decomposed signal in each layer are calculated;
(2) Through threshold processing, the wavelet coefficients that can further characterize the signal characteristics are selected;
(3) The wavelet coefficients are inversely transformed and reconstructed to obtain the noise reduction signal.
When wavelet threshold denoising method is used to analyze the data sequence, it is necessary to remove the noise signal from the collected signal as much as possible and retain the useful signal, the key of which is the selection of wavelet basis function. When the same type of signal is processed, different wavelet basis functions have different denoising effects. There is often no fixed standard for selecting the most suitable wavelet basis function, which is usually considered from four aspects: tight support, similarity, orthogonality and symmetry. The noisy signal with high feature matching should be selected. The reasonable setting of decomposition level determines whether the useful components in the vibration signal can be decomposed into high-frequency wavelet coefficients, while the noise components can be decomposed into low-frequency wavelet coefficients. A large number of studies have shown that too few decomposition layers will lead to little change in the signal-to-noise ratio, which can not achieve the purpose of noise reduction.
Fig. 5The signal preprocessing principle
3.2. Processing effect of vibration signal
The hard threshold function is used to denoise the signal, and because of the jump point, the step oscillation will occur at the threshold. The decomposed signal of the soft threshold function has no jumping point in the reconstruction process, which can make the reconstructed signal relatively smooth and ensure the overall continuity of the denoised signal [17]. Therefore, soft threshold function is selected to reduce the noise of brake vibration signal. Daubechies series (Db4) wavelet basis function and soft threshold function are selected for wavelet threshold denoising of vibration signals, and the decomposition level [18] is selected as 4 grade. In order to determine the appropriate threshold, the vibration signal at the drive end is used for testing, and SNR and RMSE are used as the evaluation indicators of noise reduction effect. The processing result of the measured vibration signal is shown in Fig. 6. It can be seen that the separation effect of the interference signal is very obvious. By comparing the waveforms in the original signal graph and the noise reduction signal graph, it can be seen that the original vibration signal will have obvious vibration effects due to the presence of noise. After noise reduction, the fault characteristics of the signal are clearer, the interference of the noise on the signal waveform is reduced, and the original vibration law of the fault signal waveform is highlighted.
Fig. 6Comparison results of signal processing
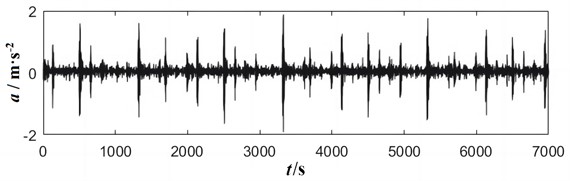
a) Before processing
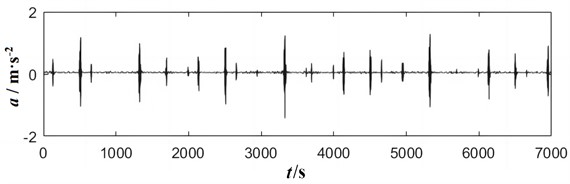
b) After processing
4. Correlation analysis of vibration signal and braking state
4.1. Fault analysis of single brake
According to the electric control principle of the hydraulic brake system and the diagnosis process of vibration signal detection, the brake test bench is built as shown in Fig. 7(a). In the hydraulic circuit, the arrangement of solenoid valve and hydraulic cylinder is consistent with the electric control system of the vehicle. The hardware structure of the main control unit is shown in Fig. 7(b), which was photographed by the author in the vibration testing laboratory on November 10, 2022. It can be seen that the pressure sensor is installed in an embedded structure. The vibration sensor is installed on the outer surface of the brake caliper to collect vibration signals between friction pairs. Under the conditions of microcrack, excessive wear and fatigue peeling of the brake disc, the output vibration signal of the sensor is detected, and the sampling frequency is selected as 300 Hz. The test condition is set to constant brake pressure of 1.5 MPa to eliminate the interference of pressure load on vibration signal.
Fig. 7The hardware structure of the main control unit
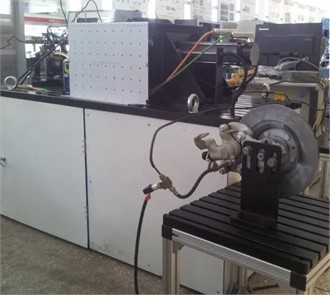
a) Brake fault diagnosis test bed
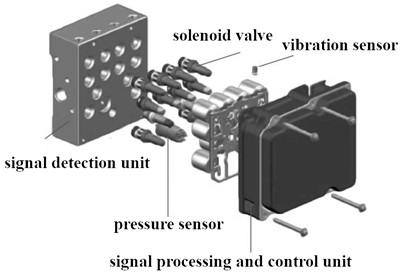
b) Structure of signal detection unit
4.1.1. Analysis of normal condition
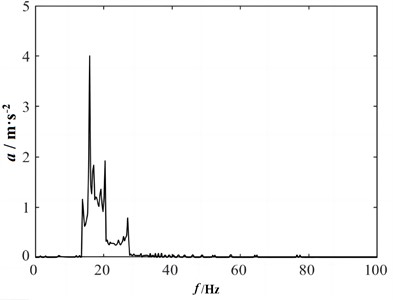
The main vibration in normal brake is friction vibration. In addition, installation errors and faults will also cause vibration, even shock vibration, of the brake disc. If the impact vibration is relatively strong, it will cause resonance, and then produce more intense vibration. These vibrations are transmitted randomly through different paths in a certain way. The frequency spectrum curve of vibration signal under constant brake pressure is shown in Fig. 8, which was photographed by the author in the vibration testing laboratory on November 10, 2022. It can be seen that the maximum acceleration amplitude is less than 1.5 m/s2, and there are mainly three significant resonance frequencies in the low frequency range. Due to the higher tolerance level of the normal brake disc, the vibration curve shows a certain symmetry. When the excitation frequency exceeds 30 Hz, the vibration effect caused by friction will become less obvious.
Fig. 8The spectrum response results with normal condition
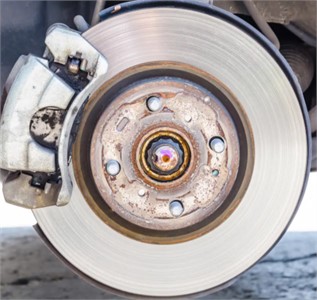
a) Brake appearance with normal condition
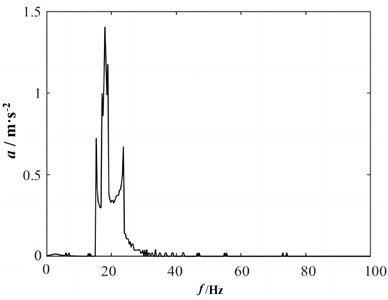
b) Frequency spectrum curve
4.1.2. Analysis of microcrack fault
The brake bears significant thermal load during operation, which belongs to periodic load. When the bending stress exceeds the bending fatigue limit, the brake disc is easy to produce fatigue cracks, mainly microcracks. The vibration response results of the brake under the condition of microcrack defects are shown in Fig. 9, which was photographed by the author in the vibration testing laboratory on November 10, 2022. It can be seen that, compared with the normal situation, the maximum amplitude of the brake disc with microcrack fault under the same brake pressure increases, and the number of resonance frequencies within the same frequency band increases. When the brake disc has microcrack fault, the flatness of the brake disc surface will change suddenly locally. Therefore, a relatively strong impact signal will be generated with obvious periodicity, and the maximum amplitude is 2-2.5 m/s2.
Fig. 9The spectrum response results with microcrack condition
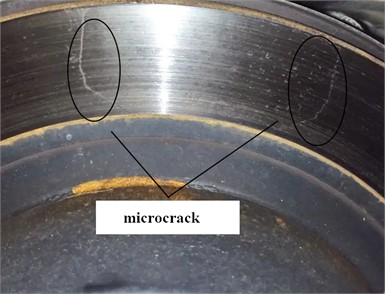
a) Brake appearance with microcrack condition
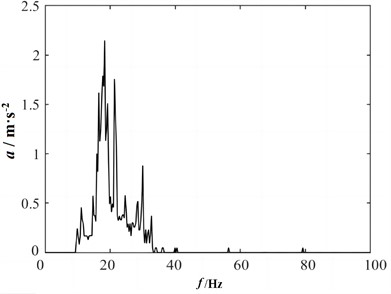
b) Frequency spectrum curve
4.1.3. Analysis of excessive wear fault
The wear of the brake disc includes abrasive wear, corrosion wear and impact wear. Abrasive wear is a common form of wear, which is generally caused by metal particles, dust and sand particles entering the surface of friction pairs. After wear, the thickness of the brake disc becomes thinner and the side clearance becomes larger, which will increase the dynamic load and increase the vibration and noise. The vibration response results of the brake under the condition of excessive wear fault are shown in Fig. 10, which was photographed by the author in the vibration testing laboratory on November 10, 2022. The brake disc is generally worn evenly. Unless it is subjected to severe impact load, the probability of local severe wear is low. When the brake disc is worn, the friction vibration frequency and its harmonic vibration components will be more prominent than normal due to the modulation phenomenon. Although the law of vibration will not change significantly, the amplitude will increase sharply, and the amplitude will increase with the increase of wear degree. The wear of the brake disc surface will increase the clearance of the friction pair, which will lead to the increase of the friction vibration frequency and the amplitude of each harmonic vibration component. However, the amplitude of the signal fundamental wave increases slowly, and the amplitude of each harmonic component increases much faster than the fundamental wave.
Fig. 10The spectrum response results with excessive wear condition
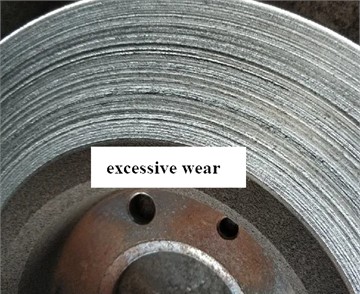
a) Brake appearance with excessive wear condition
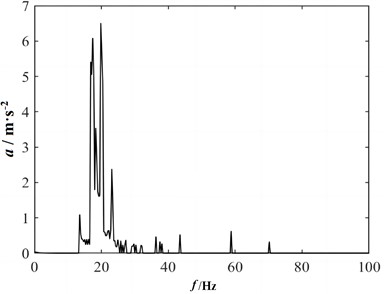
b) Frequency spectrum curve
Fig. 11The spectrum response results with fatigue peeling condition
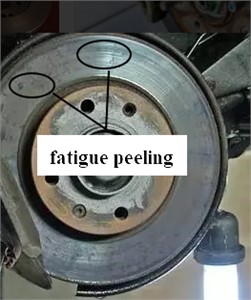
a) Brake appearance with fatigue peeling condition
b) Frequency spectrum curve
4.1.4. Analysis of fatigue peeling fault
Fatigue peeling is a common failure type of brake. Different from microcracks, it exists in the form of pits. The appearance of fatigue peeling will increase the local contact stress on the surface of the brake disc, leading to the deterioration of pitting corrosion, and further exacerbating the noise during friction. The vibration response results of the brake under the condition of fatigue peeling fault are shown in Fig. 11, which was photographed by the author in the vibration testing laboratory on November 10, 2022. It can be seen that the maximum amplitude of vibration response is greater than that of microcrack fault when the brake disc is fatigue peeling fault. Essentially, fatigue peeling fault is a special kind of wear fault, which will produce amplitude modulation of friction vibration frequency. Therefore, it belongs to small cycle fault, which also shows that the wave forms of these two kinds of faults are similar to some extent. However, in comparison, the side bands of fatigue peeling fault are more concentrated and have fewer orders, which is easy to distinguish.
4.2. Fault analysis of hydraulic pressure control system
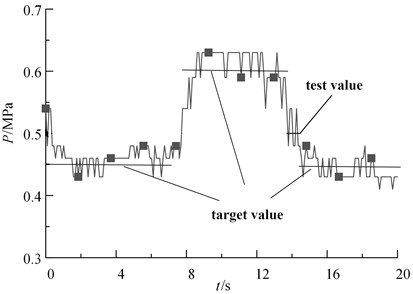
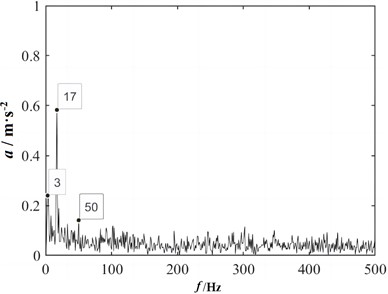
The pressure maintaining and control function of hydraulic braking system is the key factor affecting braking reliability. During the pressure maintaining process, it can store the oil compression, pipe expansion and elastic deformation of the machine. In case of pressure maintaining failure, when the pressure maintaining process is completed, the upper chamber pressure and stored energy have not been completely released, and the lower chamber pressure of the oil cylinder increases. In this way, the main valve cores of the unloading valve and the hydraulic control check valve are simultaneously jacked open, resulting in sudden oil leakage of the pressure slider in the upper chamber of the oil cylinder. The hydraulic system is subject to shock, vibration and noise due to large flow and too fast pressure release. When the reversing valve close to the oil cylinder leaks, the change rule of the brake pressure can be obtained, as shown in Fig. 12(a). It can be seen that the holding function of brake pressure fails, and obvious pressure relief problem occurs during the cycle time. The leakage of hydraulic valve depends on its structure and manufacturing accuracy. Therefore, the cone valve is much better at maintaining the pressure than the closed spool valve. In addition, the causes of leakage caused by factors related to manufacturing accuracy must be eliminated one by one, such as the machining accuracy and assembly accuracy of valve core and valve hole, and the sealing performance of sealing cone. Under the condition of pressure maintaining fault, the frequency spectrum response of the brake can be obtained as shown in Fig. 12(b). It can be seen that the pressure maintaining fault will significantly increase the friction vibration of the brake, and compared with the fault of the brake disc itself, the number of its characteristic frequencies is more, and it is easier to judge.
Fig. 12Pressure and vibration response curve under pressure maintaining fault condition
a) Pressure change curve
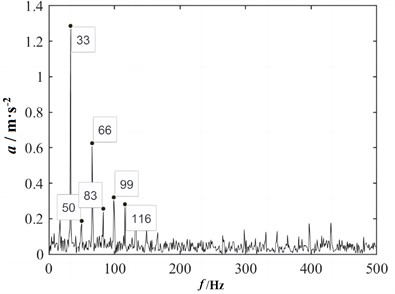
b) Frequency spectrum curve
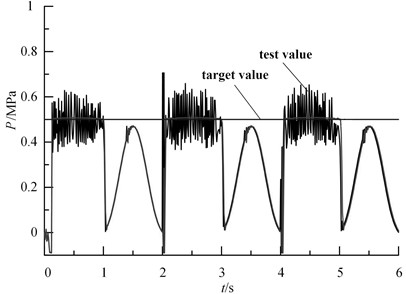
After replacing the faulty hydraulic valve, the working pressure of the hydraulic brake is adjusted and tested, and the pressure control curve is shown in Fig. 13(a). It can be seen that the linearity and retention of brake pressure control are significantly improved. At the same time, the friction vibration response results of the brake can be obtained, as shown in Fig. 13(b). It can be seen that when the hydraulic valve no longer leaks, the vibration response results are consistent with Fig. 8. This shows that when there is no fault in the hydraulic system, the influence of pressure change on vibration is small, so the interference of pressure change on fault detection is avoided. It also proves the feasibility of this research scheme to a certain extent.
Fig. 13Pressure and vibration response curve under normal pressure change condition
a) Pressure change curve
b) Frequency spectrum curve
5. Conclusions
With the development of intelligent vehicle technology, the requirements for vehicle braking stability and safety are getting higher and higher. As an effective fault diagnosis scheme, friction vibration signal is an important way to realize automatic detection of hydraulic braking system. In this paper, the vibration response under different fault conditions is tested and analyzed according to the fault inducement of the electronically controlled hydraulic brake system, and the following conclusions are drawn:
1) The wavelet threshold denoising method is proposed to preprocess the vibration signal, which effectively eliminates a large number of external vibration interference and the influence from complex working environment, and improves the signal to show a strong nonlinear and non-stationary problem. This method effectively reduces the influence of noise on vibration signal, improves the signal to noise ratio, helps to extract vibration features, reduces the interference of noise on signal waveform, and highlights the original vibration law of fault signal waveform.
2) When the hydraulic circuit works normally, the change of brake pressure will not affect the effect of vibration signal on fault diagnosis. The leakage fault of the hydraulic circuit is obviously different from the friction vibration signal caused by the wear problem of the brake disc itself. The vibration response data of different fault types under various working conditions can be input into the electronic control system as an effective basis for judging brake faults including micro cracks, excessive wear, fatigue peeling and other faults of the brake disc.
References
-
W. Zhang, C. Zhao, P. Chen, E. Chen, and T. Lei, “Numerical simulation and experimental research on mechanical behaviour of hydraulic disc brakes based on multi-body dynamics,” Scientific Reports, Vol. 12, No. 1, pp. 1–13, Nov. 2022, https://doi.org/10.1038/s41598-022-21960-4
-
R. Raveendran, K. Devika, and S. C. Subramanian, “Learning-based fault diagnosis of air brake system using wheel speed data,” Proceedings of the Institution of Mechanical Engineers, Part D: Journal of Automobile Engineering, Vol. 236, No. 12, pp. 2598–2609, Oct. 2022, https://doi.org/10.1177/09544070211063719
-
H. Wang, Z. Liu, D. Peng, M. Yang, and Y. Qin, “Feature-level attention-guided multitask CNN for fault diagnosis and working conditions identification of rolling bearing,” IEEE Transactions on Neural Networks and Learning Systems, Vol. 33, No. 9, pp. 4757–4769, Sep. 2022, https://doi.org/10.1109/tnnls.2021.3060494
-
A. L. Dias, R. D. N. Rodrigues, R. A. Bezerra, P. Lamary, and M. H. Miranda, “Light duty automotive drum brake squeal analysis using the finite-element method,” Proceedings of the Institution of Mechanical Engineers, Part L: Journal of Materials: Design and Applications, Vol. 235, No. 12, pp. 2797–2807, Dec. 2021, https://doi.org/10.1177/14644207211035991
-
Y. Q. Cao, “Wheel rail dynamic behavior of heavy-duty locomotive under unbalanced brake shoe pressure,” (in Chinese), Journal of Railway Science and Engineering, Vol. 17, No. 7, pp. 1808–1816, 2020, https://doi.org/10.19713/j.cnki.43-1423/u.t20190927
-
K. L. Zhang, “Research on wheel rail dynamic characteristics of heavy haul freight cars under unbalanced brake shoe braking force,” (in Chinese), Journal of Dynamics and Control, Vol. 18, No. 3, pp. 71–78, 2020.
-
D. Kolar, D. Lisjak, M. Pająk, and M. Gudlin, “Intelligent fault diagnosis of rotary machinery by convolutional neural network with automatic hyper-parameters tuning using Bayesian optimization,” Sensors, Vol. 21, No. 7, p. 2411, Mar. 2021, https://doi.org/10.3390/s21072411
-
Y. Shi, C. Yi, J. Lin, Z. Zhuang, and S. Lai, “Ensemble empirical mode decomposition-entropy and feature selection for pantograph fault diagnosis,” Journal of Vibration and Control, Vol. 26, No. 23-24, pp. 2230–2242, Dec. 2020, https://doi.org/10.1177/1077546320916628
-
P. Agrawal and P. Jayaswal, “Diagnosis and classifications of bearing faults using artificial neural network and support vector machine,” Journal of The Institution of Engineers (India): Series C, Vol. 101, No. 1, pp. 61–72, Feb. 2020, https://doi.org/10.1007/s40032-019-00519-9
-
M. Pająk, Muślewski, B. Landowski, T. Kałaczyński, M. Kluczyk, and D. Kolar, “Identification of Reliability States of a Ship Engine of the Type Sulzer 6AL20/24,” SAE International Journal of Engines, Vol. 15, No. 4, pp. 527–542, Nov. 2021, https://doi.org/10.4271/03-15-04-0028
-
M. Pipiska, M. Frivaldsky, M. Danko, and J. Sedo, “Electronically isolated measuring circuit for multicell traction battery modules identifying state of charge (SOC) values,” Elektronika ir Elektrotechnika, Vol. 25, No. 6, pp. 22–27, Dec. 2019, https://doi.org/10.5755/j01.eie.25.6.24822
-
A. L. Borodin, V. I. Vasiliev, and G. I. Maltseva, “Mathematical diagnostic model of brake master cylinder of hydraulic brake system of automobile,” in IOP Conference Series: Materials Science and Engineering, Vol. 1061, No. 1, p. 012011, Feb. 2021, https://doi.org/10.1088/1757-899x/1061/1/012011
-
X. D. Wu, “Experimental study on cross coupling sensitivity of a three-axis optical disk vibration sensor,” (in Chinese), Acoustics and Electronics Engineering, Vol. 22, No. 2, pp. 26–29, 2022.
-
G. Spencer, F. Mateus, P. Torres, R. Dionísio, and R. Martins, “Design of can bus communication interfaces for forestry machines,” Computers, Vol. 10, No. 11, p. 144, Nov. 2021, https://doi.org/10.3390/computers10110144
-
B. Yang and X. W. Ding, “Design of SPI bus communication in the multi-channel data acquisition systems,” in Advanced Materials Research, Vol. 532-533, No. 1, pp. 187–191, Jun. 2012, https://doi.org/10.4028/www.scientific.net/amr.532-533.187
-
C. Hu, F. Xing, S. Pan, R. Yuan, and Y. Lv, “Fault diagnosis of rolling bearings based on variational mode decomposition and genetic algorithm-optimized wavelet threshold denoising,” Machines, Vol. 10, No. 8, p. 649, Aug. 2022, https://doi.org/10.3390/machines10080649
-
S. A. Reju and N. A. Kgabi, “Wavelet analyses and comparative denoised signals of meteorological factors of the Namibian atmosphere,” Atmospheric Research, Vol. 213, No. 1, pp. 537–549, Nov. 2018, https://doi.org/10.1016/j.atmosres.2018.07.010
-
William Bekerman and Madhur Srivastava, “Determining decomposition levels for wavelet denoising using sparsity plot,” IEEE Access, Vol. 9, No. 9, pp. 582–591, 2021.
About this article

The paper is supported by Scientific Research Program of Qingdao Institute of Technology (2022KYJH013).
The datasets generated during and/or analyzed during the current study are available from the corresponding author on reasonable request.
The authors declare that they have no conflict of interest.
