Abstract
The working state of machinery can be reflected by vibration signals. Accurate classification of these vibration signals is helpful for the machinery fault diagnosis. A novel classification method for vibration signals, named Transform Domain Sparse Representation-based Classification (TDSRC), is proposed. The method achieves high classification accuracy by three steps. Firstly, time-domain vibration signals, including training samples and test samples, are transformed to another domain, e.g. frequency-domain, wavelet-domain etc. Then, the transform coefficients of the training samples are combined as a dictionary and the transform coefficients of the test samples are sparsely coded on the dictionary. Finally, the class label of the test samples is identified by their minimal reconstruction errors. Although the proposed method is very similar to the Sparse Representation-based Classification (SRC), experimental results illustrates its performance is far superior to SRC in the classification of vibration signals. These experiments include: frequency-domain classification of bearing vibration data from the Case Western Reserve University (CWRU) Bearing Data Center and wavelet-domain classification of six fault-types gearbox vibration data from our rotating machinery experimental platform.
1. Introduction
In the field of machinery fault diagnosis, vibration analysis is one of the most common and reliable methods [1]. It takes advantage of the advanced signal processing methods to extract fault information from raw vibration signals, which are collected by vibration sensors installed on the machinery, and then makes a diagnosis according to the fault information. In the past few decades, Fourier transform (FT) [2, 3] and wavelet transform (WT) [4, 5] were widely utilized in recognizing the fault feature frequencies of machinery equipment with lots of decent results. However, the feature frequency cannot be known in some cases for the difficulty in obtaining the rotating frequency or parameters of mechanical parts, which limits its broader application.
Classification-based fault diagnosis, as another method of vibration analysis, uses training samples to establish a diagnostic decision maker and determines the fault type of test samples according to the maker output, which avoids the calculation of fault feature frequencies. Frequently used classification methods in the field of fault diagnosis include linear discriminant analysis (LDA) [6], artificial neural network (ANN) [7] and support vector machine (SVM) [8, 9], etc. LDA, as a basic Fisher discriminant classifier, pursues a low degree of coupling between classes and a high degree of polymerization within class. ANN realizes nonlinear mapping between symptoms and faults. SVM, as another linear classifier, is a machine learning method based on statistical learning theory, and produces a favorable generalization performance. In addition, the classification method for time-domain parameters and fuzzy logic classification techniques [10] were also used well in the area of fault diagnosis.
In recent years, a new classification technique, i.e. sparse representation based classification (SRC), has been proposed in the field of pattern recognition [11, 12]. Its basic principle is to sparse code a test sample over a dictionary and then to perform the classification based on the reconstruction error. Since its appearance, SRC and its variants have been widely applied in face recognition [13, 14], EEG signal classification [15] and music genre classification [16] etc. In the field of fault diagnosis, SRC is rarely studied. A typical application appeared with a good result in [17], where compressive sensing theory was implied to reduce the dimension of original vibration signals and SRC was used to classify the low- dimensional signals.
In this paper, on the basis of SRC, we propose a new classification method for machinery vibration signals, named Transform Domain Sparse Representation-based Classification (TDSRC). In TDSRC, the dictionary for sparse representation is not constructed with raw samples, but constructed with the transformation coefficients of the raw samples. This provides a new idea that classification can be performed using sample variations in the transform domain
The idea comes from the fact that machinery vibration signals of different fault-types show significant differences in transform domain. Compared to previous studies, the method of TDSRC makes better use of the global differences between different sample classes. The results of two experiments demonstrate that the classification performance of the proposed method, i.e. classification accuracy, sparsity concentration index [12] and noise immunity, is better than that of SRC and conventional SVM.
The remainder of the paper is organized as follows. In Section 2, the basic idea of SRC and its variants are reviewed. Section 3 presents the proposed method TDSRC. Two experiments are provided to verify the proposed method in Section 4. Finally, Section 5 concludes the paper.
2. Sparse representation-based classification (SRC) and its variants
Suppose is a training dataset as the concatenation of training samples of all object classes, and is the sub-set of the training samples from class . For a test sample from class , generally it can be well approximated as the linear combination of the samples from [12, 18]:
where is the coding vector. Since the membership of the test sample is initially unknown, the linear representation of can be written in terms of all training samples as , where:
In SRC [10], L1-norm minimization is used to sparsely code on , i.e.:
where is a scalar constant. Then classification is done via:
where , and is the coefficient vector associated with class . Moreover, other sparse optimization criterions were recently utilized in classification issue. For example, L2-norm minimization, named Collaborative Representation (CR), proposed by Zhang et al. [13] solves the coding vector by:
L1-norm combining with L2-norm minimization, named Class Specific Sparse Representation (CSSR), was presented by Huang et al. [19] formulated as:
and classification is made by:
where .
3. Transform domain sparse representation-based classification (TDSRC)
In section 2, it can be seen that there are two phases in SRC: Sparse coding and classification. In the coding phase, training samples are combined together as a dictionary. In recent years, lots of methods for constructing dictionary have appeared, such as FDDL [18], JDDLDR [20] and DKSVD [21] etc. These methods have one thing in common: the dictionary is constructed by a learning algorithm to improve its discrimination ability as much as possible. Although the dictionary is updated in each iteration, it keeps in the same domain as training samples. It is well known that machinery vibration signal is noisy and non-stationary, which means that its many statistics are time-varying. Therefore, even if different vibration signals are of the same fault-type, they will show significant differences in time-domain waveform. However, they have many nearly the same statistics in transform domain. For example, bearing vibration signals of the same fault-type have almost the same dominate frequencies in frequency-domain, and gear vibration signals of the same fault-type almost have the same wavelet coefficients in wavelet-domain.
Table 1Algorithm of TDSRC
Input: a matrix of training samples for classes, a test sample , a transformation , a maximum transform scale and a scalar constant |
Step 1: For every training sample , perform to obtain a coefficient matrix , whose columns are the transform coefficient vectors of from scale 1 to . The same as the test sample , perform to obtain a coefficient matrix |
Step 2: For |
Step 2.1: Let dictionary , where denotes the th column vector of , i.e. the transform coefficient vector of at scale |
Step 2.2: Normalize the columns of to have unit L2-norm; where and are the sub-dictionary of and sub-vector of associated with class respectively, and they meet and |
Output: |
Based on the above considerations, in the proposed method, i.e. TDSRC, the vibration signals, including training samples and test samples, are transformed to another domain at first; then, sparse representation-based classification is performed in the transform domain. The algorithm of TDSRC is summarized in Table 1. It needs three steps to finish the algorithm. In the first step, all the samples, including training samples and test samples, are transformed into another domain. In the second step, the transform coefficients of the training samples are combined as a dictionary and the transform coefficients of the test samples are sparsely coded on the dictionary. In the final step, the class label of the test samples is identified by their minimal reconstruction errors. In Table 1, if the type of transformation is specified as Fourier-transform, the input parameter represents the points of discrete Fourier transform (DFT) and the coefficients matrix degenerates into a vector composed of DFT coefficients; and if wavelet-transform (WT) is used, the wavelet name must be given and is composed of WT coefficient vectors with different length.
Step 2.3: Solve the L1-minimization problem:
where is the th column vector of , i.e. the transform coefficient vector of at scale ;
Step 2.4: Compute the residuals:
End for Step 3: Compute the summation residuals:
4. Experimental verification
To investigate the performances of the proposed TDSRC method for vibration signal classification, two experimental cases, i.e. bearing vibration signals and gearbox vibration signals, are considered in this section.
4.1. Bearing vibration signal classification
The bearing vibration data were downloaded from the Case Western Reserve University Bearing Data Center [22]. The experimental platform shown in Fig. 1 consists of a motor, control electronics, a torque transducer, and a dynamometer. Single point faults of size 0.007, 0.014, 0.021 and 0.028 in. were set on the drive-end bearings (Type 6205-2RS JEM SKF) at the location of outer raceway, inner raceway and rolling element (ball), respectively. The vibration data were measured by using an accelerometer being attached to the motor housing with the sampling frequency of 12 kHz.
Fig. 1Bearing test rig of CWRU [22]
![Bearing test rig of CWRU [22]](https://static-01.extrica.com/articles/18865/18865-img1.jpg)
In the preprocessing stage, twelve fault-types of vibration data samples were chosen to construct training and testing datasets, including a normal, three types of outer race fault, four types of inner race fault, and four types of ball fault. Each sample was split with an overlapping length of 128-point into lots of segments, whose length were set to 2048-point. A total of over 80 segments can be obtained. Taking into account the influence of sample size, the number of training samples must be large enough to build the dictionary for sparse decomposition. Therefore, we randomly selected more than 60 segments as training samples and other 20 ones as testing samples. The descriptions of the bearing datasets are shown in Table 2.
Table 2Description of bearing dataset for classification
Fault type | Data file | Number of training/testing samples | Label of class |
Normal | Normal_3 | 60/20 | N |
Outer-race | OR007@6_3 | 60/20 | O-I |
Outer-race | OR014@6_3 | 60/20 | O-II |
Outer-race | OR021@6_3 | 60/20 | O-III |
Inner-race | IR007_3 | 60/20 | I-I |
Inner-race | IR014_3 | 60/20 | I-II |
Inner-race | IR021_3 | 60/20 | I-III |
Inner-race | IR028_3 | 60/20 | I-IV |
Ball | B007_3 | 60/20 | B-I |
Ball | B014_3 | 60/20 | B-II |
Ball | B021_3 | 60/20 | B-III |
Ball | B028_3 | 60/20 | B-Ⅳ |
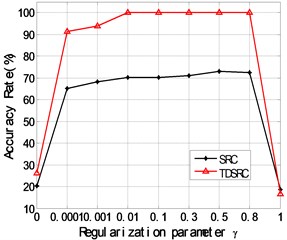
In the implementation of TDSRC, all the samples, including 720 (60×12) training and 240 (20×12) testing ones, are transformed into frequency-domain by Fast Fourier Transform (FFT) at first. Then, the scalar constant is set to 0.5 and SLEP [23] method is utilized for solving L1-minimization problems. With the changes of FFT points, the classification accuracy rate is plotted in Fig. 2. It can be seen that the accuracy rate is improved significantly with the increase of FFT points. Fig. 3 shows the relationship between the classification accuracy rates,obtained respectively by TDSRC and SRC,and the scalar constant with the FFT points of 2048, which demonstrates that both of them almost keep unchanged with high values when the parameter varies in [0.0001, 0.8], while drop sharply if approaches to 0 or 1. At the same time, it is verified that the classification performance of TDSRC is superior to that of SRC for the bearing dataset.
Fig. 2The relationship between the classification accuracy rate and FFT points for the bearing dataset
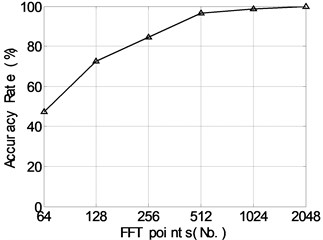
Fig. 3The relationship between the classification accuracy rates obtained respectively by TDSRC and SRC and the scalar constant γ for the bearing dataset
4.2. Gearbox vibration signals classification
The proposed TDSRC method is further applied in gearbox fault diagnosis. The experimental platform (Fig. 4) consists of a motor, a drive shaft seat, a magnetic particle torque converter and a gearbox, etc. The vibration signals are acquired by an acceleration sensor placed in the output shaft bearing seat. A normal situation and five fault-ones, including three single faults, i.e. tooth-broken and point-corrosion of large gear, wear-out of small gear, and two combination faults, i.e. broken-wear and point-wear faults, are considered. Rotating speed is set to 1500 r/min, and vibration signals of the horizontal direct are collected with a sampling frequency of 5120 Hz and the sampling time is 10.5 s in each situation.
Like the experiment of bearing data classification, in the preprocessing stage, each of the six gearing vibration signals is split with an overlapping length of 128-point into lots of segments, whose length are set to 1024-point. A total of over 70 segments can be obtained. From them, we randomly select more than 50 ones as training samples to build the dictionary and other 20 ones as testing samples. The descriptions of the gearbox datasets are shown in Table 3.
Fig. 4The gearbox experimental system
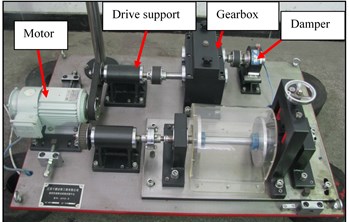
Table 3Description of gearbox dataset for classification
Fault type | Number of training/testing samples | Label of class |
Normal | 50/20 | N |
Tooth-broken in large gear | 50/20 | TBL |
Point-corrosion in large gear | 50/20 | PCL |
Wear-out in small gear | 50/20 | WOS |
Tooth-broken in large gear and wear-out in small gear | 50/20 | TBL-WOS |
Point-corrosion in large gear and wear-out in small gear | 50/20 | PCL-WOS |
It is well known that wavelet transform (WT) has perfect local properties in both time and frequency spaces. However, WT does not split the high frequency bands. Wavelet packets transform (WPT) [24] further decomposes the high frequency part which is not decomposed in WT. Since the modulation information of machine fault always exists in the high frequency bands, in this respect, WPT has a better representation of fault signal [25]. Therefore, all the samples, including 300 (50×6) training and 120 (20×6) testing ones, are transformed into wavelet-domain by WPT at first. Then, the scalar constant is set to 0.5 and TDSRC is implemented. The classification accuracy rate is shown in Fig. 5. The results indicate: 1) as the decomposition depth increases, all of the classification accuracy rates increase at first and then decrease; 2) in the four wavelet packets (‘db1’, ‘coif1’, ’dmey’ and ’sym2’), ‘sym2’ has the highest accuracy, reaching to 95.3 % when the transform depth is 4. To be clear, their accuracy rates are only 27.4 % at the transform depth of 0 for the four wavelet packets, which means that WPT is not conducted and SRC is directly implemented to classify the 120 testing samples. Therefore, SRC in wavelet-domain can significantly improve the accuracy of fault diagnosis for gearbox.
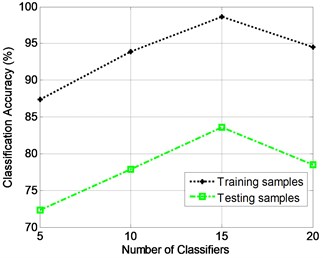
For comparison, the gearbox dataset is tested by SVM method. SVM is a pattern recognition classification algorithm based on statistical learning theory and originally designed for binary classification. Fault diagnosis is a multi-classification problem, thus multi-classification SVM should be constructed. Modeled on reference [26], the gearbox dataset, including 300 training samples and 120 testing ones, are translated into different frequency bands by WPT at first; then, the optimal features are selected based on the distance evaluation technique from the statistical characteristics of raw signals and wavelet package coefficients, and the energy characteristics of decomposition frequency band; finally, the optimal features are input a multi-classification SVM with SVM toolbox [27] to classify these samples. The relationship between classification accuracy and number of classifiers is plotted in Fig. 6, which demonstrates that the classification performance is not as high as that of the proposed TDSRC method for gearbox dataset.
Fig. 5The relationship between the classification accuracy rate and decomposition depth for the gearbox dataset
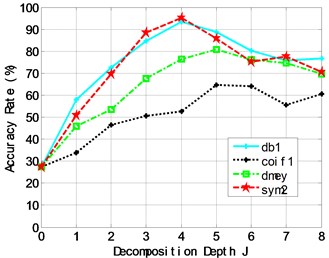
Fig. 6The relationship between the classification accuracy and the number of classifiers for the gearbox dataset
4.3. Discussion
In the two experiments above, Fourier transform and Wavelet packets transform were implemented respectively before classification. It is vital to choose a proper transformation for the classification accuracy. In the diagnosis experiment of bearing, FT was chosen because the distribution of Fourier coefficients is obviously different when the bearing is in different faults. In the gearbox experiment, however, WPT was implemented to get WPCs of different frequency bands for their difference of energy distribution when the gearbox is in different faults. Therefore, it needs to get a thorough knowledge of coefficients distribution of the classification objects in the transform domain before implementation of TDSRC.
In addition to the choice of transformation, these parameters have also some influence on classification accuracy, such as the number of FFT points, the scalar constant, the decomposition depth of WPT and the number of training samples. The influence results of the first three parameters have been shown respectively in Fig. 2, Fig. 3 and Fig. 5. Considering the influence of the number of training samples, we selected different numbers of training samples to construct the dictionary for spare decomposition, and selected other 20 samples of each fault type for test. The classification accuracy rates of the bearing dataset and the gearbox dataset are shown in Fig. 7.
Fig. 7The relationship between the classification accuracy and the number of training samples
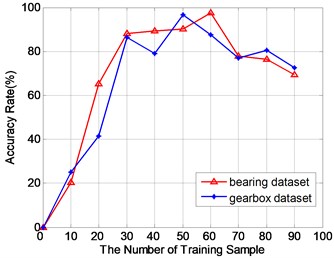
It can be seen that both of them increase at first and then decrease. For the bearing dataset, the highest accuracy reaches to 98.4 % when the number of training samples is 60. For the gearbox dataset, the highest accuracy gets to 96.1 % when the numbers of training samples are 50. Therefore, the number of training samples must be appropriate. The information of constructed dictionary is incomplete when the number is too small. On the other hand, redundant information will be generated if the number is too large.
5. Conclusions
This paper presents a new classification method for machinery vibration signals, named Transform-domain Sparse Representation based Classification (TDSRC). It provides a new idea that classification can be performed using sample variations in the transform domain, which greatly improves the flexibility of sample classification. The method leverages the fact that machinery vibration signals possess sparse nonzero values in transform-domain and their transform coefficients are significantly different with each other when different fault occurs. The experimental results of bearing and gearbox vibration signals demonstrate the method can effectively diagnose both of them fault types with a higher accuracy than that of SRC and SVM.
References
-
Harris F. J. Rolling Bearing Analysis II. John Wiley, New York, 2000.
-
Li Bo, Mo Yuen Chow, Yodyium Tipsuwan, et al. Neural-network-based motor rolling bearing fault diagnosis. IEEE Transactions on Industrial Electronics, Vol. 47, Issue 5, 2000, p. 1060-1069.
-
Antoni J. Cyclic spectral analysis of rolling-element bearing signals: facts and fictions. Journal of Sound and Vibration, Vol. 304, 2007, p. 497-529.
-
Hai Qiu, Jay Lee, Jing Lin, et al. Wavelet filter-based weak signature detection method and its application on rolling element bearing prognostics. Journal of Sound and Vibration, Vol. 289, 2006, p. 1066-1090.
-
Ruqiang Yan, Robert Gao X., Xuefeng Chen Wavelets for fault diagnosis of rotary machines: a review with applications. Signal Processing, Vol. 96, 2014, p. 1-15.
-
Haining Liu, Chengliang Liu, Yixiang Huang Adaptive feature extraction using sparse coding for machinery fault diagnosis. Mechanical Systems and Signal Processing, Vol. 25, 2011, p. 558-574.
-
Rafiee J., Tse P. W., Harifi A., et al. A novel technique for selecting mother wavelet function using an intelligent fault diagnosis system. Expert Systems with Applications, Vol. 36, 2009, p. 4862-4875.
-
Cristianini N., Shawe Taylor J. An Introduction to Support Vector Machines and Other Kernel-based Learning Methods. Cambridge University Press, Cambridge, UK, 2000.
-
Zhiquan Qi, Yingjie Tian, Yong Shi Robust twin support vector machine for pattern classification. Pattern Recognition, Vol. 46, 2013, p. 305-316.
-
Pająk Michał, Muślewski Łukasz, Landowski Bogdan, Grządziela Andrzej Rotating systems misalignment identification using fuzzy clustering method. Vibroengineering Procedia, Vol. 7, 2016, p. 70-75.
-
Huang K., Aviyente S. Sparse representation for signal classification. Advances in Neural Information Processing Systems, Vol. 19, 2006, p. 609-616.
-
John Wright, Allen Yang Y., Arvind Ganesh, et al. Robust face recognition via sparse representation. EEE Transactions on Pattern Analysis and Machine Intelligence, Vol. 31, Issue 2, 2009, p. 210-227.
-
Zhang D., Yang M., Feng X. Sparse representation or collaborative representation: which helps face recognition? IEEE International Conference on Computer Vision (ICCV), 2011, p. 471-478.
-
Xin Zhang, Duc Son Pham, Svetha Venkatesh, et al. Mixed-norm sparse representation for multi view face recognition. Pattern Recognition, Vol. 48, 2015, p. 2935-2946.
-
Younghak Shin, Seungchan Lee, Minkyu Ahn, et al. Noise robustness analysis of sparse representation based classification method for non-stationary EEG signal classification. Biomedical Signal Processing and Control, Vol. 21, 2015, p. 8-18.
-
Banitalebi Dehkordi M., Banitalebi Dehkordi A. Music genre classification using spectral analysis and sparse representation of the signals. Journal of Signal Process System, Vol. 74, 2014, p. 273-280.
-
Tang G., Qin Yang, Hua Qing Wang, et al. Sparse classification of rotating machinery faults based on compressive sensing strategy. Mechatronics, Vol. 31, 2015, p. 60-67.
-
Meng Yang, Lei Zhang, Xiangchu Feng, et al. Sparse representation based fisher discrimination dictionary learning for image classification. International Journal Computer Visual, Vol. 109, 2014, p. 209-232.
-
Sheng Huang, Yu Yang, Dan Yang, et al. Class specific sparse representation for classification. Signal Processing, Vol. 116, 2015, p. 38-42.
-
Feng Z., Yang M., Zhang L., et al. Joint discriminative dimensionality reduction and dictionary learning for face recognition. Pattern Recognition, Vol. 46, Issue 8, 2013, p. 2134-2143.
-
Hao Zheng, Dapeng Tao Discriminative dictionary learning via Fisher discrimination K-SVD Algorithm. Neurocomputing, Vol. 162, Issue 25, 2015, p. 9-15.
-
Case Western Reserve University Bearing Data Center Website. http://csegroups.case.edu/bearingdatacenter/home.
-
Liu J., Ji S., Ye J. SLEP: Sparse Learning with Efficient Projections. Arizona State University, 2009
-
Qingbo He Vibration signal classification by wavelet packet energy flow manifold learning. Journal of Sound and Vibration, Vol. 332, 2013, p. 1881-1894.
-
Yi Wang, Guanghua Xu, Lin Liang, et al. Detection of weak transient signals based on wavelet packet transform and manifold learning for rolling element bearing fault diagnosis. Mechanical Systems and Signal Processing, Vol. 54, 2015, p. 259-276.
-
Qiao Hu, Zhengjia He, Zhousuo Zhang, et al. Fault diagnosis of rotating machinery based on improved wavelet package transform and SVMs ensemble. Mechanical Systems and Signal Processing, Vol. 21, 2007, p. 688-705.
-
Chang C. C., Lin C. J. LIBSVM: a Library for Support Vector Machines. 2001., http://ntucsu.csie.ntu.edu.tw/~cjlin/libsvm/.
Cited by
About this article

This work is partially supported by the National Natural Science Foundation of China (No. 61174106) and the Key Scientific Research Project of Henan Education Department (No. 18B510020).
