Abstract
The current research investigates the prediction of piezoelectric damping of resistively shunted beams caused by resistors via joule heating. In order to maximize the extra damping of the piezoelectric shunted beam system, a sensitivity analysis was done. The geometrical impacts on the maximum additional damping simulation are investigated for different length and thickness ratios with the position of the PZT-5H from the base of the cantilever and simply supported beams. Prior to doing sensitivity analysis, a mathematical model for estimating extra damping from voltage produced. Validation experiments are also carried out.
Highlights
- The current research investigates the prediction of piezoelectric damping of resistively shunted beams caused by resistors via joule heating, In order to maximize the extra damping of the piezoelectric shunted beam system, a sensitivity analysis was done.
- The geometrical impacts on the maximum additional damping simulation are investigated for different length and thickness ratios with the position of the PZT-5H from the base of the cantilever and simply supported beams.
- A mathematical model for estimating extra damping from voltage produced. Validation experiments are also carried out.
- Experiments are also conducted on a beam and compared with the derived analytical model, results correlate and a analytical model based on the voltage generation method.
- To optimize the geometry of the cantilever shunted structure for maximum added damping is estimated.
1. Introduction
In recent years, the use of smart materials-related technology in vibration control has become an alternative to a traditional vibration control technique. The vibration reduction is facilitated by using a piezoceramic patch attached to an electrical shunt network. The Lead Zirconium-Titanate (PZT), a piezoceramic material, converts mechanical energy into electrical energy and vice-versa. Since the first experimental demonstration and model proposed by Hagood et al. [1], to describe the damping capacity of piezoceramic material is based on the change of stiffness of a PZT, stiffness varies with short to open circuit. The loss factor due to shunting of the piezo was found from complex modulus and the damping behaviour of piezo material was considered similar to viscoelastic material. The shunted damping mainly depends upon the generalized electro mechanical coefficient . It is the function of open, shorted frequencies. Implicitly depending on the open and short stiffness of the structure. The resulting change in resonance frequencies is 0.65 % from short to open and validation was done for the only first mode of vibration experimentally. Davis et al. [2], developed the strain energy approach to the prediction of resistively shunted piezoceramic damping. Two sets of experiments address the ability to predict the added damping for 2nd, 3rd and 4th modes, but do not accurately predict the magnitude of added damping due to shunting of PZTs at strain nodal positions. S. M. Yang et al. [3] and Y. J. Lee et al. [4] investigated added damping due to PZT considering inertia and stiffness of the surface-bonded piezoelectric materials. The model includes the effect of actuation in close circuit conditions including shear and rotary inertia and generalized stiffness due to PZT being either positive or negative. N. W. Hagood et al. [5] modelled the effect of dynamic coupling between a structure and electrical network through the piezo effect by using the Hamilton principle and validated it experimentally on an actively controlled cantilever beam with voltage drive. E. H. Anderson et al. [6] have developed a general analysis technique for coupled structures and piezo analysis of simultaneous sensing and actuation.
Optimization for maximizing the strain induced in the substance was first addressed by Anderson et al. [7] and Kim et al. [8]. They specially considered two kinds of material, i.e., steel and aluminium, and showed that there is an optimal thickness of surface-bonded piezoelectric actuators that approaches half of the plate thickness for steel and a quarter of the plate thickness for steel. They did not consider the effect of inertial loads on the optimal parameters. Chaudhary et al. [9] considered inertial and external loads considered the optimization of thickness for simply supported beams. S. B. Kandagal et al. [12] investigated different modeshapes, it is shown that additive damping for a given beam length to PZT length ratio, is maximum for beam thickness to PZT thickness ratio equal to 2.73. This optimal thickness ration is valid for all modes of vibration and all boundary conditions of the beam. S. B. Kandagal et al. [13] investigated vibration amplitude reduction of the order of 23 to 30 percentage respectively. The studies on added damping due to resistive shunting on a beam indicated the fact that electro mechanical coupling coefficient is an important parameter. Higher values of ensures better added damping and larger percentage change in natural frequency. Liao et al. [14] identified that for resistively shunted systems with large electromechanical coupling, the optimal resistance for maximum power dissipation and damping will be chaotic. For the maximum damping in the resistive shunt system, Sodono et al. [15] found that thickness ratio and modulus ratio of substrate and piezoelectric materials are function of maximum resistive shunt damping.
In this study, the voltage generation at the open circuit and added-damping for the shunted PZT bonded on beam are estimated based on the modifications to the method proposed by Hagood. The modified analytical model is changed from uniform mode shape to stepped beam configuration by using the assumed mode (AM) method by Maurini et al. [10]. A approach to predict the added damping by energy dissipation model. Results are validated experimentally. Previous analysis were done only on thickness and length ratios for maximum added damping. Present investigated simulations on sensitive analysis are performed using MATLAB software for thickness, length and position ratios, studied effect on added damping for cantilever and simply supported beams. The relationship between the base damping and added damping properties is not studied. Optimizing the geometry for maximizing the added damping considered inertia PZT for cantilever and simply supported beam.
2. Equation of motion of a cantilever beam attached with piezo
2.1. Modeling of voltage generation across piezoceramic
Fig. 1 shows a cantilever beam structure with PZT patch. Bending deformation of the beam is considered and shear and rotation deformations are ignored. During vibration, the structure length (), Modulus of elasticity (C), Poisson ratio , structural damping is assumed constant and independent of vibration amplitude. The equation of motion for the piezoceramic coupled electro mechanical system and voltage generation across PZT can be derived from the procedure followed by Hagood et al. [5]:
where is the potential energy, is the kinetic energy, is the electrical energy and is the external work applied to the system, is the strain, is stress, is the electric field, is a vector of electrical displacement, is the volume, is the vector of mechanical displacement, is the vector of applied forces at and is applied charge, is the density and subscripts and , represent the piezoelectric material and base substance, respectively. The linear constitutive relations of the piezoelectric to be introduced into the potential energy term and the variation of both the potential and kinetic energy must be found:
where is the dielectric constant and the superscript ‘’, signifies the parameter was measured at constant strain and the superscript ‘’, indicates the parameter was measured at the constant electric field (short circuit). These constitutive equations relate to the electrical and mechanical properties of the piezoelectric element. The specifications of these relationships will allow electromechanical interaction to be included in the model. The term ‘’ is the piezoelectric coupling coefficient and relates the stress to the applied electric field. The piezoelectric material constant can be written as shown in Eq. (6) in terms of the more commonly specified coupling coefficient by:
where is the piezoelectric coupling coefficient with the subscript and referring to the direction of the applied field and the poling respectively. The piezoelectric properties are incorporated in the variation equation. This equation can now be used to solve for the equations of motion of any mechanical system containing piezoelectric elements. The Rayleigh-Ritz procedure is used to solve Eq. (1), where displacement of the beam can be written as the summation of modes in the beam and a temporal coordinate:
where is the assumed mode shapes of the structure which can be set to satisfy any combination of boundary conditions, is the temporal coordinate of the displacement and is the number of modes to be included in the analysis.
Fig. 1The cantilever beam attached to a piezo
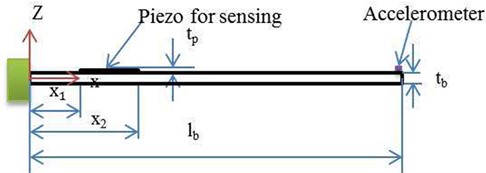
Fig. 2Euler-Bernoulli beam
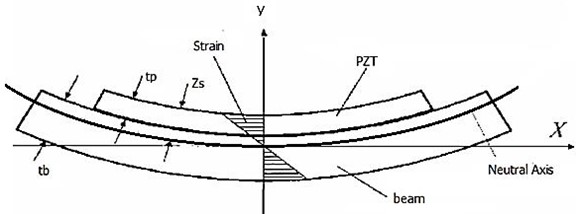
The Euler-Bernoulli beam theory allows the strain in the beam to be written as the product of the distance from the neutral axis and the second derivative of displacement for position along the beam:
where is the differential operator for the particular elastic problem. The electric potential across the piezoelectric element is assumed as indicating that no field is applied to the beam:
where is the assumed electric potential, is the voltage across the PZT:
Substituting Eqs. (6), (9), (10) in Eq. (2), (3), (4), (5) and integrating by parts in time and allowing arbitrary variations of and , adding the damping term in governing differential equation of motion:
Eqs. (13), (14) are called actuator and sensor equations, where , , , and are the mass and stiffness for structure and piezoelectric is a clamped capacitance, and is the coupled matrix:
The stiffness matrix can be written as:
The electromechanical coupling matrix and capacitance matrix are defined as:
In a cantilever beam the forcing function used to model the inertia of the beam is:
where is base excitation amplitude and is forcing frequency at open conditions. The voltage at the piezoelectric electrodes is measured when the applied charge is zero, 0 in Eq. (14), which yields:
Eq. (22) is substituted in Eq. (13):
where is dynamic stiffness from PZT, the amount of stiffness added to the electro mechanical coupling. For PZT attached at one side of the beam, Eq. (19), and is the temporal coordinate of the displacement is substituted in Eq. (22) to get:
is the distance between shifted neutral axis to the PZT surface as shown in Fig. 2. If PZT is attached on both the sides of the beam and the electromechanical coupling, is defined as:
And Voltage to be:
2.2. Estimating the energy dissipation and added damping
Fig. 3. shows an equivalent circuit for PZT and connected to the load resistor. Mechanical energy is converted to strain energy, and in turn, into electrical energy, and is dissipated via joule heating. Energy dissipated by the resistor per cycle is estimated, as stated by author Law et al. [11].
Fig. 3Equivalent circuit
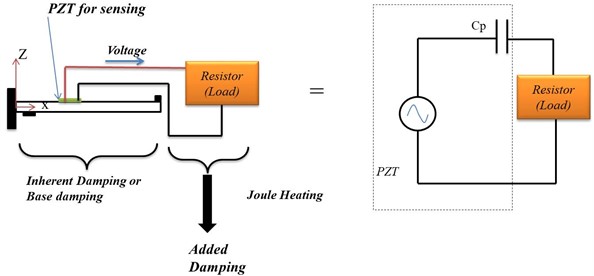
The impedance of the capacitor, The total impedance of the circuit, Current in the circuit, Voltage across the resistor:
Power dissipated across the resistor , here is complex conjugate.
The energy dissipated by the resistor per cycle is:
The equivalent added damping ratio can be determined through this energy dissipation relationship:
where is beam maximum temporal displacement can be determined by solving the above equation in a steady state condition. By simplification of Equations, added damping ratio, :
Above equation when PZT is attached at one side of the beam, if pairs of PZT are attached on the beam:
Differentiating Eq. (32) with respective to obtain an expression for optimal resistor for maximum added damping is:
2.3. Verification based on literature data for added damping
The accuracy of the model to predict generated voltage across the piezoceramic material and added damping due to shunt was compared with available data in the literature. Experimental results and analytical results verified the ability of the model to accurately predict the added damping when subjected to transverse vibration. Stepped beam configuration also considered for simulating analysis.
Fig. 4Cantilever beam 1st shunted resistance showing experimental results (b), compared to the prediction of Hagood proposed model (a), and energy dissipation method (c)
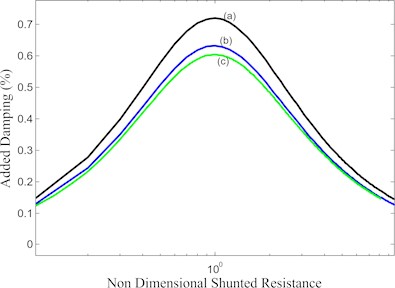
The voltage generation model is verified for the first mode from experimental work by Hagood. [1], Hagood’s proposed model is compared in Fig. 4. The experimentally added damping is close to the analytical energy dissipation model for the first mode.
3. Validation of model to predict added damping by experiments on beams
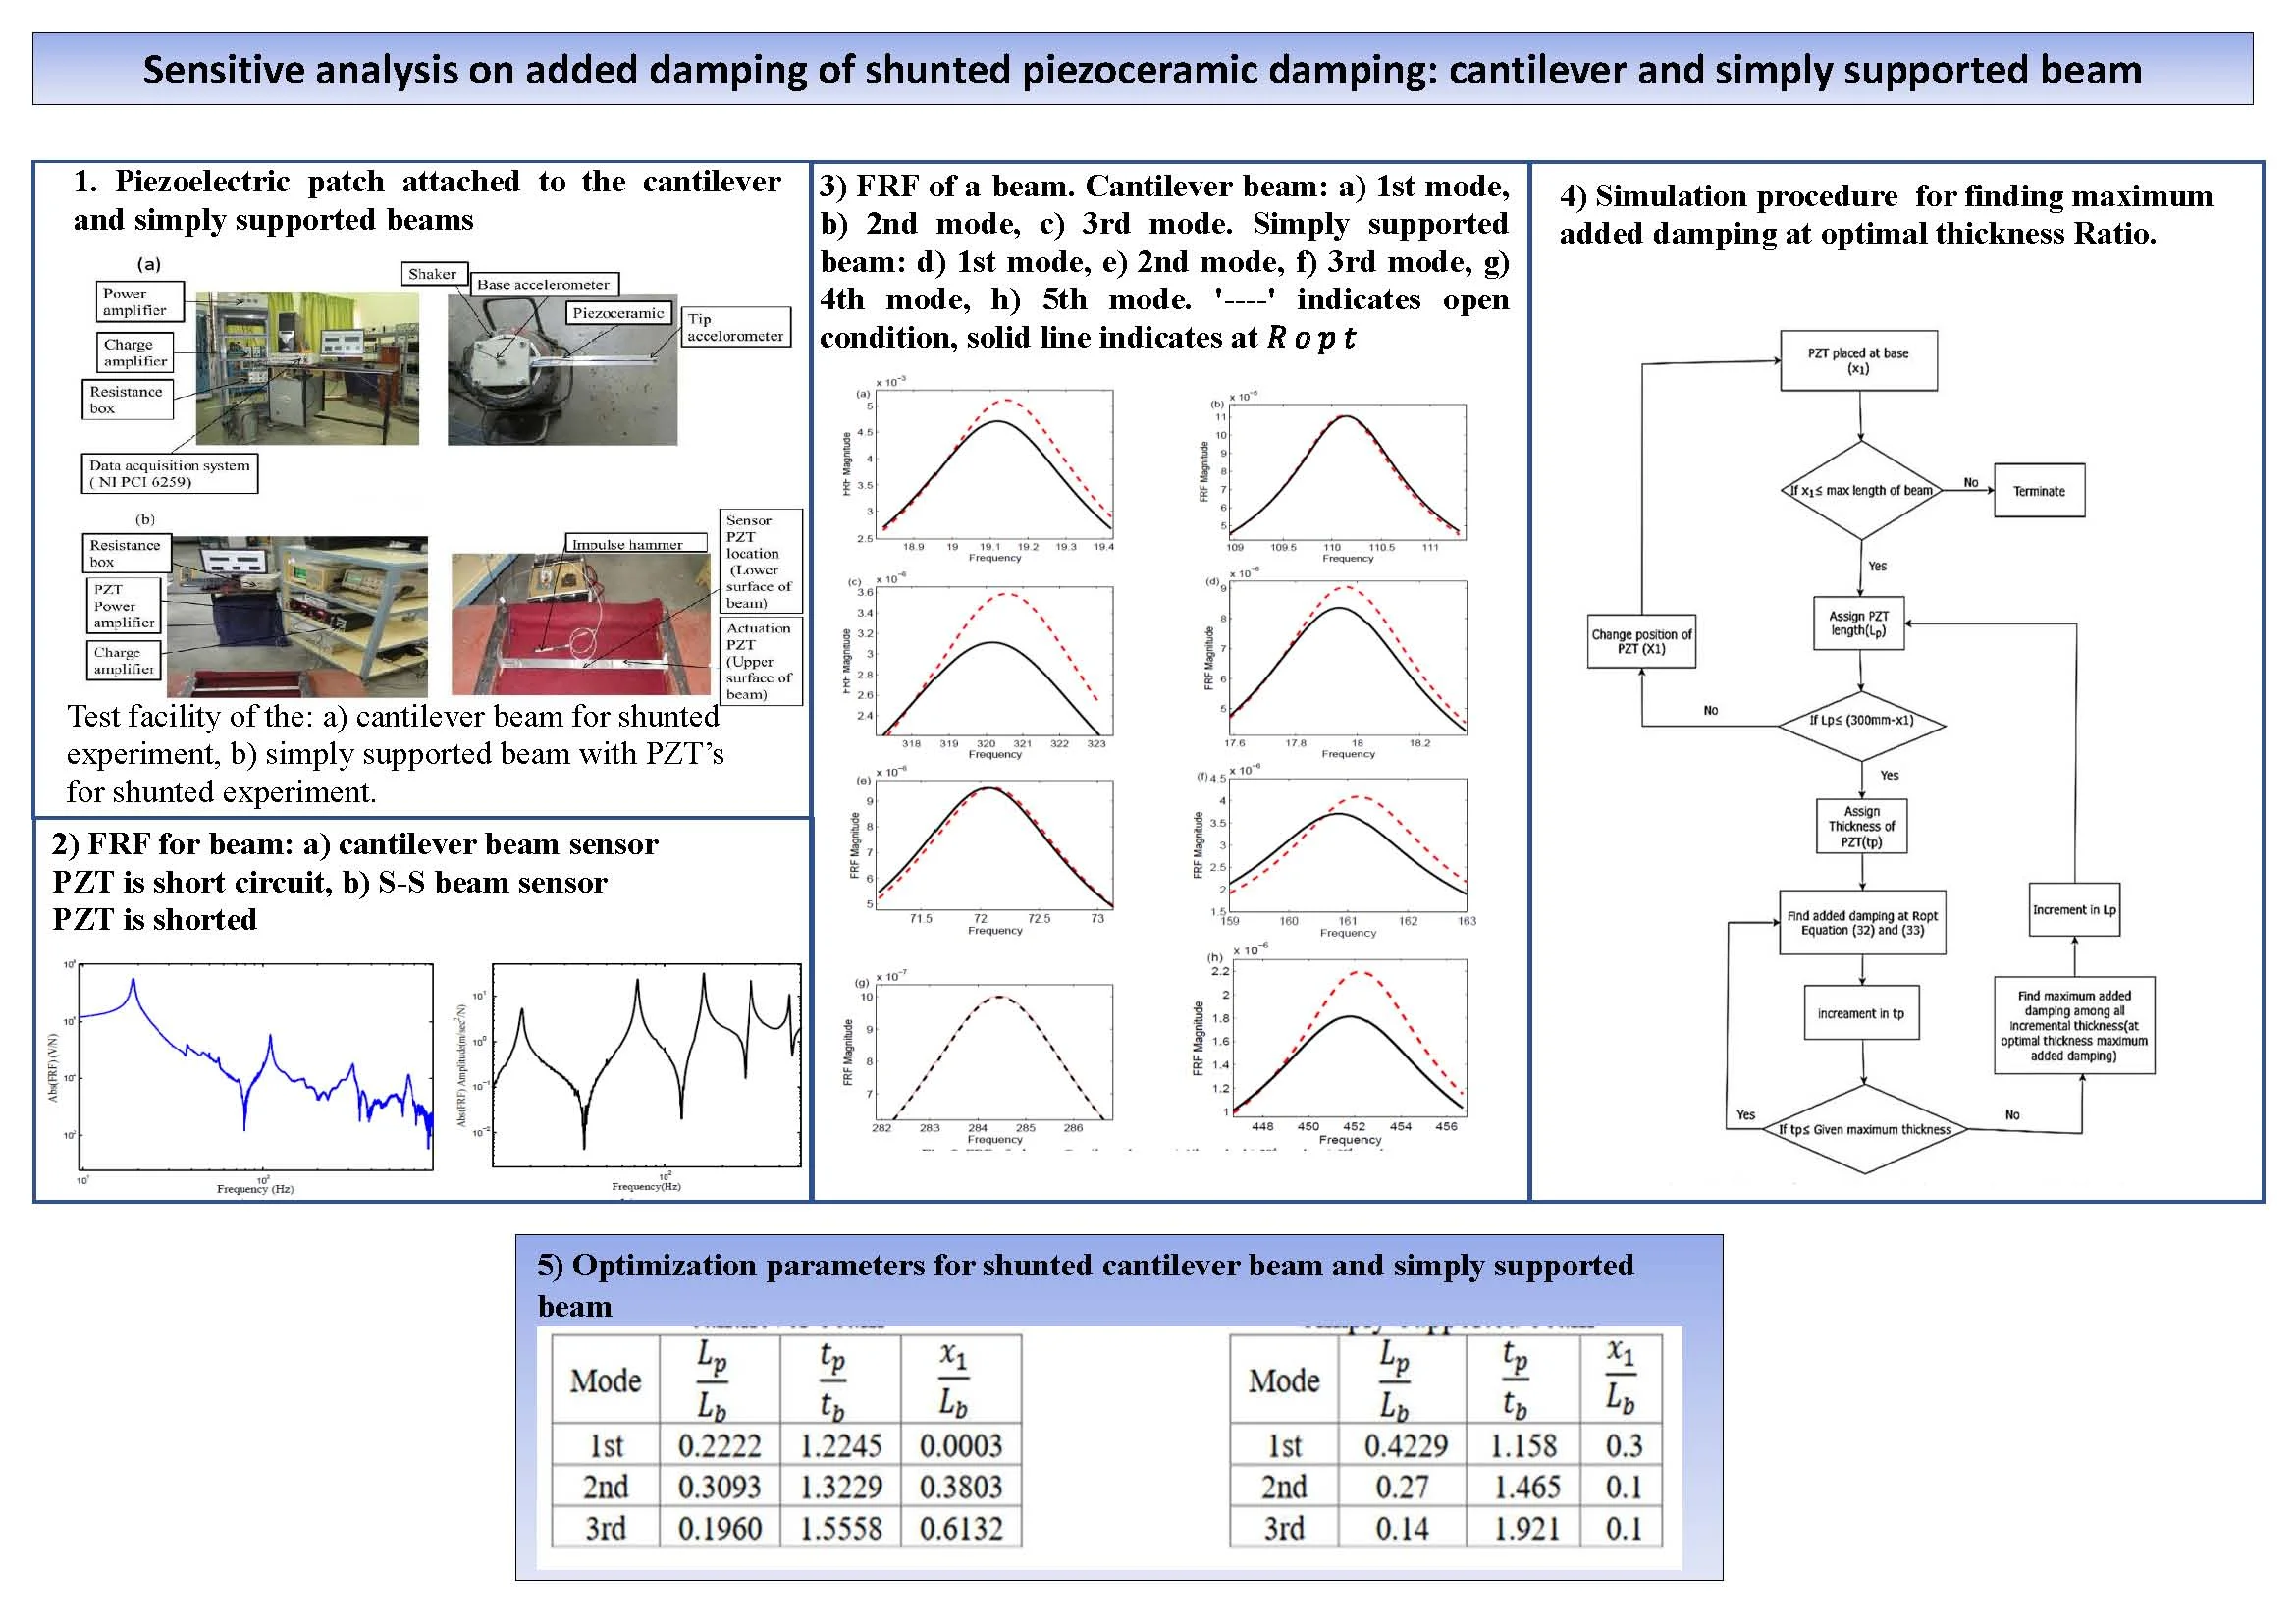
3.1. Piezoelectric patch attached to the cantilever and simply supported beams
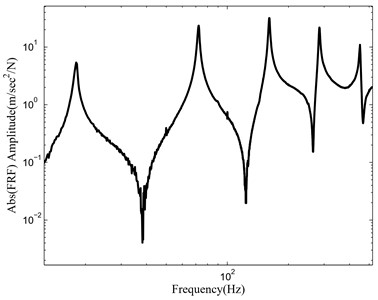
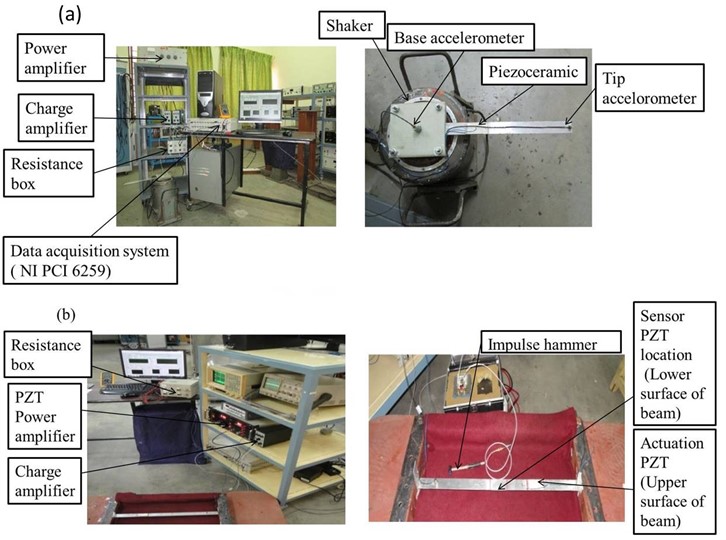
Experimental tests were conducted on an aluminium cantilever beam and simply supported beam specimen with surface bonded piezoceramic patches. One end of the aluminium beam is clamped at the electrodynamics shaker to simulate clamped boundary conditions for cantilever and PZT used for simply supported beam, and PZT is attached on one side at 44.39 mm from the fixed end for cantilever beam. The capacitance measured is 58.7 nF. The cantilever beam specimen is shown in Fig. 5. Simply supported beam (497×25.4×1.988 mm) specimen, with surface bonded Piezoceramic patches. Resistive shunting induced damping at the strain nodal position of the PZT is measured for a simply supported condition. In the simply supported beam on the other hand, PZT is attached to one side at 223.1 mm from the left end and other piezo at 320 mm from the left end, which is used for excitation of the beam. The electrodynamics shaker (Derritron VP 4/4B) is used for testing as shown in Fig. 5, Fig. 7. The base acceleration is measured by an accelerometer type 4335 B K (30 gms, sensitivity 71.37 pc-g-1) and at the tip, acceleration is measured by the accelerometer 4344 B K (2.1 gms, sensitivity 2.87 pc-g-1) both sensors were calibrated by B K 4294 calibrator. The weight of the tip accelerometer is 2.1 grams and the cable weight is 7.79 gm m-1 running from tip to base as shown in Fig. 7(a), (b). Modal mass due to tip sensor and cable weight were considered in the analytical formulation for correlation experimental results. The piezoelectric accelerometer and tip accelerometer are connected to two separate charge amplifiers B K 2635. The output signal is connected to the data acquisition system NI PCI 6259. The frequency response function of the beam is shown in Fig. 6. The voltage at resonance frequency at a particular tip amplitude of vibration and damping of the structure at ambient conditions is estimated. The input voltage to the shaker is kept constant by the controller using the National Instruments Lab View program and excited several frequencies in the vicinity of resonance frequency for steady-state conditions. A resolution of 0.01, 0.05, and 0.1 Hz is set for 1st, 2nd and 3rd modes with the data obtained at 50 frequencies in the vicinity of resonance. FRFs are obtained from the cantilever beam base and tip response. Inverse line fit is used to estimate the added damping for a beam with PZT short, shunted cases for particular amplitudes of vibration for the beam controlled by input voltage to the shaker.
Fig. 5A sketch of experimental test setup.: a) cantilever beam, b) simply supported beam
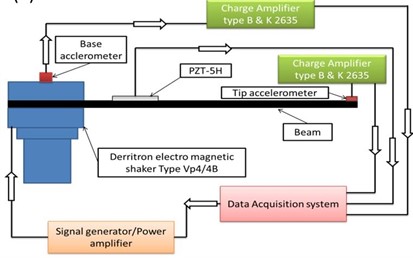
a)
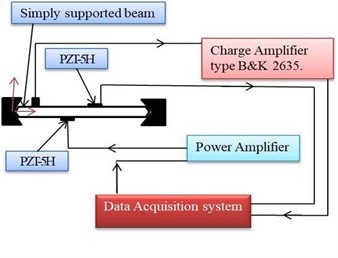
b)
Fig. 6FRF for beam: a) cantilever beam sensor PZT is short circuit, b) S-S beam sensor PZT is shorted
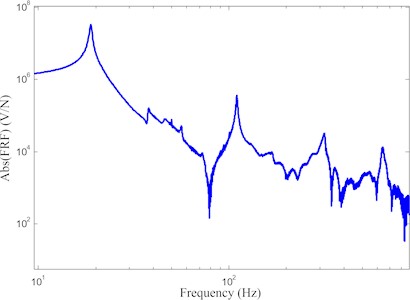
a)
b)
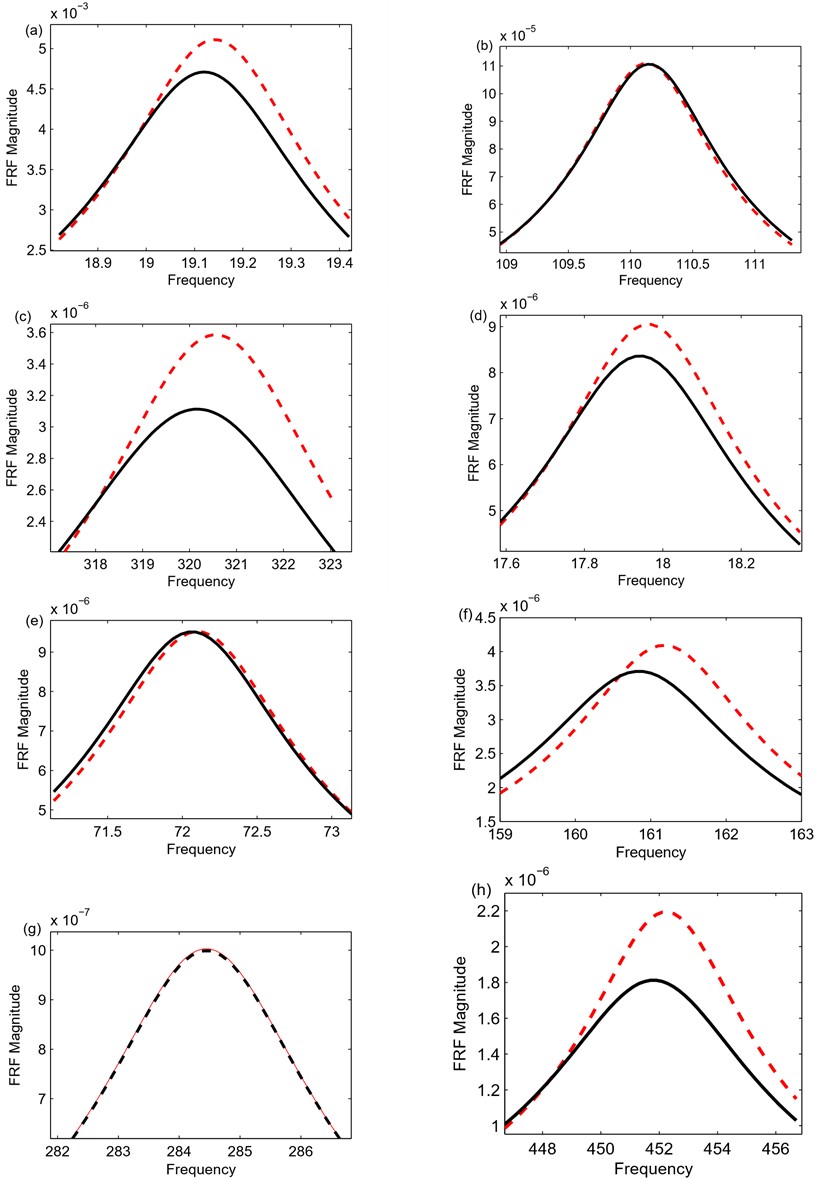
The voltage generated at the open circuit across the PZT at that resonance, tip displacement, and base acceleration are used to estimate base damping from the inverse line fit method. The resistors across PZT are varied in the range 1/10th of optimal resister to 10th of optimal resister and every resistance. The added damping was evaluated from the difference between the shunt damping to base damping. FRF of cantilever and simply supported beam open condition and at resistor is shown in Fig. 8.
Fig. 7Test facility of the: a) cantilever beam for shunted experiment, b) simply supported beam with PZT’s for shunted experiment
4. Optimal geometry for maximum damping
4.1. Cantilever beam and Simply supported beam
To investigate the geometrical effects on the maximum added damping simulation is done for various length and thickness ratios with the position of the PZT from the base of the cantilever beam and simply supported beam.
Table 1System properties for thickness ratio effect simulations
Property | Symbol | Value |
Length of beam | 300 mm | |
Width of beam | 25.4 mm | |
Thickness of the beam | 2 mm | |
Al density(beam) | 2700 kg/m3 | |
Al young’s modulus | 70 GPa | |
PZT-5H length | 50.8 mm | |
PZT-5H Width | 25.4 mm | |
PZT-5H Thickness | Varied | |
PZT-5H density | 7800 kg/m3 | |
PZT-5H young’s modulus | 69 GPa | |
PZT-5H constant | –6.64 | |
PZT-5H coupling coefficient | 0.34 | |
Poisson ratio | 0.3 |
To describe the thickness effect on added damping, the maximum added damping at optimal resistance as a function of thickness ratio for bimorph beam system with geometrical properties listed in Table 1, where substance (beam) thickness fixed while PZT thickness is varied, assuming simulated system inherent damping is 0.0045.
Fig. 8FRF of a beam. Cantilever beam: a) 1st mode, b) 2nd mode, c) 3rd mode. Simply supported beam: d) 1st mode, e) 2nd mode, f) 3rd mode, g) 4th mode, h) 5th mode. '----' indicates open condition, solid line indicates at Ropt
4.2. Simulation procedure for finding maximum added damping at optimal thickness ratio
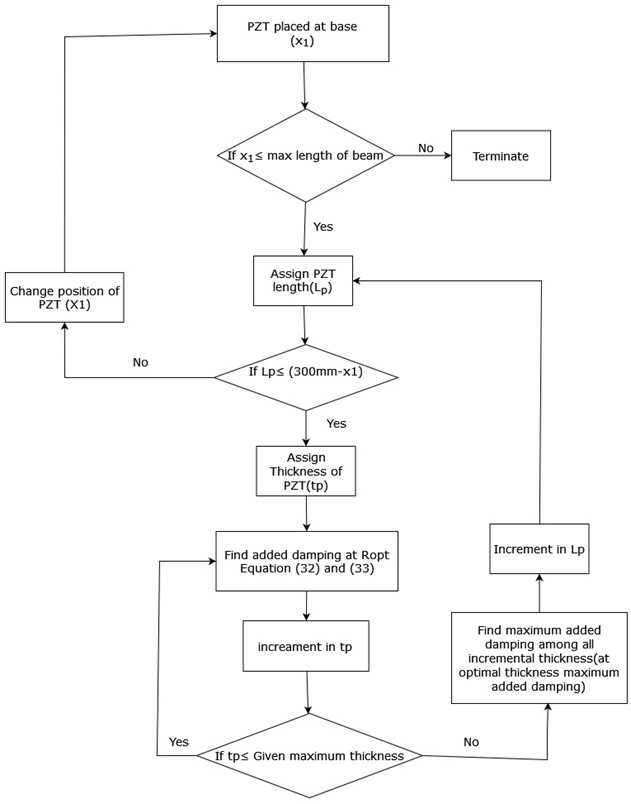
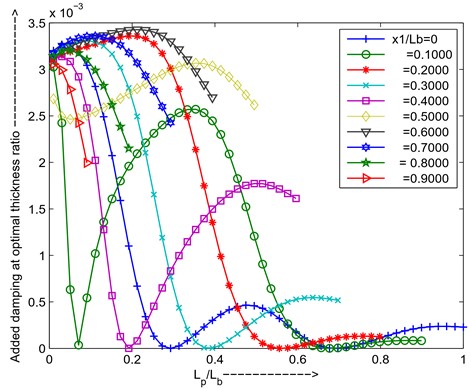
PZT is placed at = 0 (at fixed end of beam), length of PZT is fixed, and thickness of PZT at initial value, evaluated maximum added damping at optimal resistance using Eq. (32) and Eq. (33). Now change the thickness value find maximum added damping at optimal resistance. Above process repeated till thickness of PZT reaches given maximum value. Among all maximum added damping select for thickness ratio to get maximum added damping (Maximum added damping at optimal thickness ratio) at particular fixed length and position fixed. Now length of PZT is changed and repeat the same procedure as discussed above without changing position of PZT on beam. Find the maximum added damping at optimal thickness ratio, Next change the position of PZT on beam repeats the procedures for maximum added damping for optimal thickness ratio. Optimal thickness ratio vs ratio of length of PZT to beam is shown in Fig. 12 for 1st mode, Fig. 14 for 2nd mode, Fig. 16 for 3rd mode in cantilever beam, for simply supported beam Fig. 18, Fig. 20, Fig. 22 for 1st, 2nd, 3rd mode respectively, maximum added damping at optimal thickness ratio shown in Fig. 13 for 1st mode, Fig. 15, Fig. 17 for 3rd mode in cantilever beam, for SS beam Fig. 19, Fig. 21, Fig. 23 for 1st, 2nd, 3rd mode respectively. Schematic diagram for sensitive analysis on maximum added damping as shown in Fig. 9.
Fig. 9Schematic diagram for sensitive analysis on maximum added damping
5. Results and discussion
Added damping increases as the resistor value increases and reaches its maximum value further, added damping decreases as the resistor value increases as observed in Fig. 4. Impedance of resister and PZT capacitance are the two contribution parameters to the energy dissipation through resister. When PZT across the shunted resister value is small compared to the impedance of the capacitor, the capacitor dominates to produce current through the resistor. Current decreases and energy dissipation also decreases. If the resistor is large compared to the impendence of the capacitor, the resistor will dominate to energy dissipation and current is small, in both the cases energy dissipation across the resistor is small. When the resister value is equal to the impendence of the capacitor value will reach maximum energy dissipation at the optimal resistor. The optimal resister across the PZT for maximum added damping is obtained in Eq. (33). Hagood’s proposed model predicted 16 % more than the experimental, and the voltage generation model predicted 3.3 % deviation as compared to the experimentally added damping. The deviation is due to the Hagood proposed model assumption of uniform strain model and uniform mode shape for estimation of added damping. Experimental results show that the amplitude of vibration at its resonance influences the voltage generated at the open circuit and damping at ambient conditions. The voltage generated at the open circuit at a particular tip amplitude and maximum added damping is shown in Table 2 and Table 3 for the 1st, 2nd, and 3rd modes cantilever and simply supported beam respectively. Base acceleration, and tip amplitude also shown for three modes and the short and open circuit resonance frequencies are measured from experiments to estimate in Table 2. In put voltage and tip displacement are shown in Table 3 for simply supported beam. Added damping estimated from . Experimental and analytical listed in Table 4, shows that for cantilever beam close argument between approaches, but for simply supported beam except 2nd and 4th modes very close argument between approaches. 2nd and 4th modes are at the strain modeshape of the beam, the voltage generation is zero considering the PZT placed exactly at the strain nodal point coinciding at the middle of the piezo and negative and positive electrodes placed up and below the PZT. Open and short frequencies being equal in magnitude results in = 0 (added damping = 0), leading to shunting damping which is equal to base damping. PZT (sparkler ceramics) wrapped-around configuration with a 3 mm negative electrode in the upper portion, and only a small amount of voltage is generated (0.70v 0-pk for 2nd mode and 0.50v for 4th mode). Only a small amount of voltage is available to enhance the added damping estimated by the analytical energy dissipation model. The deviation of experimentally added damping to analytical added damping at the strain nodal position of piezoceramic is due to the difference in damping (shunt to open circuit) of the order of 10-5. The frequency domain technique (Inverse FRF method) does not generally give more reasonable results of the order of 10-5. The time domain method is used for evaluating reasonably added damping. The percentage of deviation from experimental to analytical is high at 2nd and 4th nodal position due to the above-stated reasons. The frequency domain vibration attenuation of both beams at open and at resistor condition shown in Fig. 8 and time domain attenuation tip displacement are shown in Table 2 and Table 3.
Table 2Experimental results for evaluation of Kij and % of decrement in tip displacement due to shunting for a cantilever beam
Mode No. | Frequency | Base damping | (Volt) (0-Pk) | (K-Ohms) | Base acceleration (m/sec2) | Tip displacement (microns) | % of decrement in the tip displacement due to shunting | |||
Open | Short | Open | at | |||||||
1 | 19.1442 | 19.1024 | 0.0099 | 1.5713 | 0.0662 | 142.42 | 0.07658 | 395 | 369.4 | 6.48 |
2 | 110.558 | 110.512 | 0.0053 | 1.7155 | 0.0289 | 24.618 | 1.5782 | 174 | 170 | 2.29 |
3 | 320.577 | 319.566 | 0.008 | 0.4877 | 0.0795 | 8.5134 | 1.22454 | 4.36 | 3.79 | 13.09 |
Table 3Experimental results for evaluation of Kij and % of decrement in tip displacement due to shunting for simply supported beam
Mode No. | -voltage across actuation PZT (Volt) (o-pk) | The output voltage across sensing PZT (o-pk) | Open frequency | (K-Ohms) | Displacement | % of decrement in the tip displacement due to shunting | ||
Open | at | |||||||
1 | 33 | 6.26 | 17.948 | 0.0652 | 172.3 | 0.2935 | 0.27231 | 7.78 |
2 | 35 | 0.7 | 72.052 | 0.0052 | 43.12 | 0.3229 | 0.32 | 0.9 |
3 | 35 | 9.135 | 161.1 | 0.07 | 19.11 | 0.014 | 0.0123 | 13.82 |
4 | 35 | 0.5 | 284.15 | 0.0091 | 10.71 | 3.48E-05 | 3.47E-05 | 0.21 |
5 | 19 | 8.78 | 451.941 | 0.077 | 6.825 | 4.37E-05 | 3.62E-05 | 20.49 |
Table 4Kij, Analytical and experimental added damping on cantilever and simply supported beam
Mode | Cantilever beam | Simply supported beam | ||||
Analytical | Experimental | Analytical | Experimental | |||
1 | 0.001098 | 0.001108 | 0.00091 | 0.001065 | 0.001084 | 0.001065 |
2 | 2.00E-04 | 1.98E-04 | 1.92E-04 | 7.74E-05 | 7.00E-05 | 6.90E-06 |
3 | 0.001582 | 0.00148 | 0.001462 | 0.001245 | 0.001286 | 0.001205 |
4 | – | – | – | 2.10E-05 | 2.10E-05 | 3.30E-05 |
5 | – | – | – | 0.00149 | 0.001424 | 0.001479 |
5.1. Optimal geometry for maximum added damping: Cantilever beam
To investigate the geometrical effects on the maximum added damping simulation is done for various length and thickness ratios with the position of the PZT from the base of the cantilever beam.
5.1.1. Thickness ratio and length ratio effects on added damping for the first mode
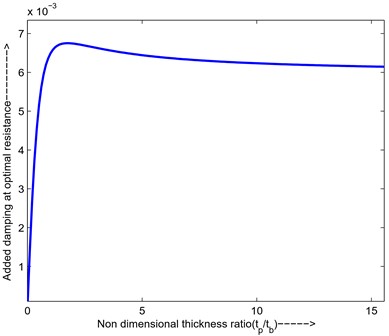
Fig. 10 shows that initially, the added damping increases sharply as the thickness ratio increases until it reaches a maximum of 0.0067 at a thickness ratio of 1.804. After the added damping decreases slowly and converges at 0.006. This behaviour can be explained from a force point of view. When the thickness ratio is small, increasing the ratio does not change the inertia force significantly, however, the converted damping force increases considerably. When the thickness ratio is very large through overall damping force due to resistive PZT not operating in the strain location due to inertia force, energy dissipation is not efficient as thin layer configuration.
Fig. 10Maximum added damping at optimal resistance versus thickness ratio
Now describe the thickness ratio on added damping for changing the length of PZT, position of PZT's first point is at 0 mm from the fixed end, as shown in Fig. 11:
Fig. 11Maximum added damping at optimal resistance versus thickness ratio for different lengths of PZT
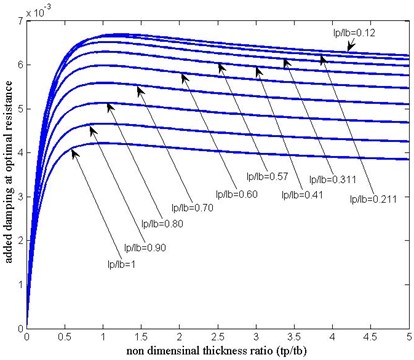
For the particular length of PZT, the position is fixed, and the thickness of PZT increases does not change (total strain energy) significantly, compared to electromechanical stiffness (Energy dissipation), if the thickness ratio of piezo increases the overall electromechanical stiffness and are large. The ratio of these two numbers will lead to a small number, that at higher thickness ratio added damping is less, as shown in Fig. 11.
Fig. 12Optimal thickness ratio versus length ratio for different positions of PZT
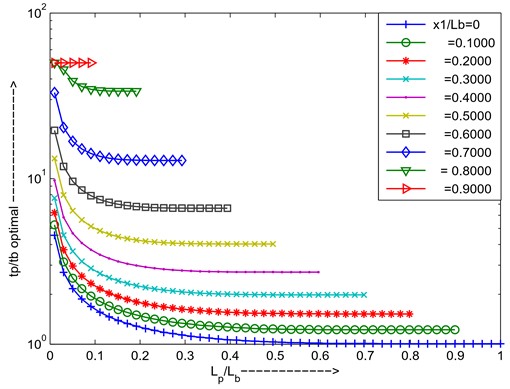
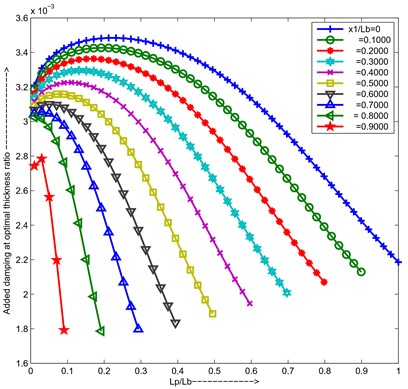
For increasing the length of the PZT, varying the thickness of the PZT above reason it holds. The optimal thickness ratio decreases due to the effect of increasing the total strain energy which will lead to settling down to the lower optimal thickness ratio compared to the lesser length of the piezo as shown in Fig. 12. The added damping increases first and will come to optimal then decreases due to increasing the length of PZT at optimal thickness ratio the total strain energy is not utilized for converting to the joule heating in that region, at the higher length of the PZT added damping decreases due to the total strain energy increases as shown in Fig. 13. For changing the position of the PZT, varies the length of PZT is added to damping curves and optimal thickness ratio curves plotted in Fig. 13 and 12 shows changing the position of PZT leads to a decrement in added damping due to the available strain being less. If the PZT is placed near the tip, and changing the length of the PZT added damping at optimal thickness curve slope is high due to the curvature between two endpoints of PZT is very less, and optimal thickness ratio is high to achieve maximum added damping. From the above graphs can conclude that for the cantilever first mode PZT is placed at the root position, the length ratio ratio is 0.2253, and the thickness ratio ( ) is 1.226 for maximum added damping.
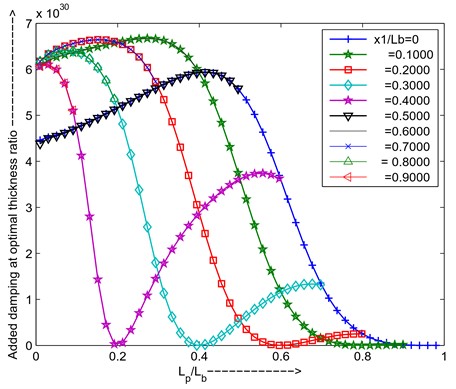
Fig. 13Maximum added damping at optimal resistance and optimal thickness ratio versus length ratio for different positions of PZT
5.1.2. Thickness ratio and length ratio effects on added damping for the second mode
For the second mode of the cantilever beam, the optimal thickness ratio is decreased for the length ratio increases due to the total stiffness increases, if the location is moved from the root to the tip of the cantilever beam depending upon the strain available for the PZT, the optimum thickness varies, as shown in Fig. 14 for 2nd mode of the cantilever beam. At is 0.9 and 0.200 the strain is very less so, for getting max added damping at that location requires more amount. To explain Fig. 15, added damping at optimal thickness ratio increases and decreases when particular length ratio due to the zero strain at , PZT is placed at the near root. For is 0.2 and 0.9 (at the tip) the added damping curve decrement slope is more due to the unavailability of the strain. From above graphs can conclude that for cantilever second mode, PZT is placed = 0.4, length ratio ratio is 0.31, thickness ratio () is 1.326 for maximum added damping.
5.1.3. Thickness ratio and length ratio effects on added damping for the third mode
From above graphs can conclude that for cantilever third mode, PZT is placed = 0.6, length ratio ratio is 0.2, thickness ratio () is 1.553 for maximum added damping.
Fig. 14Optimal thickness ratio versus length ratio for different positions of PZT
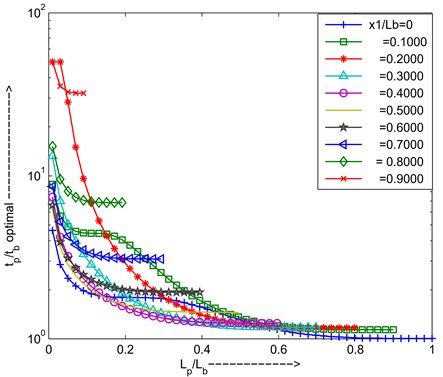
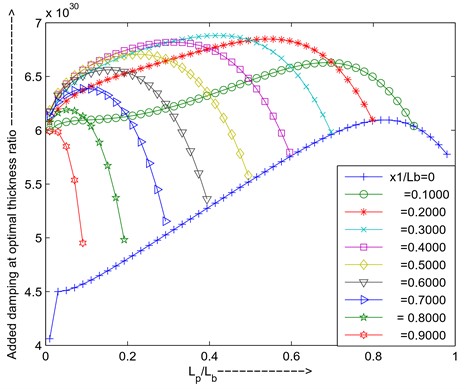
Fig. 15Maximum added damping at optimal resistance and optimal thickness ratio versus length ratio for different positions of PZT
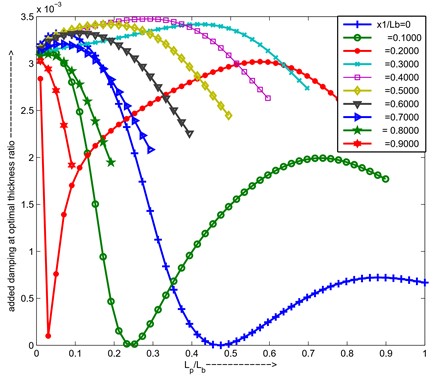
Fig. 16Optimal thickness ratio versus length ratio for different positions of PZT
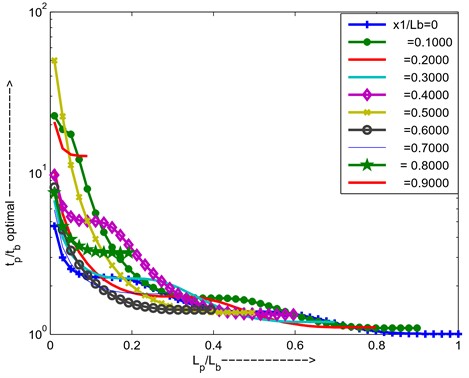
Fig. 17Maximum added damping at optimal resistance and optimal thickness ratio versus length ratio for different positions of PZT
5.2. Simply supported beam
5.2.1. Thickness ratio and length ratio effects on added damping for the first mode for simply supported beam
For simply supported beam first mode, the optimal thickness ratio is high if PZT is placed near the supported two ends of the beam due to the available strain is less to maximize the added damping for particular length ratio, to increase length ratio optimal thickness ratio decreases due to the total stiffness increases other words inertia force increases. if change the position of the PZT depends upon strain availability optimal thickness varies as shown in Fig. 18. the added damping increases first and will come to optimal then decreases due to increasing the length of piezo at optimal thickness ratio the total strain energy is not utilized for converting to the joule heating in that region, at the higher length of the piezo added damping decreases due to the total strain energy increases as shown in Fig. 19.
Fig. 18Optimal thickness ratio versus length ratio for different positions of PZT
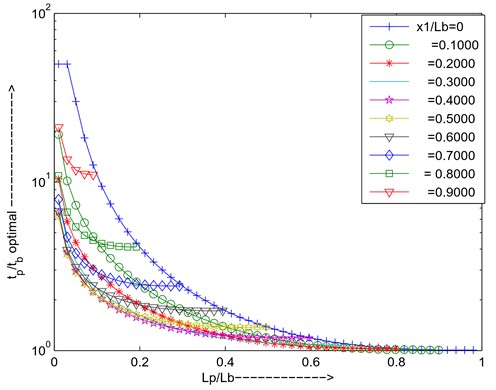
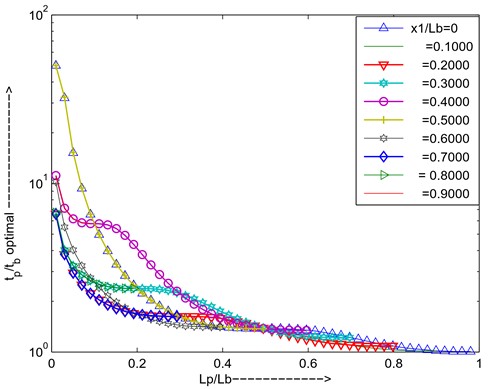
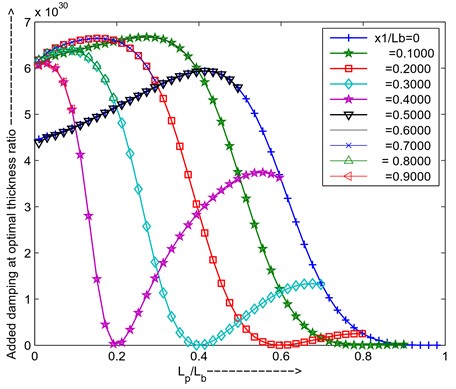
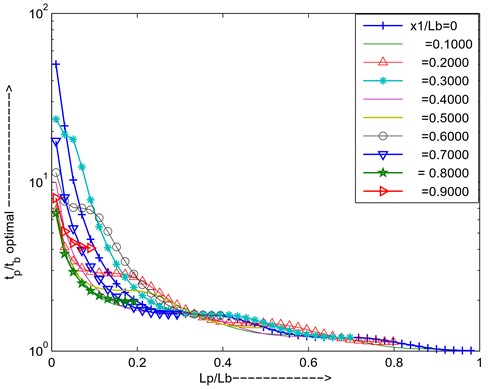
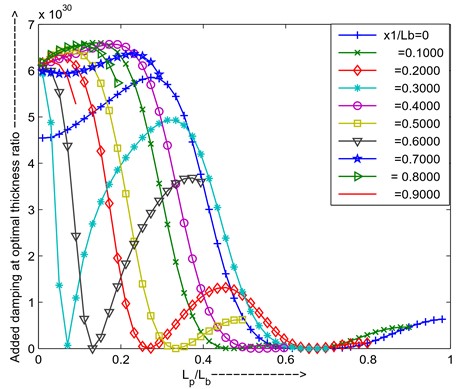
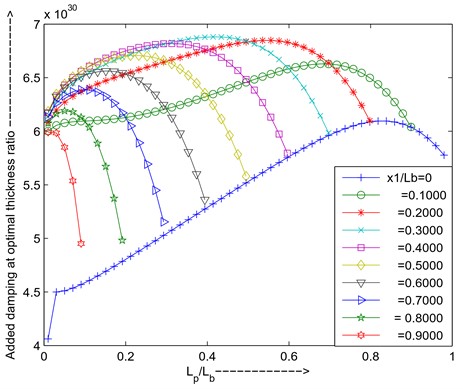
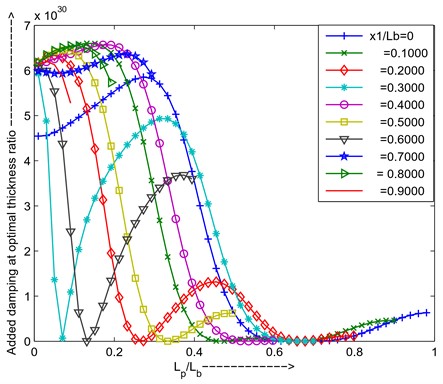
Fig. 19Maximum added damping at optimal resistance and optimal thickness ratio versus length ratio for different positions of PZT
If the piezo is shifted towards another end of the beam depending upon the strain availability added damping will change, i.e is 0.2 added damping will more be compared to the is 0. As shown in Fig. 19.
From the above graphs can conclude that for simply supported the first mode PZT is placed = 0.3 positions, length ratio ratio is 0.4229, thickness ratio () is 1.158 for maximum added damping.
5.2.2. Thickness ratio and length ratio effects added damping for the second mode
For the second mode simply supported beam PZT placed at near end and at = 0.5 the optimal thickness ratio for max added damping requires more compared to the other places of PZT due to the strain is zero at the point, both curves are lain due to the symmetry of the modal strain shape, if the length of the piezo increases optimal thickness decreases to achieve max added damping as shown in Fig. 20.
Fig. 20Optimal thickness ratio versus length ratio for different positions of PZT
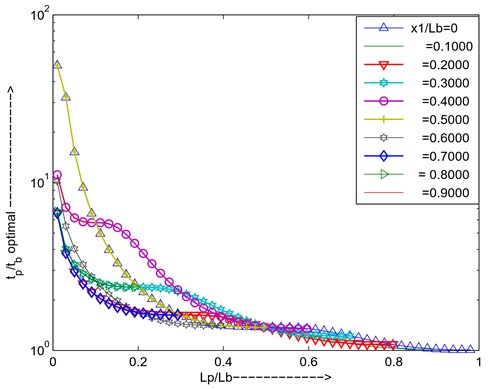
Fig. 21Maximum added damping at optimal resistance and optimal thickness | ratio versus length ratio for different positions of PZT
The added damping increases first and will come to optimal then decreases due to increasing the length of piezo at optimal thickness ratio the total strain energy is not utilized for converting to the joule heating in that region, at the higher length of the piezo added damping decreases due to the total strain energy increases as shown in Fig. 21. if the piezo is shifted towards another end of the beam depending upon the strain availability added damping will change, i.e is 0.4 added damping decreases if the length of PZT increases due to the strain node point at is 0.5 for the second mode simply supported beam.
From the above graphs can conclude that for simple supported the second mode PZT is placed = 0.1 or 0.6 positions, length ratio ratio is 0.27, thickness ratio is 1.474 for maximum added damping.
5.2.3. Thickness ratio and length ratio effects added damping for the third mode
From the Figs. 22-23 can conclude that for simply supported the third mode PZT is placed = 0.1 positions, length ratio ratio is 0.14, thickness ratio is 1.921 for maximum added damping.
Fig. 22Optimal thickness ratio versus length ratio for different positions of PZT
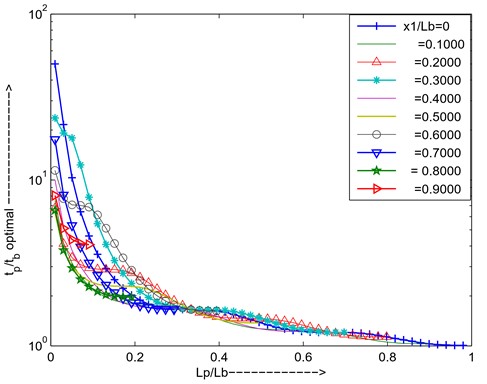
Fig. 23Maximum added damping at optimal resistance and optimal thickness ratio versus length ratio for different positions of PZT
6. Conclusions
The paper discusses about analytical model based on the voltage generation method for estimation of added damping for structure. The new model is validated concerning the experimental data available in the literature. Experiments are also conducted on a beam and compared with the derived analytical model, results correlate and a analytical model based on the voltage generation method. To optimize the geometry of the cantilever shunted structure for maximum added damping is shown in Table 5 and Table 6 for cantilever and simply supported beam.
Table 5Optimization parameters for shunted cantilever beam
Mode | |||
1st | 0.2222 | 1.2245 | 0.0003 |
2nd | 0.3093 | 1.3229 | 0.3803 |
3rd | 0.1960 | 1.5558 | 0.6132 |
Table 6Optimization parameters for shunted Simply Supported beam
Mode | |||
1st | 0.4229 | 1.158 | 0.3 |
2nd | 0.27 | 1.465 | 0.1 |
3rd | 0.14 | 1.921 | 0.1 |
References
-
N. W. Hagood and A. Von Flotow, “Damping of structural vibrations with piezoelectric materials and passive electrical networks,” Journal of Sound and Vibration, Vol. 146, No. 2, pp. 243–268, Apr. 1991, https://doi.org/10.1016/0022-460x(91)90762-9
-
C. L. Davis and G. A. Lesieutre, “A modal strain energy approach to the prediction of resistively shunted piezoceramic damping,” Journal of Sound and Vibration, Vol. 184, No. 1, pp. 129–139, Jul. 1995, https://doi.org/10.1006/jsvi.1995.0308
-
S. M. Yang and Y. J. Lee, “Modal Analysis Of Stepped Beams With Piezoelectric Materials,” Journal of Sound and Vibration, Vol. 176, No. 3, pp. 289–300, Sep. 1994, https://doi.org/10.1006/jsvi.1994.1377
-
S. M. Yang and Y. J. Lee, “Interaction of structure vibration and piezoelectric actuation,” Smart Materials and Structures, Vol. 3, No. 4, pp. 494–500, Dec. 1994, https://doi.org/10.1088/0964-1726/3/4/012
-
N. W. Hagood, W. H. Chung, and A. Von Flotow, “Modelling of Piezoelectric Actuator Dynamics for Active Structural Control,” Journal of Intelligent Material Systems and Structures, Vol. 1, No. 3, pp. 327–354, Jul. 1990, https://doi.org/10.1177/1045389x9000100305
-
E. H. Anderson and N. W. Hagood, “Simultaneous Piezoelectric Sensing/Actuation: Analysis And Application To Controlled Structures,” Journal of Sound and Vibration, Vol. 174, No. 5, pp. 617–639, Jul. 1994, https://doi.org/10.1006/jsvi.1994.1298
-
A. H. Anderson and E. F. Crawley, “Piezoceramic actuation of one and two-dimensional structures,” Cambridge, MA, May, MIT space systems Lab. Report, 1989.
-
S. J. Kim and J. D. Jones, “Optimal design of piezoactuators for active noise and vibration control,” AIAA Journal, Vol. 29, No. 12, pp. 2047–2053, Dec. 1991, https://doi.org/10.2514/3.10840
-
Z. Chaudhry and C. A. Rogers, “Performance and optimization of induced strain actuated structures under external loading,” AIAA Journal, Vol. 32, No. 6, pp. 1289–1294, Jun. 1994, https://doi.org/10.2514/3.12131
-
C. Maurini, M. Porfiri, and J. Pouget, “Numerical methods for modal analysis of stepped piezoelectric beams,” Journal of Sound and Vibration, Vol. 298, No. 4-5, pp. 918–933, Dec. 2006, https://doi.org/10.1016/j.jsv.2006.05.041
-
H. H. Law, P. L. Rossiter, G. P. Simon, and L. L. Koss, “CHARACTERIZATION OF MECHANICAL VIBRATION DAMPING BY PIEZOELECTRIC MATERIALS,” Journal of Sound and Vibration, Vol. 197, No. 4, pp. 489–513, Oct. 1996, https://doi.org/10.1006/jsvi.1996.0544
-
S. B. Kandagal and K. Venkatraman, “Form factors for vibration control of beams using resistively shunted piezoceramics,” Journal of Sound and Vibration, Vol. 274, No. 3-5, pp. 1123–1133, Jul. 2004, https://doi.org/10.1016/j.jsv.2003.09.030
-
S. B. Kandagal and K. Venkatraman, “Structural vibration control using resistively shunted piezoceramics,” Structural Engineering and Mechanics, Vol. 14, No. 5, pp. 521–542, Nov. 2002, https://doi.org/10.12989/sem.2002.14.5.521
-
Yabin Liao and H. A. Sodano, “Structural Effects and Energy Conversion Efficiency of Power Harvesting,” Journal of Intelligent Material Systems and Structures, Vol. 20, No. 5, pp. 505–514, Mar. 2009, https://doi.org/10.1177/1045389x08099468
-
Y. Liao and H. A. Sodano, “Piezoelectric Damping of Resistively Shunted Beams and Optimal Parameters for Maximum Damping,” Journal of Vibration and Acoustics, Vol. 132, No. 4, Aug. 2010, https://doi.org/10.1115/1.4001505
-
Y. Liao and H. A. Sodano, “Optimal placement of piezoelectric material on a cantilever beam for maximum piezoelectric damping and power harvesting efficiency,” Smart Materials and Structures, Vol. 21, No. 10, p. 105014, Oct. 2012, https://doi.org/10.1088/0964-1726/21/10/105014
-
K. Gurubrahmam, T. Ramamohan Rao, and M. Chandra Sekhar Reddy, “Study on added damping due to resistive shunting on cantilever, simply supported beam, and effect on the variation of amplitude at resonance,” Proceedings of the Institution of Mechanical Engineers, Part C: Journal of Mechanical Engineering Science, p. 095440622211321, Nov. 2022, https://doi.org/10.1177/09544062221132186
About this article

The authors have not disclosed any funding.
The datasets generated during and/or analyzed during the current study are available from the corresponding author on reasonable request.
The authors declare that they have no conflict of interest.
