Abstract
Recently, the transport industry has been substituting metal with composite parts due to their properties, such as increased strength, stiffness and lightweightness. Inspection and monitoring are very important tools that detect, identify and measure occurred damage or deterioration state of transport means and infrastructure. Acousto-ultrasonics is an non-destructive testing technique, which is essentially a combination of acoustic emission methodology with ultrasonic simulation of stress waves to assess defect states in certain materials. In this paper, we perform initial experiments with composite specimens, attempting to detect defects. In particular, the attenuation of simulated acoustic emission events are measured in order to further investigate the phenomenon of edge reflections from small composite specimens. Furthermore, the detection of two different types of defects is shown using only two features extracted from the signal.
1. Introduction
Recently, the transport industry has been moving away from metal parts in vehicle-bodies, giving way to the use of parts made of composite materials [1]. Composites are the new trend in the aviation and transport industry because of their characteristics including strength, stiffness and reduced weight [2]. These properties render composite materials a suitable candidate for other transportation means such as the railway industry [3].
Even though railway transport is considered to be one of the cleanest transportation means, further improvements can be made. The reduction of the environmental impact of new technologies at the early stage of product design and development should be considered. Another contemplation is the energy impact of the carbodies use phase due to their weight [4]. Pruning of the rail carriage mass, usually consisting of metal parts, is the primary action taken for the next generation of trains to introduce energy savings. Weight reduction could take place by changing the steel parts with composite components [5].
Non-Destructive Testing (NDT) and Structual Health Monitoring (SHM) inspect and monitor the state of critical means and infrastructures, whose failures can be quite expensive to repair and even life threatening [6-9]. NDT is used to inspect engineering structures in order to detect and identify flaws (cracks, inclusions, internal voids etc.), inhomogeneity in microstructures, loss in thickness, deformation and so on [10]. A typical SHM system consists of an array of connected sensors, which collect data during the service life of the means and infrastructure in a continuous manner. The main objective of such system is to locate, detect and identify any occurred damage or decay state that takes place over the service life [11].
Acousto-ultrasonics has a close relationship with Acoustic Emission (AE). Essentially, acousto-ultrasonics can be characterised as AE simulation with ultrasonic sources. The main difference between acousto-ultrasonic and AE methods is in the stress waves. Acousto-ultrasonics and AE waves are ultrasonic in nature. The AE method depends on loading to excite spontaneous stress waves. Acousto-ultrasonics differs mainly in that the ultrasonic waves are benign and generated by external pulses [12].
AE is a major methodology in the SHM research [13]. AE, along with the underlying technology of piezoelectric transducer mechanism (lead zirconate titanate PZT and relevant piezoelectric ceramics), has a long successful story in detecting failures in the transportation domain. Applications of AE monitoring include aircraft state monitoring, high speed train car-bodies, rail tracks as well as bridges [14-17].
AE can be used for composite material defect and identification. Composites also require monitoring of their health, since they are susceptible to defects, such as delamination, matrix crack, fiber-matrix debonding and fiber breakage [18]. The benefits from AE monitoring of composites are plenty and have been demonstrated in many past papers in the research literature [19-24]. AE can be used to constantly inspect or monitor assets while they remain in-service. This enables the tracking of changes in the infrastructure’s condition, without the need of terminating operations; thus, reducing downtime and enhancing productivity. Some advantages of the AE solution includes, 24/7 real-time monitoring, cost-efficiency, early and rapid defect detection (predictive maintenance), fault discrimination, high fault sensitivity and maintenance budgeting [25].
In this paper, two sets of experiments using the Mistras Micro-SHM (https://www.physicalacoustics.com/by-product/micro-shm-structural-health-monitoring-system/) system were performed to composite material specimens. The first set of experiments comprised the measurement of the attenuation of AE produced by Pencil Lead Breaks (PLB), indicating the impact of the reflection from its edges. The second set of experiments included trials with no defect and two configurations of defects, in order to show that the defects could be identified using two features of the signal.
2. Experimental setup and procedure
For the two sets of experiments, a 2 Mega Samples Per Second (MSPS) sampling rate was used with 2k samples buffer depth. An analog filter from 10 kHz to 1 MHz and a digital butterworth bandpass filter from 80 kHz to 200 kHz were used in order to avoid any external source of noise, like instability to the researcher hand, during the PLB, as well as background noise. In the first set of experiments, a 200 mm length and 70 mm width specimen was used. In the second set, a 200 mm length and 75 mm width specimen was employed. The importance of the experiments lies in the fact that the signal may suffer from reflections due to their small sizes.
2.1. Attenuation experiment setup
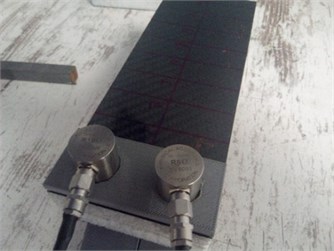
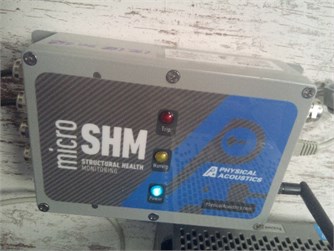
The first set of experiments took place to demonstrate the device sensitivity using this small specimen. Specifically, the experiments included the measurement of the attenuation of AE produced by a PLB. It was proven [26] that a 0.5 mm pencil with 2 hardness can closely simulate the AE event produced from the specimen under strain. The specimen was a PREPEG (https://en.wikipedia.org/wiki/Pre-preg) and Polyethylene Terephthalate (PET https://en.wikipedia.org/wiki/Polyethylene_terephthalate) composite with the same dimensions but of 10 mm thickness. The experimental layout and the wireless AE acquisition system can be seen in Fig. 1.
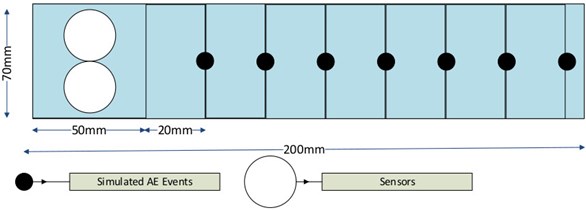
The specimen (70 mm width and 200 mm length) was mounted on top of triangular wedges through soft damping patches. Along the 200 mm side of the specimen, in the middle, a line was drawn with test points every 20 mm starting with a 50 mm distance from the left side of the specimen, where the sensor was placed (Fig. 2). Each test point recording included two sets of 4 PLBs.
Fig. 1a) Overview of the experimental layout with specimen and sensors, b) mistras micro-SHM wireless AE acquisition system
a)
b)
Fig. 2Attenuation distance points of simulated ΑΕ events
2.2. Defect experiment setup
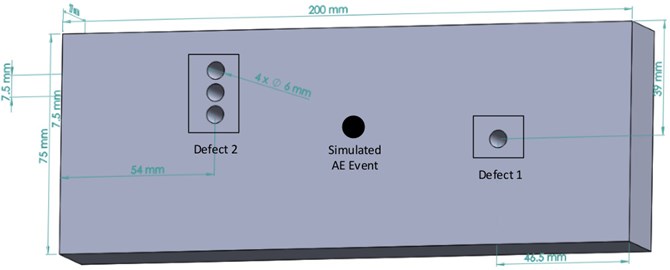
In order to introduce defects on the composite specimen (75 mm width and 200 mm length), it was pierced with one and three holes respectively close to the 75 mm sides. Henceforth, the one hole configuration is denoted as Defect 1 and the three holes configuration as Defect 2 respectively. The generation of the simulated AE event point using PLBs was located in the middle of the composite planar specimen. Three experiments were performed, namely i) Free Defect, ii) Defect 1 and iii) Defect 2. The model of the respective dimensions of Defect 1 and Defect 2 on the composite specimen can be seen in Fig. 3. The aim of the experiments was to show that the AE system can identify defects that reside prior to the simulated AE in the Line Of Sight (LOS) with the sensor. Two sets of four PLBs were performed per experiment. The statistics were obtained from the AEWin software, which accompanies the Micro-SHM system. The AEWin supporting software produces statistics including the average values of several features for each four simulated AE trials. The average value of the Amplitude and Energy Count were obtained per trial and averaged to get the final values.
Fig. 3Model of defect experiment
3. Results
For the attenuation experiments, we extracted the following parameters: Duration, Amplitude, Average Signal Level (ASL), Average Frequency, Reverberation Frequency, Initialisation Frequency, Signal Strength and Absolute Energy [27]. The corresponding diagrams of the features are presented as follows.
Fig. 4PREPEG+PEG with 10mm thickness AE features sampled from 50mm distance up to 190mm for R15a sensor
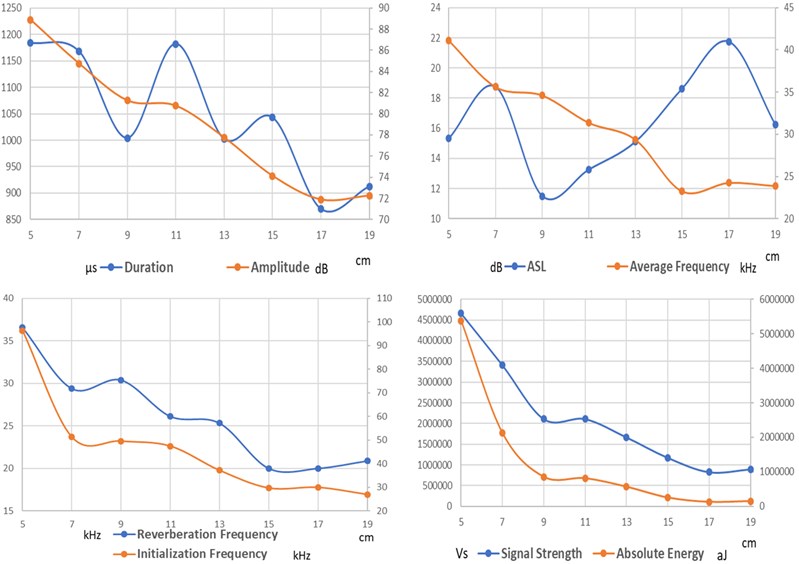
It is clear from the graphs in Fig. 4 that high sensitivity can be expected for a distance up to 300mm due to composite damping. For longer distances, hit energy readings must be used. This is acceptable in the cases where we aim for hits produced from sharp breaks with strong energy release. This will enable us to achieve detection distance for more than 1 meter; of course, detailed experiments with real and final sized composite specimens must be conducted, since the specimen is small and it introduces vast edge reflections. Due to the nature and sensitivity of AE events, along with the fact that by selecting sensors with resonance frequency above 200 kHz, its usage is highly recommended to be confined for critical car body joints and sections.
In the defect experiments, the data that was collected assisted in a comparison between the recordings of the sensors when Free Defect, Defect 1 and 2 were performed. We extracted the energy count and amplitude metrics, which can be seen in Table 1. Note that Table 1 shows the average values of the experiments with the respective standard deviations.
Table 1Energy count and amplitude values with free defect and presence of defects
Free defect | Defect 1 | Defect 2 | ||
Energy count (voltage-time) | Average | 4.00 | 3.37 | 2.12 |
Std Dev | 0.35 | 0.18 | 0.18 | |
Amplitude (dB) | Average | 49.5 | 47.63 | 45.63 |
Std Dev | 0.35 | 0.18 | 0.18 | |
The energy count is larger when there composite plane has no defect. This is something that verifies the correct functionality of the sensor R15a and the system as a whole, since energy count has to be lost from the defect experiments in front of the sensors. We see a clear reduction of energy count in the Defect 2 experiment. More specifically, we see a 15.6 % reduction in energy for the Defect 1 experiment compared to the Free Defect experiment. For the Defect 2 experiment we notice a 47 % reduction of energy compared with the Free Defect composite.
Furthermore, we observe that the amplitude is reduced in the presence of the defects. This finding is something that we anticipated, since the amplitude should be higher in the Free Defect experiment. However, the difference in the amplitude is slight between the Free Defect and Defect 1 experiments. The difference is clearer with the Defect 2 experiment. In particular, the respective reduction values are 1.875 dB and 3.875 dB.
4. Conclusions
In this paper, we presented our initial experimental investigation that was carried out in very small size composite specimens, using an AE sensor. Firstly, we measured the attenuation in a composite material specimen, showing the influence of the reflection from its edges. We showed that there is damping with the increase of distance from 50 mm to 190 mm. Moreover, we conducted experiments with no defect and two configurations of defects. The results showed that the defects can be identified by the one AE sensor, since the energy count and the amplitude are reduced in the presence of defects. For future work, a larger specimen is required, in which more defects could be done to conclude on system behavior.
References
-
Koniuszewska A. G., Kaczmar J. W. Application of polymer based composite materials in transportation. Progress in Rubber Plastics and Recycling Technology, Vol. 32, Issue 1, 2016, p. 1-24.
-
Alemour B., Badran O., Hassan M. R. A review of using conductive composite materials in solving lightening strike and ice accumulation problems in aviation. Journal of Aerospace Technology and Management, 2019, https://doi.org/10.5028/jatm.v11.1022.
-
Carbodin (Car Body Shells, Doors and Interiors, Shift2Rail Joint Undertaking (JU) G.A No 881814, https://carbodin.eu.
-
Castella P. S., Blanc I., Ferrer M. G., Ecabert B., Wakeman M., Manson J. A., Emery D., Han S. H., Hong J., Jolliet O. Integrating life cycle costs and environmental impacts of composite rail car-bodies for a Korean train. The International Journal of Life Cycle Assessment, Vol. 14, Issue 5, 2009, p. 429-442.
-
Cho J. G., Koo J. S., Jung H. S. A lightweight design approach for an EMU carbody using a material selection method and size optimization. Journal of Mechanical Science and Technology, Vol. 30, Issue 2, 2016, p. 673-681.
-
Farrar C. R., Worden K. An introduction to structural health monitoring. Philosophical Transactions of the Royal Society A: Mathematical, Physical and Engineering Sciences, Vol. 365, Issue 1851, 2007, p. 303-315.
-
Wang M. L., Lynch J. P., Sohn H. Sensor Technologies for Civil Infrastructures, Volume 2: Applications in Structural Health Monitoring. Elsevier, 2014.
-
Sack D. A., Olson L. D. Advanced NDT methods for evaluating concrete bridges and other structures. NDT & e International, Vol. 28, Issue 6, 1995, p. 349-357.
-
Krieger J., Friebel W. D. NDT methods for the inspection of road tunnels. Structural Materials Technology IV-An NDT Conference, 2000.
-
Trampus P. NDT challenges and responses-an overview. Proceedings of the 12th International Conference of the Slovenian Society for Non-Destructive Testing Application of Contemporary Non-Destructive Testing in Engineering, 2013.
-
Balageas D., Fritzen C. P., Güemes A. Structural Health Monitoring. John Wiley and Sons, Vol 90, 2010.
-
Vary A. The Acousto-Ultrasonic Approach. Acousto-Ultrasonics. Springer, Boston, 1988.
-
Wevers M., Lambrighs K. Applications of Acoustic Emission for SHM: A Review. Encyclopedia of Structural Health Monitoring, 2009.
-
Shanyavskiy A., Banov M. Acoustic emission methods for lifetime estimations in aircraft structures. Theoretical and Applied Fracture Mechanics, Vol. 109, 2020, p. 102719.
-
Bruzelius K., Mba D. An initial investigation on the potential applicability of Acoustic Emission to rail track fault detection. Ndt and E International, Vol. 37, Issue 7, 2004, p. 507-516.
-
Wang J., Wang T., Luo Q. A practical structural health monitoring system for high-speed train car-body. IEEE Access, Vol. 7, 2019, p. 168316-168326.
-
Nair A., Cai C. S. Acoustic emission monitoring of bridges: Review and case studies. Engineering Structures, Vol. 32, Issue 6, 2010, p. 1704-1714.
-
Ghobadi A. Common type of damages in composites and their inspections. World Journal of Mechanics, Vol. 7, Issue 2, 2017, p. 24-33.
-
Kordatos E. Z., Aggelis D. G., Dassios K. G., Matikas T. E. In-situ monitoring of damage evolution in glass matrix composites during cyclic loading using nondestructive techniques. Applied Composite Materials, Vol. 20, Issue 5, 2013, p. 961-973.
-
Začal J., Dostál P., Šustr M., Dobrocký D. Acoustic emission during tensile testing of composite materials. Acta Universitatis Agriculturae et Silviculturae Mendelianae Brunensis, Vol. 65, Issue 4, 2017, p. 1309-1315.
-
Godin N., Reynaud P., R’mili M., Fantozzi G. Identification of a critical time with acoustic emission monitoring during static fatigue tests on ceramic matrix composites: towards lifetime prediction. Applied Sciences, Vol. 6, Issue 2, 2016, p. 43.
-
Kaya F. Damage detection in fibre reinforced ceramic and metal matrix composites by acoustic emission. Key Engineering Materials, Vol. 434, 2010, p. 57-60.
-
Fotouhi M., Saeedifar M., Yousefi J., Fotouhi S. The Application of an Acoustic Emission Technique in the Delamination of Laminated Composites. Focus on Acoustic Emission Research, 2016.
-
Taheri H., Delfanian F., Du J. Acoustic emission and ultrasound phased array technique for composite material evaluation. ASME International Mechanical Engineering Congress and Exposition2013.
-
Mistras Group, https://www.mistrasgroup.com/.
-
Sause M. G. Investigation of pencil-lead breaks as acoustic emission sources. Journal of Acoustic Emission, Vol. 29, 2011, p. 184-196.
-
Kappatos V., Dermatas E. Feature selection for robust classification of crack and drop signals. Structural Health Monitoring, Vol. 8, Issue 1, 2009, p. 59-70.
Cited by
About this article

This publication has been produced within the project CARBODIN (Car Body Shells, Doors and Interiors). This project has received funding from the Shift2Rail Joint Undertaking (JU) under grant agreement No. 881814.
