Abstract
Due to the increasing use of composite materials for load-carrying structures that subjected to high-magnitude cyclic loading or vibrations, it is essential to investigate the accompanying phenomena occurring during structural degradation. The phenomenon, which may significantly accelerate structural degradation is the self-heating effect, causing intensive heating due to mechanical energy dissipation. In order to prevent sudden degradation of composite structures it is essential to characterize occurring damage types and their evolution during fatigue process. In this paper, the determination of fracture mechanisms during fatigue loading was performed based on acoustic emission analysis. The obtained results allow for clustering of acoustic emission data by type of occurring damage and correlate it with accompanying self-heating appeared during loading. This allows for proper understanding of physics of observed phenomena, which may help in design and operation of composite structures subjected to fatigue loading accompanied with self-heating effect.
1. Introduction
Polymer-based composites are widely used in many engineering constructions nowadays. Many of operating composite structures and elements, like viscoelastic dampers [1] or composite driveshafts [2], are subjected to intensive cyclic loading or vibrations, which may induce the occurrence of the self-heating effect. The self-heating, occurring due to hysteretic behaviour of polymers and polymer-based materials, results in heat generation, which is a dangerous phenomenon. This phenomenon may significantly influence on structural lifetime of a loaded element. At a certain level of stress, the self-heating effect becomes dominant over the mechanical fatigue process, which leads to intensive degradation induced by rapidly increasing self-heating temperature, and finally, total failure. In order to prevent domination of the self-heating effect the evaluation of evolution of damage mechanisms occurring during fatigue as well as determination a safe operational modes is essential from the point of view of proper design and operation of composite structures in such loading conditions.
The criticality of self-heating effect and failure mechanisms occurring during degradation have been studied over the last years by many measurement techniques, including analysis of thermal response [3, 4], evolution of mechanical and chemical properties [5, 6], and analysis of acoustic emission (AE) [5, 7, 8]. Due to the high sensitivity to degradation events, even at the microscale, an AE-based approach seems to be effective in characterization of structural degradation during fatigue accompanied with self-heating. Recent results described in [5, 7, 8] indicate a possibility of not only detection of the moment of initiation of structural degradation, but also characterization of its particular phases. However, AE signals contain much more information about degradation and its evolution, and, using advanced processing methods, it is possible to classify them by type of damage occurring in a tested structure during degradation process. This creates a possibility of evaluation of damage evolution and full characterization of a fracture mechanism observable during fatigue of composite structures accompanied with self-heating effect.
The characterization of structural damage in composites by means of AE-based methods was performed using various approaches. The simplest methods cover analysis of directly measured AE magnitude, hitting (or counting) and energy [5, 7-10]. However, this analysis allows for detection of damage occurrence without a possibility of identification of its type. Therefore, the raw data is usually pre-classified, which allows for defining characteristic ‘fingerprints’ for particular types of damage both in time [11] and frequency [12-14] domains. One of the first methods of an analysis in frequency domains was the determination of peak frequencies from Fourier spectra characteristic for particular damage events, e.g. matrix and fibre cracking, debonding, etc. With the development of advanced signal processing methods, the wavelet [14-18] and Hilbert-Huang [19-21] transforms and fractal analysis [22] started to be popular in such classifications due to the non-stationary character of measured AE signals and high sensitivity of these analysis methods to small changes and disturbances in an analysed signal. An application of these advanced methods allows for determination of characteristic frequency ranges for particular damage types.
The classification of damage, when the ranges of particular classes are determined simply by determination of frequency of occurrence of particular types of damage may be inaccurate – and therefore – ineffective, considering complex fracture mechanisms characteristic for composite structures. For the purpose of proper clustering of AE data considering their magnitude and frequency characteristics specific to particular types of damage several methods have been applied: simple, but effective approaches based on -means [21, 23-25], -Nearest Neighbours [23] or Principal Component Analysis [18, 26] classification algorithms as well as more advanced methods, like Kohonen’s Self-Organizing Maps (SOM) [24, 27] and hybrid methods, which use a class of soft computing algorithms, like Artificial Neural Networks (ANN) [24, 28].
The above-described studies mostly refer to quasi-static tests, while the number of described research studies on composites subjected to fatigue loading is very limited. Obviously, the fatigue processes have cumulative character of damage evolution, and these processes were divided into three phases of damage evolution, which has a reflection in the character of the temperature and AE events evolution [3-5, 7]. Following this, the classification of damage types occurring during these processes are possible using similar approaches as for quasi-static tests.
The main goal of this paper is to identify characteristic fracture mechanisms in composite structures subjected to cyclic loading and accompanied with self-heating by means of analysis of AE response. Moreover, based on performed identification it is possible to correlate the obtained results with time and temperature, which will allow for description of initiation of particular damage types within the self-heating temperature. This significantly improves the understanding the fracture mechanisms occurring during the fatigue process of composites, which allows for using this knowledge in design of structures and elements loaded in such modes as well as develop appropriate operation procedures for such elements in order to prevent accelerated structural degradation.
2. Materials and methods
The specimens made of 14-layered glass/epoxy composite with a trading symbol EP GC 201 used in this study were manufactured and supplied by Izo-Erg S.A. (Gliwice, Poland). The specimens were cut from a composite sheet with a thickness of 2.5 mm with specific dimensions: a width of 10 mm and a length of 100 mm. Note that the effective length, i.e. the length between specimens’ clamps which was subjected to loading, was 50 mm. The specimens were loaded with a constant frequency of 30 Hz and initial loading force of ca. 90 N. The loading parameters were set in such a way to induce non-stationary self-heating in tested specimens. Before the testing the surface observed by infrared camera was covered with a black matt heat-resisting silicone enamel manufactured by Dragon Poland Sp. z o.o. (Cracow, Poland) in order to ensure appropriate thermal emissivity and to reduce the surface reflectivity.
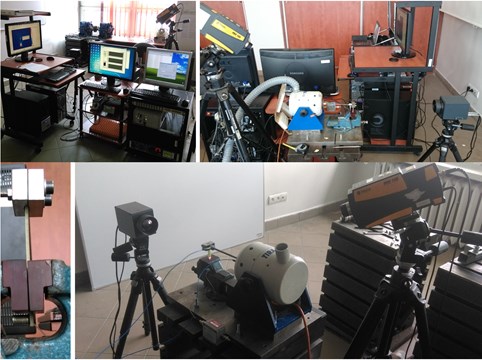
The testing procedure was performed on the own-designed experimental test rig, which is presented in Fig. 1. The specimen was clamped one side and loaded by the electrodynamic shaker on the other side. The excitation signal was generated from the own-developed software on PC and amplified through the power amplifier. The excitation vibrations were delivered to a tested specimen through a steel stinger ended by a force sensor (in order to control the excitation force) and a holder which holds a specimen. Additionally, an accelerometer was mounted on the shaker in order to control excitation acceleration. For ensuring repeatable conditions the specimens were clamped with a constant torque of 20 Nm using a torque wrench. The next monitored parameter was the velocity vibration of the specimen during loading which was measured in a contactless manner using laser Doppler vibrometer focused on the area near the lower clamp. All of the sensors were connected to the first PC through the conditioning module and multi-channel data acquisition card. The signals from these sensors were acquired with a sampling rate of 2 kHz. The temperature distribution evolution was registered using an infrared camera with a frame rate of 2 frames per second, which was connected to the second PC. Finally, the AE measurements were performed by a probe glued directly to a tested specimen in the non-loaded region with a silicone glue. The AE probe was connected through an AE signal preamplifier to an AE signal processor board, which was connected to the third PC. A detailed description of used equipment in the performed experimental studies with a scheme of the similar experimental setup can be found in [5].
Fig. 1Experimental setup for fatigue tests
In order to obtain statistically valid results, the fatigue tests were performed on 21 testing specimens. The specimens were excited to vibration in order to induce non-stationary self-heating effect, and the loading was delivered until the self-heating effect dominates fatigue process and causes failure of a specimen. The failure was usually observed in the self-heating temperature values range of 115-130 °C.
The acquisition of AE signals was performed by a dedicated software of the AE system manufacturer. During the measurements the values of AE magnitude in the function of time were collected. The frequency band of the AE sensor used during the tests was of 25-80 kHz. In order to separate measurement noise from the signal, the band-pass filter with a frequency band of 25-300 kHz (cut-off frequencies of 24 kHz and 310 kHz, respectively) was applied with a cut-off magnitude of 34.23 dBu (at the reference voltage of 50 μV), which was determined experimentally during initial tests. These initial tests included measurements of the acoustic background with all the measurement equipment used during the tests switched on. After finishing tests, the resulting measurement files were converted into a text file format and exported. Then, the resulting text files were imported to the MATLAB® environment for further processing.
3. Processing and results
3.1. Clustering of AE data
Before processing the acquired data, it was necessary to determine a suitable algorithm and number of clusters to be achieved in the clustering procedure. Based on the performed literature survey it was found that the -means algorithm has the highest classification accuracy comparing to more advanced classification algorithms, which used SOM and ANN [23, 24].
The number of clusters is mostly defined by the types of damage occurring during degradation of tested structures and distinguishability of their AE signatures. To-date, several classifications were introduced for fibre-reinforced composites. De Groot et al. [12] introduced a classification to 4 clusters with respect to the peak frequency values attributed to various damage types (in the ascending frequency mode): matrix cracking, fibre pull-out, debonding/delamination, and fibre breakage. Ramirez-Jimenez et al. [14] introduced the 3-cluster classification to fibre/matrix debonding, fibre slippage and fibre pull-out, and fibre breakage using the same criterion. Contrary to previous classifications, Gutkin et al. [24] introduced the 5-cluster classification, namely, matrix cracking, delamination, fibre/matrix debonding, fibre failure, and fibre pull-out using the peak frequency criterion. Berthelot [29] introduced another classification, which was based on magnitudes of AE signals characteristic to various types of damage. He proposed the 3-cluster classification: matrix cracking, fibre rupture, and longitudinal and interlaminar matrix failure, while Slykhous [30] substituted two last damage types by delamination and fibre rupture, which was typical for glass fibre-reinforced composites. The authors of [31] presented magnitude-based 3-cluster classification, where the following damage types were identified (in the ascending magnitude mode): matrix cracking, fibre/matrix interface cracking, and fibre breakage. These results were verified by microscopic observations.
Fig. 2The representative AE response with the maximal self-heating temperature history plot
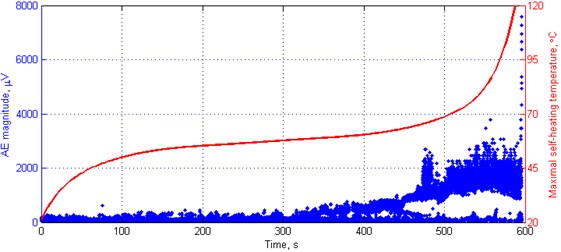
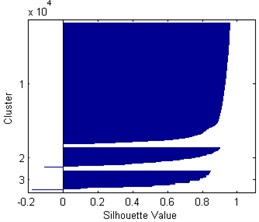
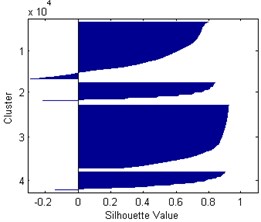
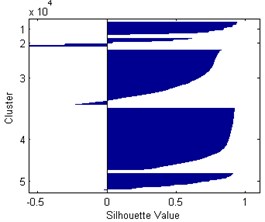
According to the presented classifications it is difficult to identify the occurring damage types and define the number of clusters properly. Moreover, the frequency and magnitude ranges in the defined clusters are often overlapping, therefore they cannot be determined by deterministic limit values. Taking into consideration the microscopic observations [5] one can distinguish three damage types: matrix microcracking as an initiation of degradation, fibre/matrix interface debonding, and development of a macrocrack with a fibre pull-out. The determination of number of clusters can be verified by analysis of separation effectiveness of AE data, which is possible by determining the silhouette index. This index can take values in the range from 1 to –1, where “1” denotes that the data points are very distant from each other, “0” indicates the data points that are not distinctly in one cluster to another, and “–1” indicates assignment of the data points to a wrong cluster. Taking into account previously discussed classifications the silhouette index was calculated for 3-5 based on selected representative case (see Fig. 2). Here, the AE magnitude given in μV denotes a linear peak amplitude derived from a measured peak amplitude of a hit in dBu. The resulting silhouette plots for these cases are presented in Fig. 3. The distance measure was assumed as the squared Euclidean. The resulting average values are as follows: 0.8347, 0.6568, and 0.6463 for 3-5, respectively.
From the silhouette plots one can observe that in the case of 3 the clusters are well-separated, and only few values seem to be wrongly classified (negative values). In contrast to this case, for 4 and 5 there are much more wrongly classified values and the silhouette values are much lower than in the first cases, which is confirmed by average silhouette values determined in this study. This analysis analytically confirms the correctness of assumed 3-cluster classification based on microscopic observation discussed earlier.
Fig. 3Silhouette plots for k= 3-5, respectively
a)
b)
c)
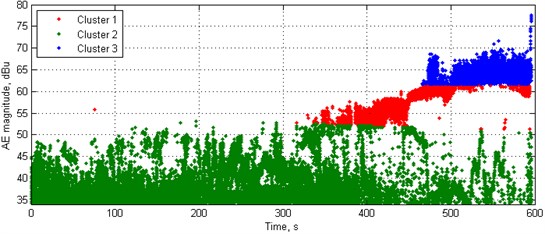
Following the obtained results, the classification was performed by dividing AE data to 3 clusters using -means algorithm. The exemplary classification is presented in Fig. 4. For the comparative purposes the AE magnitude response was presented in a logarithmic scale, in dBu. This scale is used for the representation of the magnitudes with respect to voltage levels, where the reference point of 0 dBu = 0.775 V.
In the case presented in Fig. 4 the resulting boundaries of particular clusters are as follows: Cluster 1 (matrix microcracking) – 34.32-53.16 dBu, Cluster 2 (interface debonding): 51.27-61.43 dBu, and Cluster 3 (matrix macrocracking and fibre pull-out): 61.80-77.61 dBu. The obtained values coincide well with literature data – Slykhous [30] defined the magnitude ranges as follows: Cluster 1: 35-50 dBu, Cluster 2: 55-75 dBu, and Cluster 3: 50-90 dBu, while the authors of [31] defined these ranges as follows: Cluster 1: 30-40 dBu, Cluster 2: 40-60 dBu, and Cluster 3: 60-70 dBu (the detailed description of designations of clusters from cited literature can be found above in this section). Considering a fact that the typical AE response depends on many experimental parameters, materials characteristics, and used measurement equipment, and a fact that some of them have stochastic nature it was decided to re-evaluate cluster boundaries based on statistical analysis of AE data.
Fig. 4Results of classification of AE data of a representative case
3.2. Statistical analysis and evaluation of clusters’ boundaries
In order to achieve statistically valid results of classification, the AE data from all 21 measurements performed in this study was subjected to classification using above-described algorithm. The average boundary values of particular clusters were as follows: Cluster 1: 34.32-55.66 dBu, Cluster 2: 55.66-65.29 dBu, Cluster 3: 65.29-76.35 dBu. One can observe that the obtained values are slightly higher than for the representative case.
Additionally, the distribution of the resulting values obtained within particular clusters from all tested specimens were presented in the form of histograms in Fig. 5. The number of bins was set to 30 based on preliminary analysis of resulting data. The probability density functions (PDFs) were determined for each cluster based on the non-parametric kernel-smoothing distribution in order to separate particular clusters from each other.
Fig. 5Histograms representing statistical classification of AE data for matrix microcracking, interface debonding, and matrix macrocracking and fibre pull-out, respectively, with appropriate PDFs
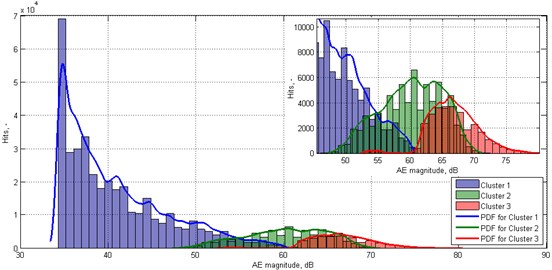
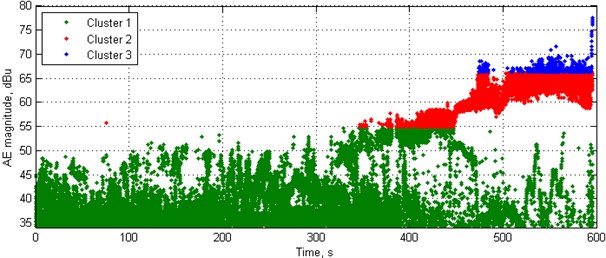
The resulting distributions represent the appearance of particular types of damage in terms of fuzzy sets. Clusters 1 and 3 are well separated from each other, while Cluster 2 have common areas with both previously mentioned clusters. This results from the mentioned stochastic nature of analysed AE data. Based on the obtained statistics of number of hits in particular clusters, one can define a new set of clusters’ boundaries by considering points of intersection of PDFs as the boundary values. Following this, the new boundaries of these clusters are as follows: Cluster 1: 34.32-54.77 dBu, Cluster 2: 54.77-66.16 dBu, Cluster 3: 66.16-80.17 dBu. The resulting values are very close to those obtained based on estimation of average boundary values. The resulting classification of a representative case using the boundaries of clusters determined from statistical analysis is presented in Fig. 6. Since the differences between the obtained values of clusters’ boundaries using two approaches are negligible, the presentation of classification results using clusters’ boundaries determined from averages is omitted.
Fig. 6Results of classification of AE data based on determined clusters’ boundaries
3.3. Correlation of AE data with self-heating temperature
Based on the determined clusters’ boundaries, it is possible to compare them to temperature history plots in order to assign particular fracture events to the self-heating temperature values. Analysing the representative case presented in Fig. 2, one can observe that, according to the obtained results of clustering, the fibre/matrix interface debonding initiates at the self-heating temperature value of 58.99 °C, while the development of macrocracking at 65.73 °C. While the interface debonding does not affect significant structural changes, the initiation of a macrocrack does, which has a reflection in a drop of mechanical properties of a structure, namely the ultimate tensile strength and residual strength determined based on maximal force at failure [5]. The obtained temperature value of macrocrack initiation are also confirmed by the results of microscopic observations of degradation evolution during fatigue with occurrence of the self-heating effect of composite structures [5].
4. Conclusions
The presented studies deal with evaluation of damage mechanisms developed during fatigue loading of polymeric composite structures accompanied with the self-heating effect using AE testing. The performed measurements allow for collecting and analysing AE data from the fatigue process and their further classification with respect to occurring of particular damage types. Based on literature report, physical observations of fatigue process, and the performed silhouette analysis it was possible to determine the number of clusters for further classification. The classification was performed based on -means algorithm. Due to the stochastic nature of several factors influencing on fatigue process, the determination of clusters’ boundaries was based on analysis of probability density functions of particular types of damage and on average values of boundaries determined from datasets of each specimen. The obtained results reveal high similarity between two applied approaches for evaluation of clusters’ boundaries as well as relatively high similarity with boundaries described in the literature. Moreover, the correlation with the self-heating temperature history results in high similarity in determination of criticality of self-heating effect comparing with the results obtained by previously applied methods and measurement techniques.
The obtained results allow for proper understanding of fracture mechanisms occurring during fatigue of composite subjected to self-heating, which may be useful during design and operation of polymeric composite structures subjected to such a loading.
References
-
De Cezanove J., Rade D. A., De Lima A. M. G., Araújo C. A. A numerical and experimental investigation of self-heating effects on viscoelastic dampers. Mechanical Systems and Signal Processing, Vol. 27, 2012, p. 433-445.
-
Henry T. C., Bakis C. E., Smith E. C. Viscoelastic characterization and self-heating behavior of laminated fiber composite driveshafts. Materials and Design, Vol. 66, 2015, p. 346-355.
-
Naderi M., Kahirdeh A., Khonsari M. M. Dissipated thermal energy and damage evolution of glass/epoxy using infrared thermography and acoustic emission. Composites Part B: Engineering, Vol. 43, Issue 3, 2012, p. 1613-1620.
-
Katunin A. Thermal fatigue of polymeric composites under repeated loading. Journal of Reinforced Plastics and Composites, Vol. 31, 2012, p. 1037-1044.
-
Katunin A., Wronkowicz A., Bilewicz M., Wachla D. Criticality of self-heating in degradation processes of polymeric composites subjected to cyclic loading: a multiphysical approach. Archives of Civil and Mechanical Engineering, Vol. 17, 2017, p. 806-815.
-
Katunin A., Krukiewicz K., Turczyn R. Evaluation of residua cross-linking caused by self-heating effect in epoxy-based fibrous composites using Raman spectroscopy. Chemik, Vol. 68, 2014, p. 957-966.
-
Kahirdeh A., Khonsari M. M. Criticality of degradation in composite materials subjected to cyclic loading. Composites Part B: Engineering, Vol. 61, 2015, p. 375-382.
-
Kahirdeh A., Khonsari M. M. Acoustic entropy of the materials in the course of degradation. Entropy, Vol. 18, 2016, p. 280.
-
Liu P. F., Chu J. K., Liu Y. L., Zheng J. Y. A study on the failure mechanisms of carbon fiber/epoxy composite laminates using acoustic emission. Materials and Design, Vol. 37, 2012, p. 228-235.
-
Njuhovic E., Bräu M., Wolff-Fabris F., Starzynski K., Altstädt V. Identification of interface failure mechanisms of metallized glass fibre reinforced composites using acoustic emission analysis. Composites Part B: Engineering, Vol. 66, 2014, p. 443-452.
-
Valentin D., Bonniau P., Bunsell A. R. Failure mechanism discrimination in carbon fibre-reinforced epoxy composites. Composites, Vol. 14, 1983, p. 345-351.
-
de Groot P. J., Wijnen P. A. M., Janssen R. B. F. Real-time frequency determination of acoustic emission for different fracture mechanisms in carbon/epoxy composites. Composites Science and Technology, Vol. 55, 1995, p. 405-412.
-
Giordano M., Calabró A., Esposito C., D’Amore A., Nicolais L. An acoustic-emission characterization of the failure modes in polymer-composite materials. Composites Science and Technology, Vol. 58, 1998, p. 1923-1928.
-
Ramirez-Jimenez C. R., Papadakis N., Reynolds N., Gan T. H., Purnell P., Pharaoh P. Identification of failure modes in glass/polypropylene composites by means of the primary frequency content of the acoustic emission event. Composites Science and Technology, Vol. 64, 2004, p. 1819-1827.
-
Qi G., Barhorst A., Hashemi J., Kamala G. Discrete wavelet decomposition of acoustic emission signals from carbon-fiber-reinforced composites. Composites Science and Technology, Vol. 57, 1997, p. 389-403.
-
Qi G. Wavelet-based AE characterization of composite materials. NDT&E International, Vol. 33, 2000, p. 133-144.
-
Ni Q. Q., Iwamoto M. Wavelet transform of acoustic emission signals in failure of model composites. Engineering Fracture Mechanics, Vol. 69, 2002, p. 717-728.
-
Marec A., Thomas J.-H., El Guerjouma R. Damage characterization of polymer-based composite materials: Multivariable analysis and wavelet transform for clustering acoustic emission data. Mechanical Systems and Signal Processing, Vol. 22, 2008, p. 1441-1464.
-
Lu C., Ding P., Chen Z. Time-frequency analysis of acoustic emission signals generated by tension damage in CFRP. Procedia Engineering, Vol. 23, 2011, p. 210-215.
-
Lin L., Chu F. Feature extraction of AE characteristics in offshore structure model using Hilbert-Huang transform. Measurement, Vol. 44, 2011, p. 46-54.
-
Hamdi S. E., Le Duff A., Simon L., Plantier G., Sourice A., Feuilloy M. Acoustic emission pattern recognition approach based on Hilbert-Huang transform for structural health monitoring in polymer-composite materials. Applied Acoustics, Vol. 74, 2013, p. 746-757.
-
Silva F. E., Gonçalves L. L., Fereira D. B. B., Rebello J. M. A. Characterization of failure mechanism in composite materials through fractal analysis of acoustic emission signals. Chaos, Solitons and Fractals, Vol. 26, 2005, p. 481-494.
-
Godin N., Huguet S., Gaertner R., Salmon L. Clustering of acoustic emission signals collected during tensile tests on unidirectional glass/polyester composite using supervised and unsupervised classifiers. NDT&E International, Vol. 37, 2004, p. 253-264.
-
Gutkin R., Green C. J., Vangrattanachai S., Pinho S. T., Robinson P., Curtis P. T. On acoustic emission for failure investigation in CFRP: Pattern recognition and peak frequency analysis. Mechanical Systems and Signal Processing, Vol. 25, 2011, p. 1393-1407.
-
Kempf M., Skrabala O., Altstädt V. Acoustic emission analysis for characterisation of damage mechanisms in fibre reinforced thermosetting polyurethane and epoxy. Composites Part B: Engineering, Vol. 56, 2014, p. 477-483.
-
Li L., Lomov S. V., Yan X., Carvelli V. Cluster analysis of acoustic emission signals for 2D and 3D woven glass/epoxy composites. Composite Structures, Vol. 116, 2014, p. 286-299.
-
Godin N., Huguet S., Gaertner R. Integration of the Kohonen’s self-organizing map and k-means algorithm for the segmentation of the AE data collected during tensile tests on cross-ply composites. NDT&E International, Vol. 38, 2005, p. 299-309.
-
Crivelli D., Guagliano M., Monici A. Development of an artificial neural network processing technique for the analysis of damage evolution in pultruded composites with acoustic emission. Composites Part B: Engineering, Vol. 56, 2014, p. 948-959.
-
Berthelot J. M. Relation between amplitudes and rupture mechanisms in composite materials. Journal of Reinforced Plastics and Composites, Vol. 7, 1988, p. 284-299.
-
Slykhous S. J. Using location and waveform capture to investigate RTR tubing. Proceeding of the 1st International Symposium on Acoustic Emission from Reinforced Plastics, San Francisco, 1983.
-
Abazary S., Oskouei A. R. Acoustic emission monitoring of composite plates under buckling loads. Proceedings of the International Mechanical Engineering Congress and Exposition, Houston, 2012.
Cited by
About this article

The results presented in this paper have been obtained within the framework of research Grant No. 2015/17/D/ST8/01294 financed by the National Science Centre, Poland.
