Abstract
A damage localization method based on natural frequency was proposed in order to complete the nondestructive diagnosis of a composite plate. The relationship between the damage position and the natural frequency of the composite plate was studied both qualitatively and quantitatively. Furthermore, the damage localization method proposed in this paper was proved by simulation and experimentation, with the results showing that this method can locate the position where the stiffness of the composite plate decreased in both simulation and experiment. Finally, the damage localization method based on natural frequency can be applied for non-destructive diagnosis of a delamination composite plate.
1. Introduction
Composite plates are widely used in the shipbuilding industry because of their high strength-to-weight ratio, good shock absorption, safety, and molding process. When the composite plates are damaged [1], their reliability will decline seriously and may even lead to a structural failure, which has far-reaching effects. As a result, the damage diagnosis of composite plates has become a highly important task.
Due to the fact that the global strain region changes very little, and these changes are accompanied with local cracking. The strain is only noticeable at the crack tip. So the strain-based methods were proposed for the prediction of crack origin and development [2-4]. Guided waves are now researched in the diagnosis of composite plates [5, 6]. The mechanism is straightforward: a PZT embedded into a composite plate launches an ultrasonic pulse that propagates as an elastic wave, which can be received by other PZTs [7, 8]. When the received signals are compared to signals previously received, the signal distortion shall bear evidence of the destruction of the composite plate.
According to previous researchers, a damage function composed of a natural frequency variation ratio was proposed in this study, and the following research was completed with the damage function. The finite element method (FEM) was used to validate the damage localization using a damage function. After validation, a non-destructive diagnosis of delamination composite plates with a damage function was applied to prove the experiment method.
2. Damage location theory of composite plate
The damage of composite plates often leads to a decrease in local stiffness, which causes natural frequency variation [9]. The degree and position of stiffness reduction have an impact on the natural frequency of the composite plate. Thus:
where is the variation value of the i-th natural frequency of the composite plate after damage.
Expand the function Eq. (1) to the undamaged state and ignore the second-order terms:
Obviously, . Hence:
Similarly:
By eliminating the change of stiffness from Eqs. (3-4):
Eq. (5) shows that the ratio of frequency variations in two modes is only a function of the damage location. Because the natural frequency is easy to measure, the conclusion is of great significance to the location of composite plate damage.
3. Dynamic analysis of damaged composite plate
In this section, the relationship between local damage and natural frequency of a composite plate was studied. If to ignore the influence of the environment and damping, it is possible get the dynamic equation of a composite plate:
where and are the global stiffness matrix and mass matrix of the composite plate, and and are the natural frequency and mode shape. The effect of the stiffness matrix change shall be considered; Eq. (6) then becomes:
Eq. (7) reduces to:
Eq. (8) shows the relationship between the change of the global stiffness matrix and the variation of natural frequency. The global mass matrix and the mode shape can be calculated by the FEM, and the change of natural frequency can be expressed by Eq. (8).
4. Damage function for diagnosis
The variation of the th natural frequency can be calculated with Eq. (8) if the degree and position of the damage are known. However, the damage degree of a composite plate is frequently unknown in engineering. As a result, Eq. (5) can be used to find the damage position of a composite plate.
The diagnosis process is as follows:
(1) Divide the composite plate into several elements. When an element is damaged, according to Eq. (8), the reference values for the natural frequency variation ratio are:
(2) Define the damage function by assuming the damage to be at position , given frequency changes and in modes and , respectively, as:
(3) Calculate the damage function of all elements by Eq. (10). The element with the minimum damage function is the damaged element.
5. Simulation Validation
In this section, a composite plate damaged with delamination is determined using the FEM, and the composite plate damage localization method based on the damage function is verified.
Fig. 1(a) shows the geometric design of a composite plate (a).
Fig. 1Design of finite element model
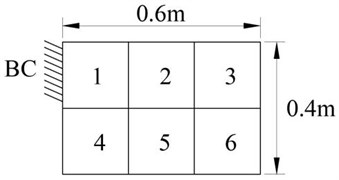
a) Geometric design of composite plate
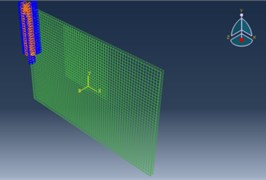
b) Finite element mesh generation of delamination damage of composite plate
The composite plate is divided into six areas, and the BC area has the fixed boundary condition that is used to eliminate the geometric symmetry of the composite plate. The composite plate is made of two materials: PVC foam and epoxy e-glass.
The diagnosis process begins with establishing a finite element model of the composite plate and extracting its mass matrix. The finite element model is then modally analyzed to obtain natural frequencies and mode shapes. Assuming that the damage reduces the stiffness of the local area by 50 %, the reference values of the natural frequency variation ratio may be calculated by Eq. (9), and the results are shown in Table 1.
Table 1Reference values of natural frequency variation ratio
1 | 2 | 3 | 4 | 5 | 6 | |
5.39 | 13.61 | 105.00 | 4.00 | 4.18 | 35.00 | |
4.56 | 41.25 | 320.00 | 2.00 | 33.45 | 170.00 | |
3.05 | 68.61 | 1215.00 | 15.38 | 155.45 | 2180.00 | |
0.85 | 3.03 | 3.05 | 0.50 | 8.00 | 4.86 | |
0.57 | 5.04 | 11.57 | 3.84 | 37.17 | 62.29 | |
0.67 | 1.66 | 3.80 | 7.69 | 4.65 | 12.82 |
The stiffness reduction is not a rigorous method for simulating delamination damage of composite plates. The delamination damage is modeled using a volume split method with finite element nodes separated by a small distance across the damage surface. In this simulation, the damage is set in Area 2 as shown in Fig. 1(b).
Table 2Natural frequencies of the composite plate before and after delamination damage
Natural frequency / Hz | First order | Second order | Third order | Fourth order |
No damage | 5.8603 | 27.316 | 39.950 | 85.438 |
Damaged | 5.7852 | 26.716 | 38.362 | 82.324 |
Table 3Damage functions of composite plate after delamination damage
1 | 2 | 3 | 4 | 5 | 6 | |
4.27 | 2.63 | 56.90 | 6.03 | 13.36 | 79.37 |
Modal analysis is used to calculate the natural frequencies before and after delamination damage as shown in Table 2. The damage functions that are calculated in Eq. (10) are shown in Table 3. The DF2 is the minimum of all the damage functions, indicating that the damage is in Area 2 and that the damaged area is correctly located. The simulation results show that the damage localization method proposed in this paper can be used for delamination damage localization of composite plates.
6. Experimental validation
An experiment is made to further verify the damage localization method. Fig. 2 shows the experiment platform. The sample is a 0.4 m×0.4 m composite plate that was customized by a yacht factory.
The Simcenter testlab system was adopted for this experiment, and the test method was called the impact testing method. A corner of the composite plate is fixed to eliminate the geometric symmetry. The composite plate is damaged after the first impact test, with the damaged area located in the upper right corner. The second impact test is then carried out. Fig. 3 shows the test results. Natural frequencies can be found in the SUM function.
Fig. 2Experiment platform and delamination damage of composite plate
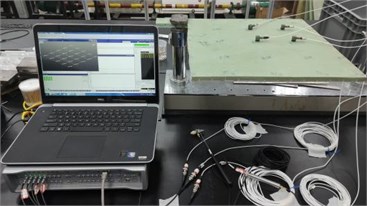
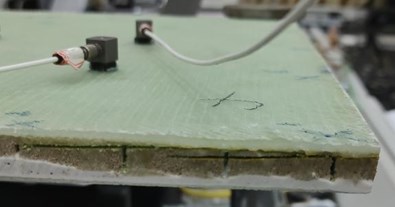
Fig. 3SUM function of composite plate before and after delamination
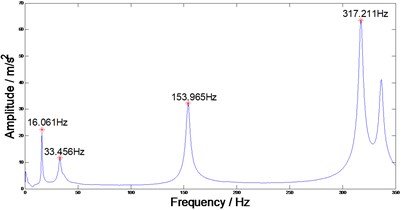
a) Before delamination
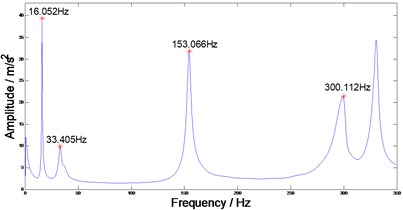
b) After delamination
The composite plate is diagnosed twice to obtain more accurate test results. First, the composite plate is divided into four areas as shown in Fig. 4(a). The damage functions are shown in Table 4. Table 4 shows that the damage is located in Area 2. Then Area 2 can be divided into four areas as shown in Fig. 4(b). As per Table 5, the damage is located in Area 22. The experiment demonstrates that the delamination damage of a composite plate may be located by using the damage function.
Fig. 4Area division for diagnosis
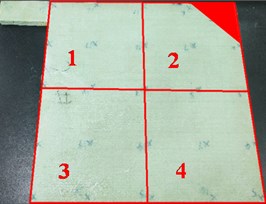
a) First area division
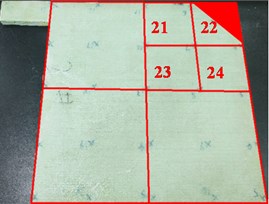
b) Second area division
Table 4Damage functions in first diagnosis
1 | 2 | 3 | 4 | |
5.51 | 5.10 | 5.87 | 14.60 |
Table 5Damage functions in second diagnosis
21 | 22 | 23 | 24 | |
6.41 | 5.91 | 6.82 | 15.52 |
7. Conclusions
It can be seen that a damage of a composite plate leads to a decrease in local stiffness, resulting in a difference in natural frequencies. However, the natural frequency variation ratio is mainly sensitive to the damage position.
A damage function has been proposed, and the damage to a composite plate can be located by comparing the values of the damage functions.
Through the simulation and experimental verification, the damage function can be used to locate the delamination damage of the composite plate.
References
-
R. Di Sante, “Fibre optic sensors for structural health monitoring of aircraft composite structures: recent advances and applications,” Sensors, Vol. 15, No. 8, pp. 18666–18713, Jul. 2015, https://doi.org/10.3390/s150818666
-
M. Mulle, A. Yudhanto, G. Lubineau, R. Yaldiz, W. Schijve, and N. Verghese, “Internal strain assessment using FBGs in a thermoplastic composite subjected to quasi-static indentation and low-velocity impact,” Composite Structures, Vol. 215, pp. 305–316, May 2019, https://doi.org/10.1016/j.compstruct.2019.02.085
-
C. Andreades, P. Mahmoodi, and F. Ciampa, “Characterisation of smart CFRP composites with embedded PZT transducers for nonlinear ultrasonic applications,” Composite Structures, Vol. 206, pp. 456–466, Dec. 2018, https://doi.org/10.1016/j.compstruct.2018.08.083
-
Wang Rong et al., “Evaluation of composite matrix crack using nonlinear ultrasonic Lamb wave detected by fiber Bragg grating,” (in Chinese), Aeronautical Manufacturing Technology, Vol. 64, No. 21, pp. 51–56, 2021, https://doi.org/10.16080/j.issn1671-833x.2021.21.051
-
A. Güemes, A. Fernandez-Lopez, A. R. Pozo, and J. Sierra-Pérez, “Structural health monitoring for advanced composite structures: a review,” Journal of Composites Science, Vol. 4, No. 1, p. 13, Jan. 2020, https://doi.org/10.3390/jcs4010013
-
G. Liu, Y. Xiao, H. Zhang, and G. Ren, “Elliptical ring distribution probability-based damage imaging method for complex aircraft structures,” Journal of Vibroengineering, Vol. 19, No. 7, pp. 4936–4952, Nov. 2017, https://doi.org/10.21595/jve.2017.17337
-
Z.-B. Yang, M.-F. Zhu, Y.-F. Lang, and X.-F. Chen, “FRF-based lamb wave phased array,” Mechanical Systems and Signal Processing, Vol. 166, p. 108462, Mar. 2022, https://doi.org/10.1016/j.ymssp.2021.108462
-
C. Fendzi, N. Mechbal, M. Rébillat, M. Guskov, and G. Coffignal, “A general Bayesian framework for ellipse-based and hyperbola-based damage localization in anisotropic composite plates,” Journal of Intelligent Material Systems and Structures, Vol. 27, No. 3, pp. 350–374, Feb. 2016, https://doi.org/10.1177/1045389x15571383
-
P. Cawley and R. D. Adams, “The location of defects in structures from measurements of natural frequencies,” The Journal of Strain Analysis for Engineering Design, Vol. 14, No. 2, pp. 49–57, Apr. 1979, https://doi.org/10.1243/03093247v14204
About this article

This work was supported by the Science and Technology Project of the Fujian Province (Nos. 2020H0018, 2021H0020).
