Abstract
The increasing demand for polymers in additive manufacturing (AM) has led to a significant increase in plastic waste, with over 300 million metric tons used in recent years. This research article explores the use of Poly Lactic Acid (PLA) as a biodegradable thermoplastic recycled material for 3D printed components, comparing its properties with virgin PLA and discussing solutions for variation and mechanical features improvement. Fused Deposition Modeling (FDM) is a widely used additive manufacturing process that allows for the creation of three-dimensional objects by depositing molten material layer by layer. This study investigates the impact of infill density, layer thickness, and raster angle for recycled 3D printing material, focusing on their dimensions and their influence on processing efficiency. This research paper aims to investigate the mechanical effects of recycled 3d printed components which are printed by using FDM with the combination of different process parameters compared with virgin PLA. From results optimal process parameters are found to enhancing quality and performance of recycled 3D printed components. Later results are compared by Analysis of Variance (ANOVA) as a statistical tool and also with ANN technique, which minimizes error deviation.
Highlights
- To compare the maximum amount of tensile load a material can bear before fracturing of PLA and recycled PLA.
- To determine the hardness properties of 3D printed parts made from PLA and recycled PLA.
- To analyze and compare the mechanical properties of PLA and recycled PLA to identify any significant differences.
- To look at how materials affect the mechanical properties of 3D printed products.
- To shed light on the possible advantages and difficulties of environmentally friendly additive manufacturing utilizing recycled PLA filaments.
- To spread awareness of environmentally friendly 3D printing methods and promote the use of reusable sustainable material alternatives.
1. Introduction
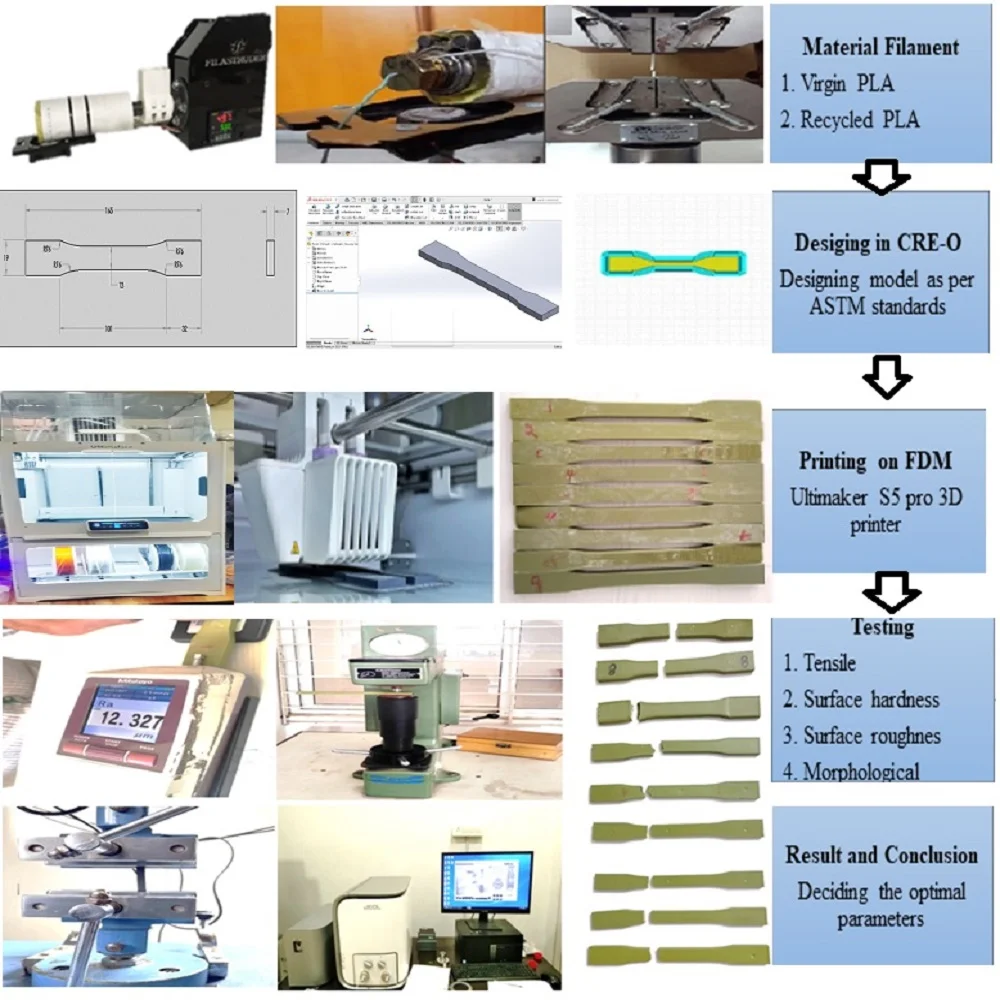
Additive manufacturing technology includes Fused Deposition Modeling (FDM), Direct Metal Deposition (DMD), 3D printing, Selective Laser Sintering (SLS), Ink-Jet Modeling (IJM), and Stereo-Lithography (SLA). FDM is widely used due to its user-friendly working principle and functional prototypes in thermoplastics. It is developed by Stratasys Inc. in 1990 [1]. Thermoplastic Elastomers (TPE) with the recycling properties of plastics and flexibility of rubber are widely adopted across many different areas, including automotive vehicles, consumer electronics, medicine, foods, cable and wires, and daily commodities. In automobiles, TPEs are contributing to lighter vehicle weight for better fuel efficiency. With the increase in awareness of environmentally friendly materials, TPE material plays a very important role in replacing vulcanized rubber and flexible polyvinyl chloride [2]. PLA performs best at 0.1 mm/60 min/90 °C, while PETG and PETGCF achieve optimal strength [3]. To improve the mechanical properties and surface quality of PLA FFF parts, enhancing surface and forming quality [4] expanding additive manufacturing for sacrificial cladding affects structural parameters, causing higher peak forces [5]. Impact on metal-polymer composites, finding optimal processing variables, and revealing 20 % aluminum enhances tensile strength, yield, and ductility [6]. Tribological characteristics of 3D-printed textured samples using FDM for ABS and PLA polymers [7]. Fused filament fabrication enhances mechanical and thermal properties in polymer-based composites, with isotropic thermal diffusivity and analyses of radial extrudate temperature distribution in thermoplastic filament extrusion additive manufacturing, finding a maximum 300 °C/mm gradient for local thermal conduction [8]. Additive manufacturing uses deposition, consolidation, and selective laser sintering for complex shapes in polymeric parts [9]. Artificial intelligence (AI) research has been utilized to simulate difficult issues in the computer, physical sciences, engineering, and statistics fields in recent years. ANN is a learning-based information processing tool for pattern recognition, data classification, and application-based problems [11]. MATLAB toolkit, MLP neural network model, and feed-forward backpropagation algorithm for precise forecasting, utilizing activation functions and learning procedures for accurate code implementation. AI research simulates complex issues in various fields [12], [13]. MLP neural network consists of three layers: input, hidden, and output. The function of hidden neurons depends on input and weights between input and hidden components. The hidden layer can be chosen by modifying these weights. The model uses a back-propagation algorithm and gradient descent training function with an adaptive learning rate. It has 10 hidden neurons in the hidden layer, considering cycle boundaries, and ultimate tensile strength as input and output layers [13]. After considering all above data a detailed methodology as shown in Fig. 1 has planned to investigate the properties on recycled PLA filament.
Fig. 1Methodology
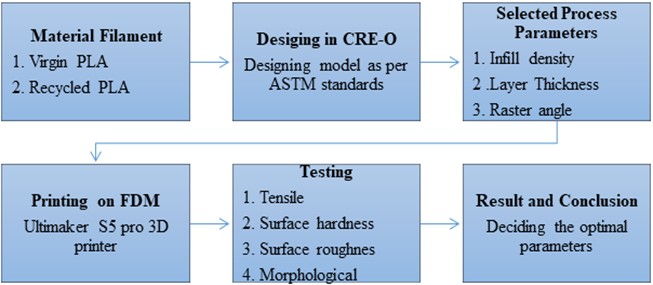
2. Methodology
2.1. Filament extrusion
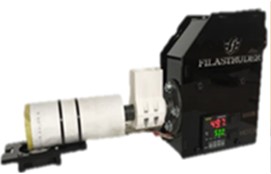
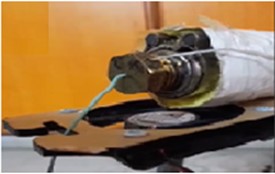
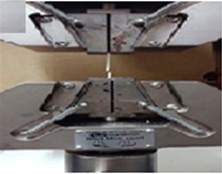
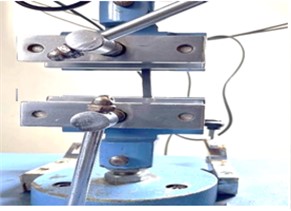
PLA, a popular material economically produced from renewable resources, has the highest consumption volume of any bioplastic in present decade. PLA is widely used in 3D printing due to its low melting point, high strength and biodegradable compared to other materials. After testing of virgin PLA components were then turned into small chips, set the extrusion temperature and given it time to warm up, fill the hopper with pellets/small chips and run the motor shown in Fig. 2(a). The Filastruder filament extruder begins shown Fig. 2(b), creating a pile for later spooling and tested on UTM as shown in Fig. 2(c) and the properites of filament in Table 1.
Fig. 2a) Filastruder, b) filament extruding through nozzle, c) filament testing UTM
a)
b)
c)
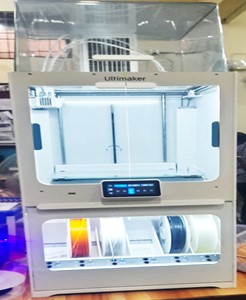
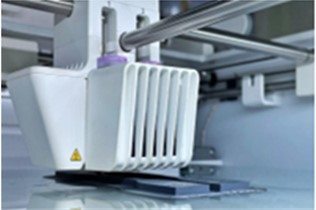
By using the filament printed recycled PLA filaments specimens are printed using of Ulitimaker S5 pro 3D Printer as shown in Fig. 3. The increase in recycling cycles leads to a stiffening and brittleness of PLA.
Table 1Properties of Virgin PLA and Recycled PLA filament
Properties | PLA | Recycled PLA |
Extrusion temperature (°C) | 190–210 | 190–210 |
Density (g/cm3) | 1.25 | 1.25 |
Tensile strength (MPa) | 30.21±0.89 | 29.47±1.21 |
Flexural strength (MPa) | 64.48±2.49 | 57.55±1.97 |
Biodegradability | Yes | Yes |
Fume toxicity | Very low | Very low |
Fig. 3Ultimaker S5 pro 3D printer
2.2. Process parameters considered
The raster angle is the rise of the raster pattern in the lowest layer, ranging from 0° to 90° shown in Fig. 4. A proper raster angle is crucial for optimal results. Raster width is the width of material droplets, varying based on nozzle tip size. Fiber position and axial load affect specimens' reactions. Raster angles with higher fiber orientations show better tensile and compressive strength.
Layer thickness affects the strength of the component. Thinner layers result in higher temperature gradients, improved diffusion, and load-bearing. Low print speed enhances bonding with previous layers. Increased layers increase cooling and heating cycles, leading to stress accumulation and distortion. A moderate thickness value is generally the optimal parameter in research shown in Fig. 5.
FDM parts’ mass and strength depend on infill density. Lower density saves cost and reduces weight, but generates more voids, increasing porosity and decreasing mechanical properties. As shown in Fig. 6.
Fig. 4Raster angle
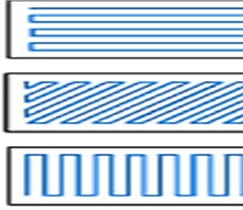
Fig. 5Layer thickness
Fig. 6Infill density
2.3. Design, experimental and testing
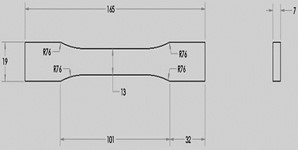
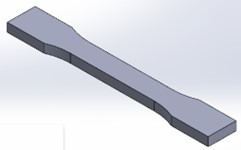
For tensile specimen as per ASTM standards D638 Type 1, modeling was done in Solid works version 22, 2d and 3d modelled figure shown in Fig. 7(a, b). By using slicing software Ultimaker Cura 5.5.0. 3d model converted in to G-Code after applying the selected FDM parameters shown in Fig. 7(c) and fixed parameters are Speed-50 mm/s, Print temperature –2100 °C, Bed temperature 600 °C.
Fig. 7a) 2d design b) design in solid c) convert model into G-Code
a)
b)

c)
By objectively arranging the parameters selected for this paper, DOE may be a very useful tool for improving the designs of products and processes, analysing the impacts of various parameters on performance, and resolving production issues. Here for this study software Minitab 18 is used, by considering the 3 factors a and 3 levels are shown in Table 2 L9 taguchi array is opted and L9 Table 3 as shown in below.
Table 2Input process parameters
Process parameters | Low | Medium | High |
Raster angle (00) | 0 | 45 | 90 |
Layer Thickness (mm) | 0.12 | 0.18 | 0.30 |
Infill density (%) | 20 | 60 | 100 |
Table 3L9 array parameters
Sample No. | Raster angle (°) | Infill density (%) | Layer thickness (mm) |
1 | 0 | 20 | 0.12 |
2 | 0 | 60 | 0.18 |
3 | 0 | 100 | 0.30 |
4 | 45 | 20 | 0.18 |
5 | 45 | 60 | 0.30 |
6 | 45 | 100 | 0.12 |
7 | 90 | 20 | 0.30 |
8 | 90 | 60 | 0.12 |
9 | 90 | 100 | 0.18 |
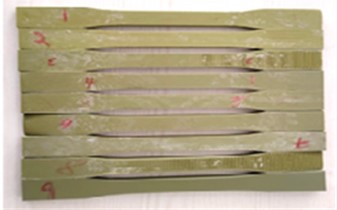
Fig. 8a) Ultimaker S5 pro 3D printer, b) printed L9 Specimens
a)
b)
By using above parameters, generated g-codes for 9 specimens by using cura 5.5.0 slicing software after that G-codes are sent to 3d Printer Ultimaker S5 pro-3D printer to print the specimens and printed specimens are shown in Fig. 8(a, b).
3. Results and discussion
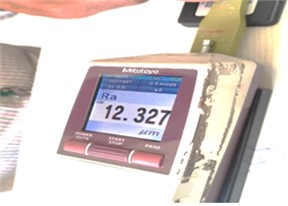
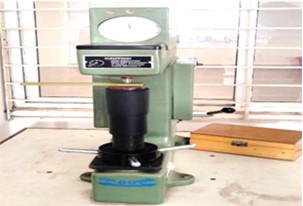
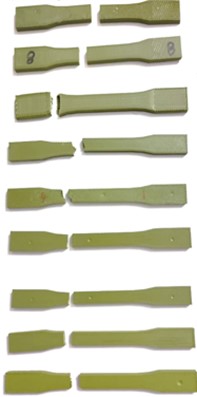
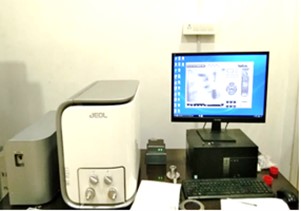
After printing specimens are under went for Surface tests to check the roughness of the profile of specimen, hardness of the specimen, strength and ductility was found by using an FIE Make Universal Testing Machine and by using SEM found the microstructural behaviour of specimen as shown in Fig. 9(a-d).
Fig. 9a) Surface roughness, b) hardness, c) UTM, d) SEM, e) specimen after testing
a)
b)
e)
c)
d)
Table 4Experimental results of surface roughness and hardness
Sample No. | Virgin PLA tensile | Recycle PLA tensile | Virgin PLA surface | Recycled PLA surface | Virgin PLA hardness | Recycle PLA hardness |
1 | 14.58 | 12.04 | 3.99 | 5.71 | 48 | 33 |
2 | 17.07 | 14.97 | 3.95 | 3.71 | 32 | 28 |
3 | 16.09 | 15.70 | 10.24 | 13.3 | 67 | 51 |
4 | 35.67 | 20.18 | 4.06 | 5.53 | 50 | 38 |
5 | 27.14 | 22.65 | 3.98 | 9.22 | 42 | 46 |
6 | 18.52 | 36.18 | 17.02 | 15.5 | 51 | 59 |
7 | 44.31 | 38.54 | 5.17 | 8.58 | 43 | 26 |
8 | 59.59 | 40.25 | 3.75 | 3.26 | 27 | 22 |
9 | 14.58 | 12.04 | 15.39 | 12.08 | 52 | 66 |
From the Table 4:
1) Compare to all specimens for Virgin PLA tensile strength is maximum 59.59 MPa for sample 8 and minimum of 14.58 MPa whereas for recycled PLA samples maximum of 40.25 MPa got for sample 8 and lesser strength for sample 1 which is 12.04 MPa.
2) For sample 1, hardness shore D of virgin PLA sample 8 got minimum (27) and maximum for sample 6 (51) and for Recycled PLA sample also got minimum (22) and maximum for sample 6 (59).
3) For profile the surface roughness is minimum 3.75 for sample 8 whereas maximum 17.02 for sample 6 compare to all virgin PLA specimens as well as for recycled PLA sample number 8 got minimum surface roughness of 3.26 and maximum (15.5) for sample 6.
4) From the table it is observed that higher raster angle, medium infill density and lesser layer thickness got good sample strength, hardness and surface profile whereas the lower raster angle, lower infill percentage and higher layer thickness got low sample strength, maximum hardness and surface roughness for both virgin PLA and recycled PLA samples.
After finding experimental data of printed specimens in Fig. 9(e) entered in to the minitab to find out the model was significant or not. By regression it was found that for both virgin and recycled samples are found that model significant as shown in Table 5. For Virgin PLA the parameter raster angle got 0.005, hence it is less than 0.05 so it is significant and other two parameters infill density and layer thickness got > 0.05 so they are not significant. Similarly for Recycled PLa the parameters infill and layer thickness also got > 0.05 so they are insignificant and raster angle got 0.001 which is < 0.05 so the parameter is significant.
Table 5Virgin-tensile experimental versus infill, raster, layer thickness
Virgin PLA | Recycle PLA | |||||||||
Source | DF | Adj SS | Adj MS | F-Value | P-Value | DF | Adj SS | Adj MS | F-Value | P-Value |
Regression | 3 | 1585.50 | 528.50 | 7.67 | 0.026* | 3 | 995.37 | 331.79 | 20.24 | 0.003* |
Infill density | 1 | 73.63 | 73.63 | 1.07 | 0.349 | 1 | 62.02 | 62.02 | 3.78 | 0.109 |
Raster angle | 1 | 1507.02 | 1507.02 | 21.86 | 0.005* | 1 | 918.84 | 918.84 | 56.04 | 0.001* |
Layer thickness | 1 | 4.85 | 4.85 | 0.07 | 0.801 | 1 | 14.50 | 14.50 | 0.88 | 0.390 |
Error | 5 | 344.62 | 68.92 | 5 | 81.98 | 16.40 | ||||
Total | 8 | 1930.12 | 8 | 1077.35 | ||||||
From the Table 5 it concluded that the raster angle is the most important role while printing the specimens for commercial available filament. Where as for recycled PLA filament also got the same parameter got significant. By comparing both virgin and recycled filament it was concluded that the specimen printing with raster angle is sustainable under strength, hardness and surface of the specimen.
Table 6Data sets for preparing model
Sample No | Tag | VE* | VP* | Error | Good/Bad | RE* | RP* | Error | Good/Bad |
1 | Test | 14.58 | 16.83 | –2.2 | Good | 12.04 | 26.50 | –14.5 | Good |
2 | Train | 17.07 | 17.07 | 0.0 | 14.97 | 14.97 | 0.0 | ||
3 | Validation | 16.09 | 12.31 | 3.8 | 15.70 | –1.76 | 17.5 | ||
4 | Train | 35.67 | 35.67 | 0.0 | 20.18 | 20.18 | 0.0 | ||
5 | Train | 27.14 | 27.14 | 0.0 | 22.65 | 22.65 | 0.0 | ||
6 | Train | 18.52 | 18.52 | 0.0 | 36.18 | 36.18 | 0.0 | ||
7 | Validation | 44.31 | 51.75 | –7.4 | 38.54 | 52.85 | –14.3 | ||
8 | Test | 59.59 | 53.97 | 5.62 | Good | 40.25 | 29.73 | 10.5 | Good |
9 | Train | 38.94 | 38.93 | 0.0 | 38.17 | 38.17 | 0.0 | ||
*VE-Virgin Experimental; VP-Virgin Predict; RE-Recycle Experimental; RP-Recycle Predict | |||||||||
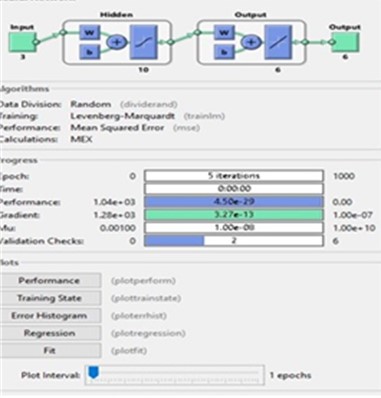
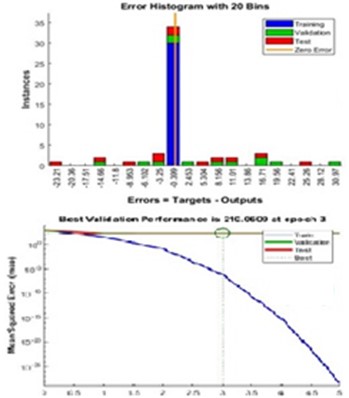
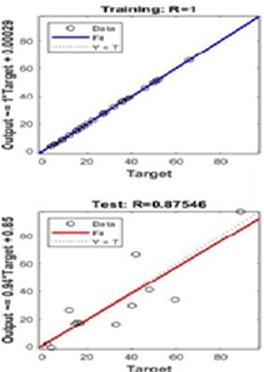
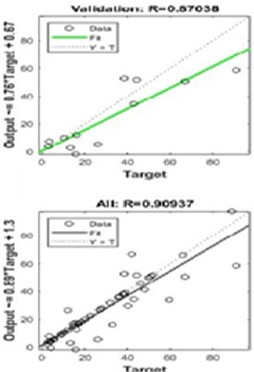
This research aims to minimize material of specimen to be print by changing the printer parameters compare to the standard one. By determining the optimal input parameters using a hybrid artificial neural network and particle swarm algorithm. 09 samples were Printed by interchanging the selected process parameter using a three-dimensional printer and mechanical tests were performed. One of the researchers using the parameters of nozzle temperature, layer thickness, printing speed, nozzle diameter, and material density were tested, and the optimal combination of input parameters was extracted. [10] A total of 9 data sets are taken for modeling purposes on a random basis in the subdivision of 50 % training, 25 % validation and 25 % test stages. LM algorithm is used to test the model with the given data tests and predict the parameters of the samples. After that, the predicted results are compared with experimental results. From Fig. 10(a) shows the NN training window, the data divided randomly, the LM algorithm is used for training and MSE is for the model’s performance. The difference between actual and predicted results is called linear regression. Fig. 10(b) shows the validation performance error between the actual and predicted results, the best performance validation of MSE is 210.0609 at epoch 3 out of 5 epochs. Fig. 10(c) Minimum error is represented by a line and efficiency of the method used ANN. From Fig. 10(d) it is concluded that the actual result and predict results for the Exercising R-value is 1, for the authentication R-value is 0.87038, and for Trial R-value is 0.87546. ANN predicted model R-value is 0.90937 and this value matches with given targets. Table 6 displays the input parameters taken to build the model and then found out the strengths of the model universal tensile machine later to minimize the error between actual and predicted values by using ANN. Data sets at Train, Validation, and Test conclude that the possible predict outcome by using neural network.
Fig. 10Neural network: a) training window, b) error histogram, c) performance, d) regression plot
a)
b)
c)
d)
From Table 6 comparing all the data sets of train, test, and validation proves the possibility among real and projected results of UTM from all three phases. It can be said that the NN model is possible to print the model for both virgin and recycled PLA models having good strength at parameters are (20 %, 60 %) infill parameters, (0°, 90°) Raster angle and Layer thickness is 120 microns.
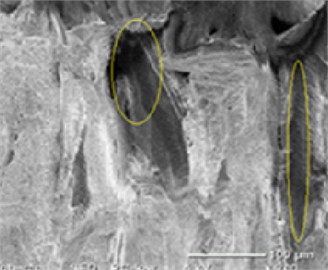
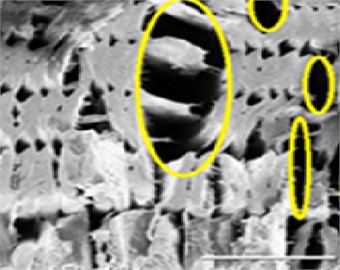
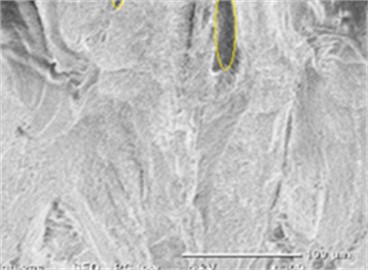
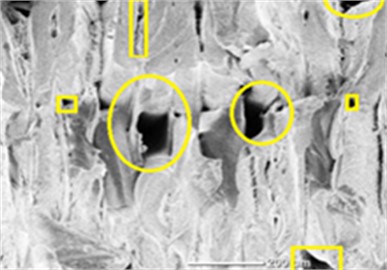
From Fig. 11(a, b) SEM image of sample, no 8 which obtained the highest tensile strength among all the specimens. In this SEM image, we can see the elongation of the recycled PLA polymer. The marked part of the image shows the elongation of the layers both on the surface and inside the specimen. In the above SEM image Fig. 12(a, b), sample no 1 we can see that Porosity has been developed between the layers. The mechanical properties of the specimen, including tensile strength, young's modulus, and poison's ratio, are reduced when porosity occurs. The failure of the specimen could be caused by porosity. SEM pictures showed holes in the air. These gaps affected the heat dissipation during manufacture, which led to residual strains. The mechanical properties of the test parts were negatively impacted as a result.
Fig. 11Recycled PLA – sample 1: a) on surface b), inside specimen
a)
b)
Fig. 12Recycled PLA – sample 8: a) on surface, b) inside specimen
a)
b)
4. Conclusions
This paper mainly planned to find optimized parameter to get good strength, hardness and surface finish for recycled PLA compare to virgin PLA. Samples were printed using FFF and tested. The outcome of printing parameters, raster angle, infill percentage and layer thickness were considered and recognized. Observed from the results recycled PLA samples got good tensile strength compared to virgin PLA samples, for both recycled and virgin PLA the tensile strength is highly impacted for the higher raster angle and medium infill percentage compare to the lower raster and lower infill percentage. Raster angle 90°, infill percentage 60 % and layer thickness 0.12 mm got good sample strength, minimum hardness and surface roughness compare to all other parameters. When compare with virgin, recycled samples also got good surface finish and also got minimum hardness. The difference between virgin 3d printed samples and recycled one are for tensile strength 19.34 %, 0.49 % for surface roughness and 5 % for hardness.
From ANOVA it is observed that for both virgin (0.005) and recycled PLA (0.003) the P-Value got < 0.05 for raster angle so it is concluded that it is significant parameter, whereas other two parameters are not significant.
From ANN, the model’s higher correlation coefficient between actual outcomes and predicted outcomes is 0.95, indicating satisfactory predictive results compared to experimental results and process parameters making it the most preferable statistical approach.
By all the above results finally concluding that compare with virgin material the specimens printed recycled PLA also is sustainable with strength, good surface finish and hardness.
Compared with origin PLA, air gaps are visible in SEM pictures, which have a detrimental effect on test samples mechanical characteristics by reducing heat dissipation and creating residual stresses.
References
-
I. Gibson, D. Rosen, and B. Stucker, Additive Manufacturing Technologies. New York, NY: Springer New York, 2015, https://doi.org/10.1007/978-1-4939-2113-3
-
S. Soe, M. Ryan, G. Mcshane, and P. Theobald, “Energy absorbing characteristics of additively manufactured TPE cellular structures,” InImpact: The Journal of Innovation Impact, Vol. 8, No. 2, p. 145, 2016.
-
J. R. Stojković et al., “An experimental study on the impact of layer height and annealing parameters on the tensile strength and dimensional accuracy of FDM 3D printed parts,” Materials, Vol. 16, No. 13, p. 4574, Jun. 2023, https://doi.org/10.3390/ma16134574
-
Y. Siyajeu, S. Jiang, B. Wen, and H. Li, “Investigation on the improvement of mechanical properties and surface quality of the polylactic acid (PLA) fused filament fabrication parts manufactured without and with vibrations dependent utilization,” Journal of the Mechanical Behavior of Biomedical Materials, Vol. 143, p. 105949, Jul. 2023, https://doi.org/10.1016/j.jmbbm.2023.105949
-
D. Tsamos et al., “Impact-dissipating capacity of fiber-reinforced polymer samples, fabricated by fused filament fabrication,” Journal of Materials Engineering and Performance, Vol. 32, No. 22, pp. 10057–10063, Jun. 2023, https://doi.org/10.1007/s11665-023-08382-7
-
D. L. Vinay et al., “Parametric analysis of processing variables for enhanced adhesion in metal-polymer composites fabricated by fused deposition modeling,” Journal of Adhesion Science and Technology, Vol. 38, No. 3, pp. 331–354, Jun. 2023, https://doi.org/10.1080/01694243.2023.2228496
-
V. Mourya, S. P. Bhore, and P. G. Wandale, “Multiobjective optimization of tribological characteristics of 3D printed texture surfaces for ABS and PLA Polymers,” Journal of Thermoplastic Composite Materials, Vol. 37, No. 2, pp. 772–799, Jun. 2023, https://doi.org/10.1177/08927057231185710
-
J. Zhang, F. Meng, and E. Ferraris, “Temperature gradient at the nozzle outlet in material extrusion additive manufacturing with thermoplastic filament,” Additive Manufacturing, Vol. 73, p. 103660, Jul. 2023, https://doi.org/10.1016/j.addma.2023.103660
-
C. Morano and L. Pagnotta, “Additive manufactured parts produced by selective laser sintering technology: porosity formation mechanisms,” Journal of Polymer Engineering, Vol. 43, No. 6, pp. 537–555, Jul. 2023, https://doi.org/10.1515/polyeng-2023-0028
-
M. Shirmohammadi, S. J. Goushchi, and P. M. Keshtiban, “Optimization of 3D printing process parameters to minimize surface roughness with hybrid artificial neural network model and particle swarm algorithm,” Progress in Additive Manufacturing, Vol. 6, No. 2, pp. 199–215, Feb. 2021, https://doi.org/10.1007/s40964-021-00166-6
-
S. D. Grozav, A. D. Sterca, M. Kočiško, M. Pollák, and V. Ceclan, “Artificial neural network-based predictive model for finite element analysis of additive-manufactured components,” Machines, Vol. 11, No. 5, p. 547, May 2023, https://doi.org/10.3390/machines11050547
-
O. Ulkir and G. Akgun, “Predicting and optimising the surface roughness of additive manufactured parts using an artificial neural network model and genetic algorithm,” Science and Technology of Welding and Joining, Vol. 28, No. 7, pp. 548–557, Oct. 2023, https://doi.org/10.1080/13621718.2023.2200572
-
M. Moradi, R. Beygi, N. Mohd. Yusof, A. Amiri, L. F. M. Da Silva, and S. Sharif, “3D printing of acrylonitrile butadiene styrene by fused deposition modeling: artificial neural network and response surface method analyses,” Journal of Materials Engineering and Performance, Vol. 32, No. 4, pp. 2016–2028, Aug. 2022, https://doi.org/10.1007/s11665-022-07250-0
-
P. V. R. Girish Kumar and K. Devaki Devi, “Impact of compression and bending behavior on fused deposition modeling of 3D printed components,” Materials Today: Proceedings, Vol. 92, pp. 554–560, Jan. 2023, https://doi.org/10.1016/j.matpr.2023.03.764
Cited by
About this article

The authors have not disclosed any funding.
The datasets generated during and/or analyzed during the current study are available from the corresponding author on reasonable request.
PVR Girish Kumar: conceptualization, methodology, data curation, writing-original draft preparation, visualization, investigation. Dr. K. Devaki Devi: supervision.
The authors declare that they have no conflict of interest.
