Abstract
With the development of highway construction, alluvial silt is gradually used as roadbed filler, but its dynamic characteristics are less studied. Based on the highway section from Luanzhou to Qingtuoying of G508, the plastic strain and dynamic stress-dynamic strain development law of alluvial silty sand under cyclic loading are analyzed by GDS dynamic triaxial test. The results show that under the action of a small range of dynamic stress amplitude, the soil sample is not destroyed, and the number of cycles is 1000 times, which is the critical point at which the axial total strain gradually tends to be stable. When the dynamic stress amplitude is 300 kPa, the total axial strain increases linearly, and the soil sample is destroyed. The cumulative plastic strain of the alluvial silt is the smallest when the optimum water content is 8.0 %, the confining pressure is 80 kPa, and the frequency is 1Hz.At this time, the cyclic load has a dense effect on the soil, and the soil structure does not fail. The dynamic stress-strain relationship of alluvial silty sand conforms to the R. L. Kondner hyperbolic model. The greater the confining pressure and the closer the moisture content to the optimal moisture content, the greater the dynamic strength. The research results are helpful to provide reference for other similar projects.
Highlights
- The dynamic characteristics of diluvial silty soil are studied, which makes up for the shortcomings of existing studies.
- The cumulative plastic deformation of diluvial silty soil under traffic cyclic dynamic load with different moisture content, confining pressure and frequency is analyzed.
- The fitting analysis of the dynamic stress-dynamic strain model of the diluvial silty soil is carried out, which accords with the R. L. Kondner model.
1. Introduction
With the development of the transportation industry, the scale of the road network has gradually expanded, and the highway planning lines have gradually deepened into areas with poor environment and special soil. For the roadbed in special areas, it is essential to make full use of the surrounding special soil as the roadbed filler and master its dynamic characteristics. At present, the rapid development of highway construction has also led to the progress of the study of alluvial silt as roadbed filler. How to use the pluvial silt is also a direction that needs to be continuously explored in road construction.
As a kind of dynamic load, traffic load will change with time. In the whole process of change, two effects need to be considered: one is the rate effect, and the other is the cyclic effect. Xu Yunzhe [1] analyzed the stability of silty sand subgrade slope by finite element simulation. The research results provide a strong theoretical basis for the construction of silty sand subgrade. Xi Chen [2] proposed to improve the silt soil with fly ash, and studied the dynamic characteristics of the roadbed, which is beneficial to the reference of practical engineering. Qiu Wenli et al. [3] carried out dry-wet cycle test, direct shear test and consolidation test on silty sand subgrade filler and obtained the reason for the decay of strength characteristics of silty sand. Through the freeze-thaw cycle test of silty sand subgrade, Bu Wenjie [4] found that the frost heave and thaw settlement deformation of silty sand subgrade can be reduced by improving the compaction degree and enhancing the drainage capacity. Salour, F. et al. [5] used a permanent deformation prediction model to characterize the permanent deformation accumulation of multi-stage triaxial repeated load test of unsaturated silty sand subgrade. Wang Shengnian et al. [6] conducted a study on improving the permeability resistance and reducing the amount of cement by adding cement to silty sand soil, and the conclusion provided a theoretical reference for subsequent similar projects. Yuan Yuqing et al. [7] added cement, fly ash and lime into silty soil and studied the engineering characteristics of the improved subgrade seasoning through dynamic triaxial tests.
At present, the research on alluvial silty sand is mostly carried out in the direction of improving silty sand, but there are few studies on its engineering characteristics as subgrade soil. In this paper, the development law of plastic deformation under different water content, different confining pressure and different dynamic load frequency is analyzed by using GDS dynamic triaxial test equipment with alluvial silt as raw material, and the water content and frequency which have the least influence on soil structure (soil sample is not damaged) are defined. At the same time, the variation characteristics of dynamic stress-dynamic strain are fitted to clarify its development and change law, which provides a reliable theoretical basis for the feasibility of alluvial silt as roadbed filler.
2. Test soil sample
The soil of this test is mainly taken from the alluvial silty sand in the Chicao expressway area. The uneven coefficient of the soil sample is 7.43, the curvature coefficient 2.42, 5,1 3, which is a well-graded soil sample. According to the relevant engineering technical specifications, the compaction test of the test soil was carried out. The maximum dry density of the alluvial silt was 1.975 g/cm3, and the optimum water content was 8.0 %.
3. Test scheme
3.1. Test apparatus
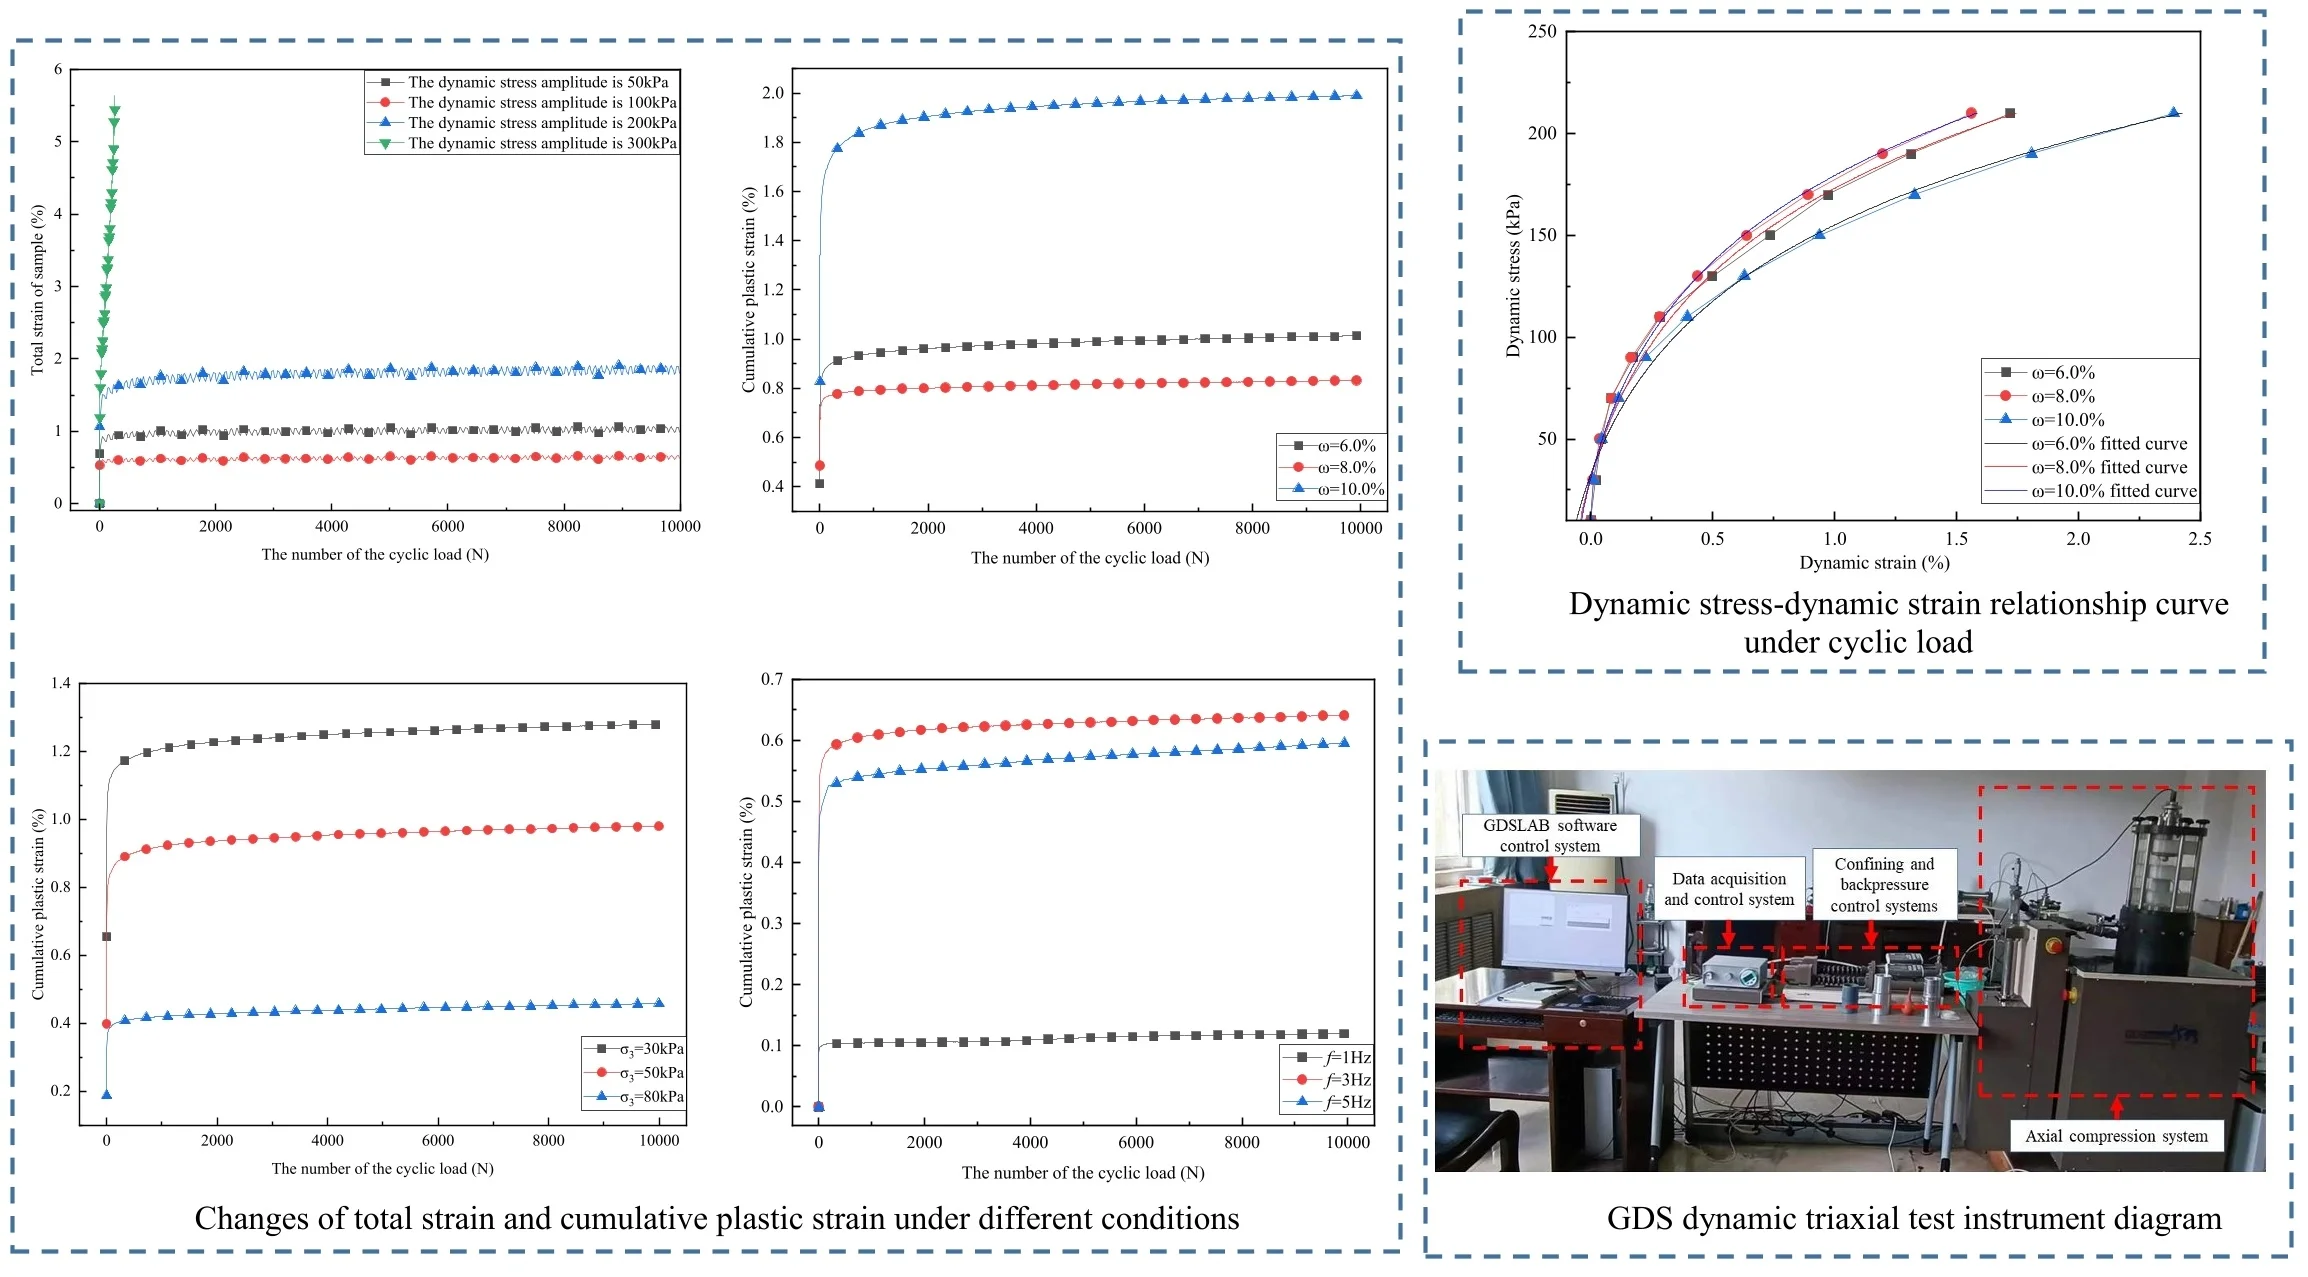
The test adopted the dynamic triaxial instrument produced by British GDS Company, which could apply a maximum ±10 kN dynamic axial load, the frequency range was 0-5 Hz, the maximum deformation of the sample was 100 mm, and the displacement resolution was 0.208 mm. The experimental device was shown in Fig. 1.
Fig. 1GDS dynamic triaxial test instrument diagram
3.2. Sample preparation
Before sample preparation, the soil should be dried, passed through a 2 mm sieve, and then prepared the reshaped soil sample. Since the optimal moisture content of the soil sample is 8.0 %, the three moisture contents of 6.0 %, 8.0 % and 10.0 % are set on the basis of ±2.0 % of the optimal moisture content. After the soil sample is sieved, the calculation, ratio and stew are carried out for 24 h according to different moisture content, and then the sample is compacted in 5 layers, each layer is 2 cm, and the size of the sample is 50×100 mm standard cylinder.
3.3. Specific test plan
Existing studies have shown that the propagation of vehicle load inside the subgrade is similar to a non-bidirectional sine wave in a single pulse mode [8]. Therefore, the loading waveform adopted in this test is sinusoidal waveform, and the loading frequency is selected as 1 Hz, 3 Hz and 5 Hz. Previous research results show that the lateral pressure of the surface layer of the subgrade subgrade is within the range of 25-80 kPa. Therefore, the confining pressure conditions selected in this paper are 30 kPa, 50 kPa and 80 kPa. The consolidation ratio of 1.5 was selected as the experimental condition. The specific test plan is shown in Table 1.
Table 1Dynamic triaxial test scheme
Group class | Moisture content | Confining pressure | Frequency | Consolidation ratio |
1 | 6.0 %, 8.0 %, 10.0 % | 50 kPa | 1 Hz | 1.5 |
2 | 8.0 % | 30 kPa, 50 kPa, 80 kPa | 1 Hz | |
3 | 8.0 % | 50 kPa | 1 Hz, 3 Hz, 5 Hz |
4. Analysis of test results
4.1. Development law of total axial strain
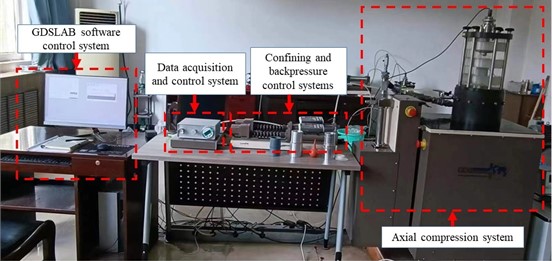
The soil sample will produce corresponding strain after applying the load, and the stress state of the soil sample will also change accordingly. The dynamic stress amplitude is different, and the strain generated by the soil sample is also different. Fig. 2 shows that under the condition of confining pressure of 50 kPa, the total axial strain of alluvial silty sand changes with the number of vibrations under different dynamic stress amplitudes.
Fig. 2Development curve of total axial strain with the number of the cyclic load
As can be seen from Fig. 2, under the conditions of confining pressure of 50 kPa and water content of 8.0 %, and dynamic stress amplitude of 50, 100 and 200 kPa, the total axial strain of the soil sample eventually tends to be stable with the increase of vibration cycles. In the first stage (before 1000 cycles), the total strain of the sample increases rapidly, and in the second stage (after 1000 cycles), the growth rate of the total axial strain gradually decreases until it becomes stable. When the dynamic stress amplitude is 300 kPa, the total axial strain of the soil sample has no stable stage, and the failure occurs directly. The reason for this phenomenon is that the internal structure of the soil mass cannot be changed under the action of the dynamic stress amplitude in a small range, and the sample cannot be intrinsically damaged during the resonance of the soil mass. With the increase of the number of vibration cycles, the interior of the soil mass becomes dense, the internal structure gradually becomes stable, the soil skeleton no longer changes, and the sample will not be damaged.
4.2. Cumulative plastic strain development law
The irreversible plastic strain in alluvial silty sand is mainly caused by two factors: the change of skeleton structure between soil particles and the fragmentation of particles themselves. Different water content, confining pressure and dynamic load frequency will affect the cumulative plastic strain of soil samples.
4.2.1. Relationship between cumulative plastic strain and water content
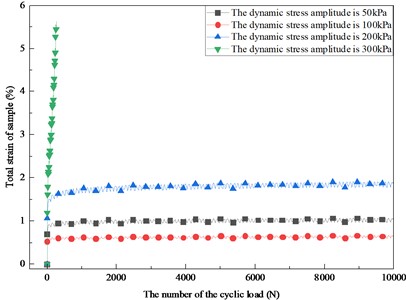
Fig. 3 shows the change of cumulative plastic strain with vibration times under different water content when the confining pressure is 50 kPa.
It can be seen from Fig. 3 that when the moisture content of the soil sample is 8 %, the final cumulative plastic strain is the smallest; when the moisture content of the soil sample is 10 %, the final cumulative plastic strain is the largest. Therefore, the relationship between the cumulative plastic deformation of the soil sample and the moisture content is obtained, that is, 10 % > 6 % > 8 %. It shows that the structure of silty sand is the most stable when the water content is the best water content. When the water content is higher or lower than the optimum water content, with the increase of water content, the cumulative plastic strain of silty sand increases, and the soil sample structure is more likely to be destroyed.
Fig. 3Development curve of cumulative plastic strain with the number of the cyclic load
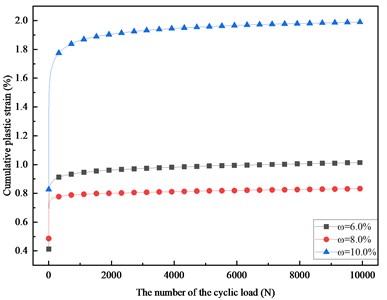
Fig. 4Development curve of cumulative plastic strain with the number of the cyclic load
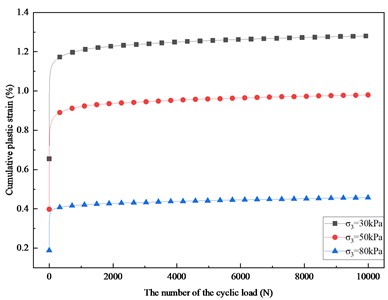
4.2.2. Relationship between cumulative plastic strain and confining pressure
Fig. 4 shows the changes of cumulative plastic strain with vibration times under different confining pressures when the sample water content is 8.0 %.
It can be seen from Fig. 4 that under the same confining pressure, with the increase of the number of vibration cycles, the cumulative plastic strain will stabilize at a fixed value when the number of vibrations reaches a certain value. When the confining pressure is 30 kPa, the final cumulative plastic strain is the largest, and when the confining pressure is 80 kPa, the final cumulative plastic strain is the smallest. For the soil sample with a confining pressure of 30 kPa, when the number of load vibrations is 10000 times, the cumulative plastic deformation is 310.2 % of the confining pressure of 80 kPa, which is 121.6 % of the confining pressure of 50 kPa under the same conditions.
4.2.3. Relationship between cumulative plastic strain and frequency
Fig. 5 shows the change of cumulative plastic strain with vibration times at different frequencies when the water content of the sample is 8.0 % and the confining pressure is 50 kPa.
It can be seen from Fig. 5 that when the number of vibrations reaches 3000 times, the cumulative plastic strain of the soil sample has stabilized at a certain fixed value. Under the same conditions, the cumulative plastic deformation caused by different frequencies is 3 Hz > 5 Hz > 1 Hz. The reason is that at a lower frequency, the applied dynamic load has the effect of densification, and the compaction effect of the soil is better. With the increase of the frequency of the load, the dynamic stress generated by the external load has the ability to destroy, resulting in the maximum deformation of the soil sample, and the irreversible deformation becomes larger.
Fig. 5Development curve of cumulative plastic strain with the number of the cyclic load
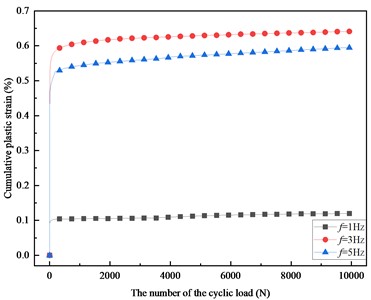
Fig. 6Dynamic stress-dynamic strain relationship curve under cyclic load
4.3. Dynamic stress-dynamic strain relationship curve
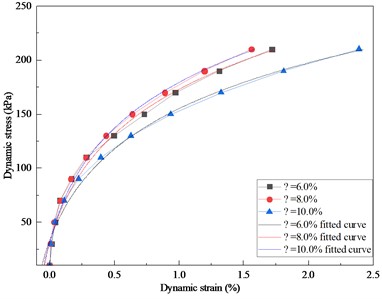
Fig. 6 shows the test curve and fitting curve of dynamic stress and strain under cyclic load with different water content as an example.
As can be seen from Fig. 6, under different water content conditions, dynamic stress-dynamic strain relationship presents a trend of nonlinear increase, and the relationship symbols can be simulated by R. L. Kondner hyperbolic model:
The meaning of the parameters in the formula: is dynamic stress, is dynamic strain, and are uncertain parameters under the test. Table 2 shows the sum of uncertain parameters under different test conditions. It can be seen from Table 2 that the determination coefficients are all greater than 0.95, indicating that it is appropriate to use the R. L. Kondner hyperbolic model to describe the dynamic stress-dynamic strain relationship of alluvial silty sand.
Table 2Dynamic stress and dynamic strain curve parameters under different working conditions
Group class | Confining pressure | Moisture content | |||
1 | 30 kPa | 8.0 % | 8.47E-6 | 4.31E-3 | 0.9686 |
2 | 50 kPa | 8.0 % | 6.32E-6 | 6.32E-3 | 0.9535 |
3 | 80 kPa | 8.0 % | 5.19E-6 | 7.12E-3 | 0.969 |
4 | 50 kPa | 6.0 % | 6.89E-6 | 6.73E-3 | 0.9578 |
5 | 0 kPa | 10.0 % | 7.64E-6 | 4.69E-3 | 0.9610 |
5. Conclusions
In this paper, the strain characteristics of alluvial silty sand subgrade under different water content, different confining pressure and different dynamic load frequency are analyzed, and the following conclusions are obtained:
1) Under the action of a small range of dynamic stress amplitude, the total axial strain increases rapidly before 1000 times of vibration. After 1000 times, the growth rate decreases until the total axial strain tends to be stable and the soil sample is not destroyed. When the dynamic stress amplitude is 300 kPa, the axial total strain increases nearly linearly, and the soil sample is directly damaged.
2) The cumulative plastic strain of pluvial silty sand is the smallest when the water content is 8.0 %, the confining pressure is 80 kPa and the frequency is 1 Hz. Under the condition of optimal water content, low frequency vibration and high confining pressure, the dynamic load has a dense effect on the soil, and the soil sample structure is not easy to be destroyed.
3) The R. L. Kondner hyperbolic model is used to describe the dynamic stress-dynamic strain relationship of alluvial silty sand. With the increase of dynamic stress, the dynamic strain increases nonlinearly. The greater the confining pressure and the closer the moisture content to the optimal moisture content, the greater the dynamic strength.
In this study, the special soil of alluvial silty sand is used as highway subgrade filler, and its dynamic characteristics are studied. It makes up for the deficiency of existing research and provides a solid theoretical basis for international engineering to use this special soil as subgrade filler.
References
-
Y. Z. Xu, “Stability analysis of silty sand subgrade slope based on finite element,” (in Chinese), Northeast Forestry University, 2013.
-
C. Xi, “Study on dynamic characteristics of fly ash improved silty soil subgrade,” (in Chinese), Northeast Forestry University, 2023.
-
W. L. Qiu, J. J. Dong, and F. B. Wang, “Study on strength characteristics of silty sand subgrade filler under dry-wet cycle conditions,” (in Chinese), Traffic World, Vol. 25, pp. 151–153, 2022.
-
W. J. Bu, “Study on mechanical properties of subgrade silty sand under freeze-thaw cycles,” (in Chinese), East China University of Technology, 2023.
-
F. Salour, M. S. Rahman, and S. Erlingsson, “Characterizing permanent deformation of silty sand subgrades by using a model based on multistage repeated-load triaxial testing. transportation research record,” Journal of the Transportation Research Board, Vol. 2578, pp. 47–57, 2016.
-
S. N. Wang et al., “Experimental study on permeability characteristics of cement metakaolin composite stabilized silty sand,” (in Chinese), Geotechnical Mechanics, Vol. 43, No. 11, pp. 3003–3014, 2022.
-
Y. Q. Yuan, M. T. Du, and J. J. Wang, “Experimental study on the properties of composite improved silty soil,” (in Chinese), Journal of Henan University (Natural Science Edition), Vol. 52, No. 4, pp. 472–478, 2022.
-
Q. Wan, “Study on deformation characteristics of coarse-grained chloride saline soil subgrade under traffic load in alpine salt lake area,” (in Chinese), Chang’an University, 2023.
About this article

Key Research and Development Project of Shaanxi Province-Research on Engineering Characteristics of Subgrade Soil under Super-Heavy Load Conditions.
The datasets generated during and/or analyzed during the current study are available from the corresponding author on reasonable request.
The authors declare that they have no conflict of interest.
