Abstract
In order to effectively reduce the vibration of the product in the process of transportation, the cushioning pad is applied in the packaging of the computer case, which can not only greatly reduce the cost of the cushioning packaging design, but also promote the sales of the product. The vibration response of the key components in the computer case was tested and analyzed under the conditions of force hammer experiment and random vibration experiment, and the direct transmission rate of the buffer liner system to the key components was obtained. The excitation of three vibration levels of the standard truck vibration spectrum was used to simulate the excitation of different intensities in actual transportation, and the excitation acceleration power spectrum was obtained. The direct transmission rate quantified the vibration transmission characteristics of each buffer pad to the key components, and the size of the direct transmission rate reflected the degree of vibration energy absorption of each buffer pad to the key components. The critical buffer pad was optimized to absorb more vibration energy by increasing the buffer area of the critical buffer pad, reducing its vibration transmission capacity in the main resonance area.
Highlights
- The vibration response of the key components in the computer case was tested and analyzed under the conditions of force hammer experiment and random vibration experiment, and the direct transmission rate of the buffer liner system to the key components was obtained.
- The excitation of three vibration levels of the standard truck vibration spectrum was used to simulate the excitation of different intensities in actual transportation, and the excitation acceleration power spectrum was obtained.
- The direct transmission rate quantified the vibration transmission characteristics of each buffer pad to the key components, and the size of the direct transmission rate reflected the degree of vibration energy absorption of each buffer pad to the key components.
1. Introduction
The rise of e-commerce has shifted the distribution of goods from offline to online, which means more goods need to be transported. An important challenge for the traditional transportation industry is the quality of product transport, especially the need for vibration reduction [1]. Good vibration reduction schemes can not only improve the carrying capacity on a large scale, but also help reduce costs and promote the development of marketing capacity [2]. In actual transportation, electronic products are usually protected by cushion packaging, such as computers. The cushion pads in most computer chassis are evenly distributed, but some products have several key components, which have different centers of gravity distribution and complex connection structure. When they are coupled by random vibration and impact excitation of transportation vehicles, the cushion pads at various locations have different vibration transmission capacity to the key components of the product [3]. In order to maximize the use of cushion materials, it is very important to accurately identify the key vibration transmission paths of the product packaging system. The transfer path analysis method is an effective tool for studying the vibration transfer characteristics of the system. Vibration is the main cause of damage to the case, and the product will be damaged to varying degrees with the change of vibration level [4]. In the process of transportation of the case, the vibration caused by uneven road surface is the main cause of packaging damage, and the manufacturer usually adopts the method of buffer lining to reduce the impact of vibration [5].
Different scholars have conducted a large number of studies on the optimization of vibration reduction of the system through the transfer path method [6]. In the process of transportation, the external excitation is transmitted to the product and its key components through the buffer lining system. The transmission characteristics of each buffer lining subsystem to the key components of the product are the reference for optimal design [7, 8]. Direct transmission rate indicates the direct transmission capacity. Because the product is a complex coupling system, it is very difficult to keep the path blocked on other subsystems when a buffer lining subsystem is stimulated by the external excitation, and the direct transmission rate cannot be obtained directly by experiment. However, the direct transmission rate can be calculated by the global transmission rate, so the direct transmission rate can be obtained by measuring the acceleration response of each subsystem through the force hammer experiment.
2. Testing and analysis of dynamic response
2.1. Design of test scheme
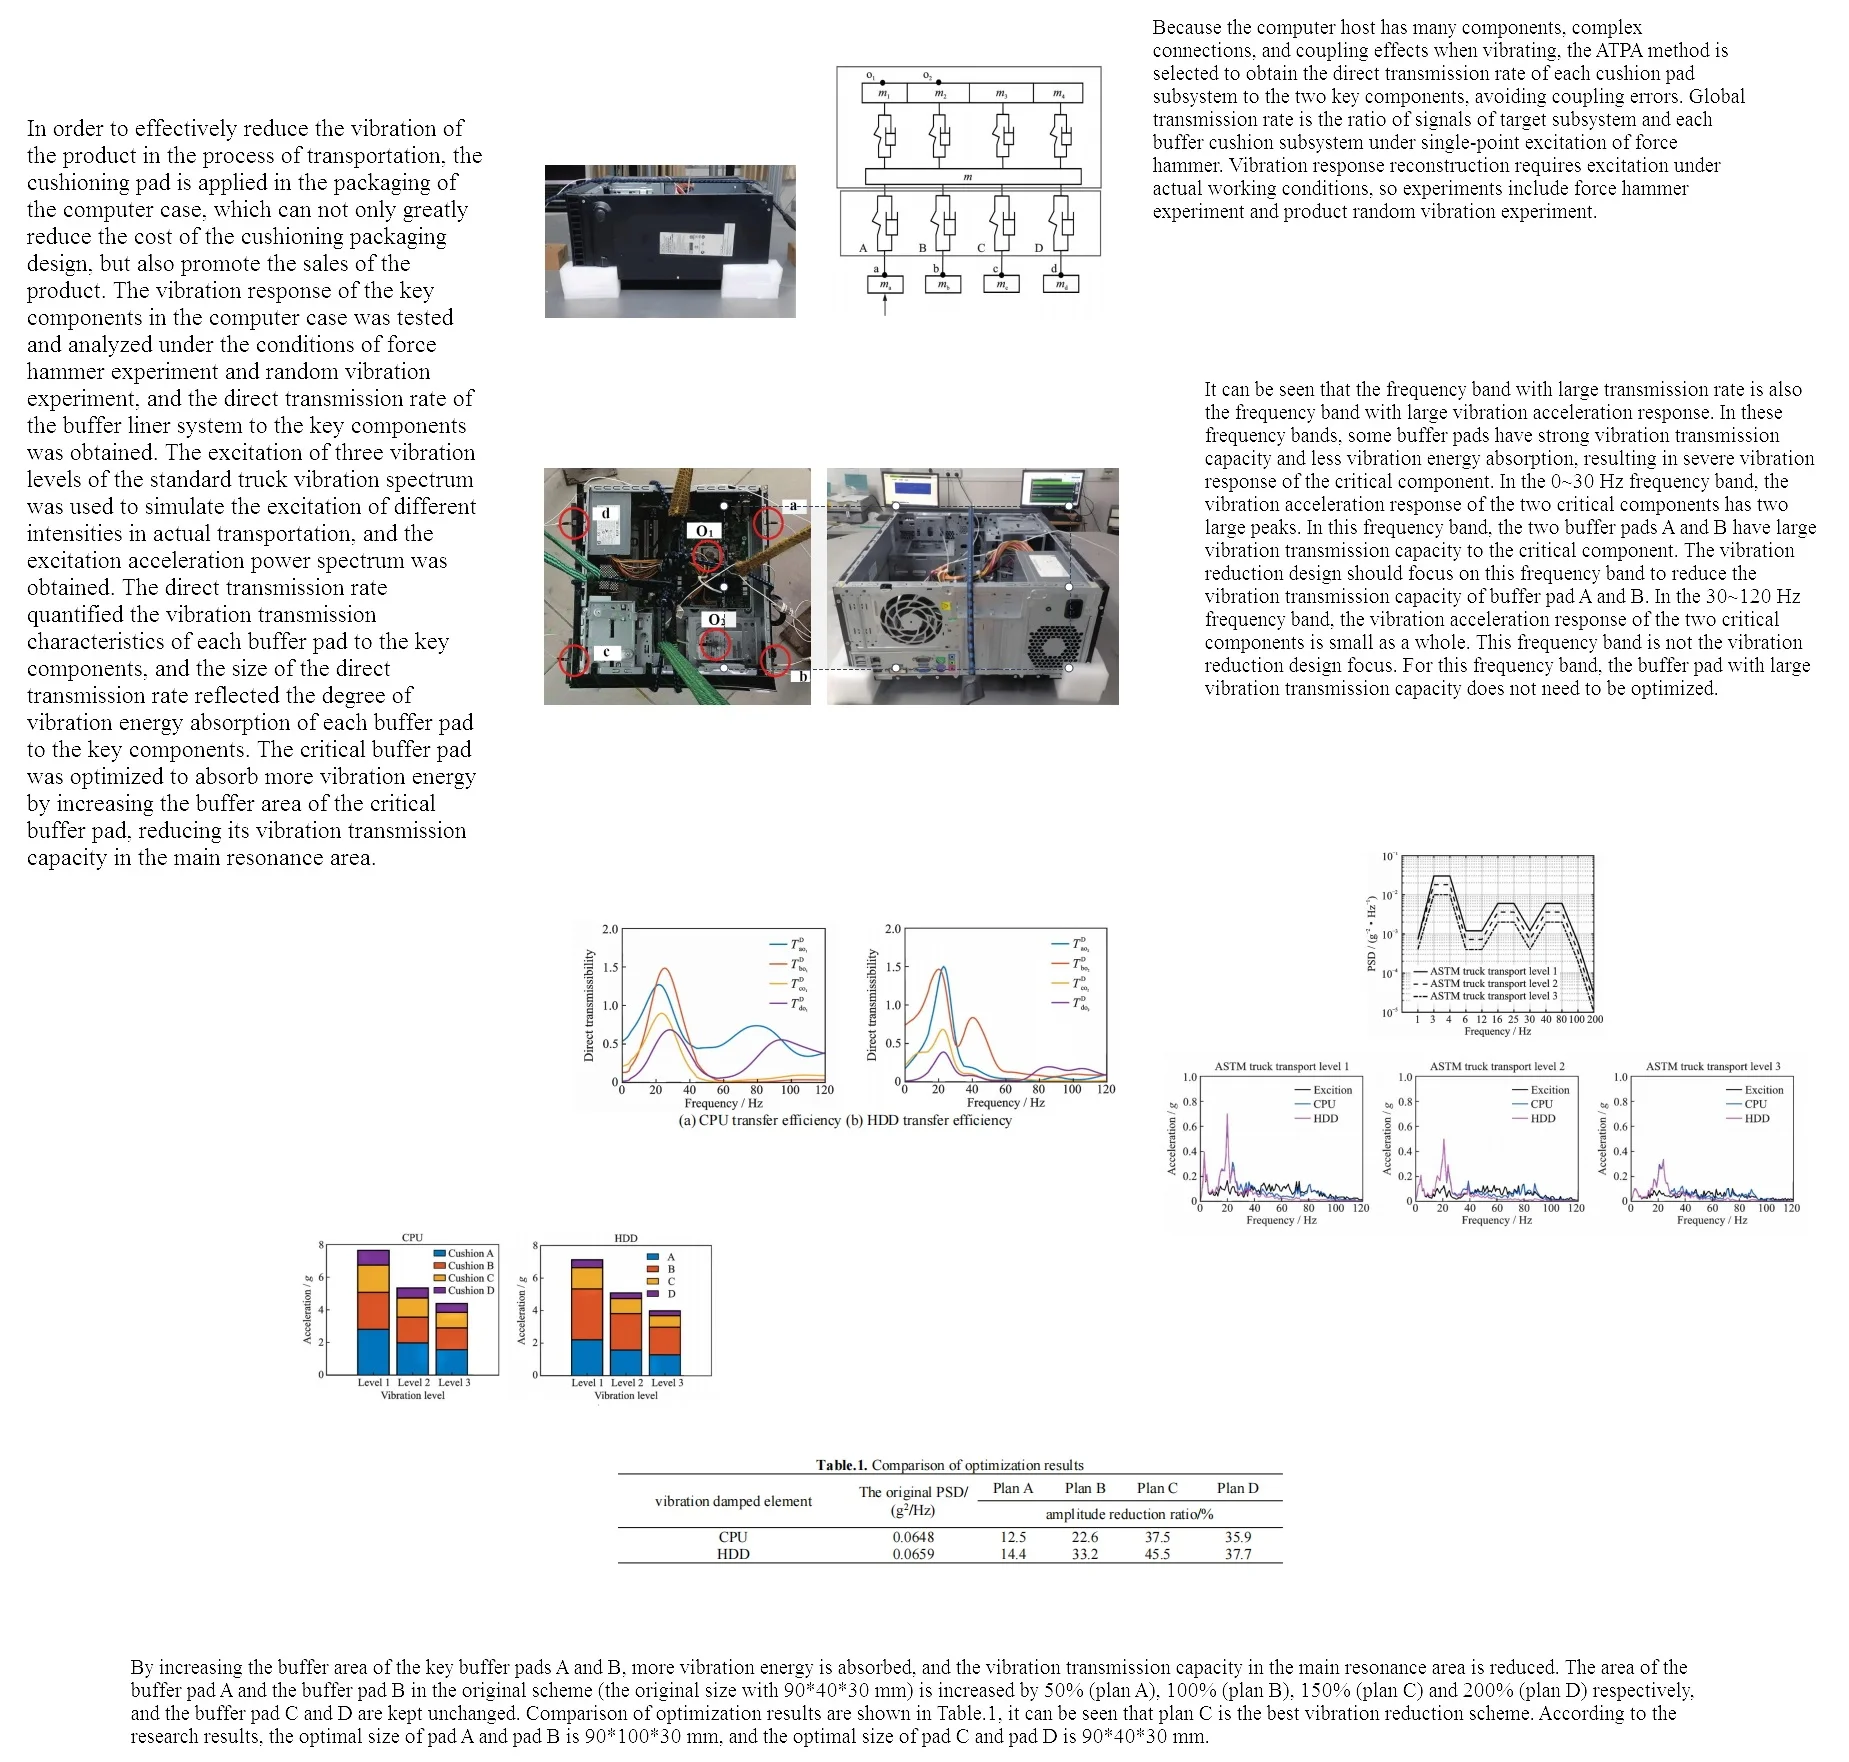
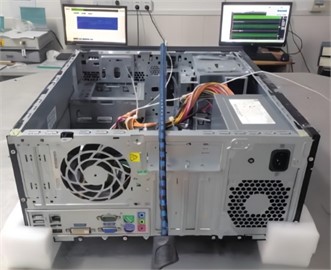
The object of study is shown in Fig. 1, which consists of a computer host and EPE buffer pads. The key components are the motherboard CPU and the hard disk HDD. The two key components have different gravity distributions, different masses and materials. Four identical EPE buffer pads, with a density of 16.7 kg/m3, are located at the four corners of the computer host. The auxiliary mass block is a Q235 steel plate with a density of 7.85×10³ kg/m3. In the process of transportation, the road excitation energy is transferred to the product through the cushion pads on the bottom of the transportation vehicle. In order to facilitate the study of the impact of each cushion pad on the key components of the product, the product packaging system is divided into a cushion pad subsystem and a key component subsystem. In the model, A, B, C and D are the cushion pad subsystems, which are represented by four cushion pads in the actual cushion packaging products as shown in Fig. 2. and are the key component subsystems, which are represented by the CPU and HDD of the motherboard of the computer host in the actual products. These two parts should be protected in the transportation. Because the computer host has many components, complex connections, and coupling effects when vibrating, the ATPA method is selected to obtain the direct transmission rate of each cushion pad subsystem to the two key components, avoiding coupling errors. Global transmission rate is the ratio of signals of target subsystem and each buffer cushion subsystem under single-point excitation of force hammer. Vibration response reconstruction requires excitation under actual working conditions, so experiments include force hammer experiment and product random vibration experiment.
Fig. 1Layout of vibration isolation pads
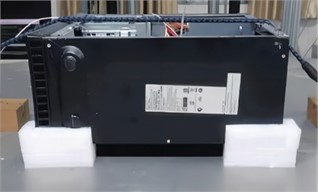
Fig. 2Working principle of vibration damping components
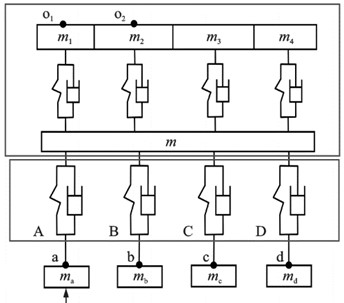
Because the buffer pad material is soft and the deformation of the buffer pad is large when the force hammer is excited, it is difficult to directly measure the excitation signal transmitted to the buffer pad. Therefore, the auxiliary mass block is introduced. The force hammer vertically knocks the bottom center of the auxiliary mass block from bottom to top, and the sensor is placed on the upper part of the auxiliary mass block, as shown in Fig. 3. Since the research object is mainframe computer, which is mostly transported by road, the excitation of three vibration levels of ASTM standard truck vibration spectrum is used to simulate the excitation of different intensities in actual transportation. The simplified mainframe computer packaging is placed in the center position of the shaking table, and the mainframe computer packaging is bound with elastic rope to simulate the mutual constraint state of the stacking arrangement of packaging in actual transportation. The acceleration sensor is fixed on the shaking table and two key components, and the acceleration sensor is connected with the data acquisition instrument and the computer, as shown in Fig. 4. The ATPA method is divided into two steps: the first step is to obtain the global transmission matrix, and calculate the direct transmission rate according to the global transmission matrix; the second step is to measure the excitation signal and response of the target subsystem under actual working conditions, and reconstruct the response signal of any subsystem through the direct transmission rate and the working condition excitation signal.
Fig. 3Hammer test scheme
Fig. 4First order vibration mode solution result
2.2. Analysis of test results
For the hammering experiment, firstly, the auxiliary mass block was hit by a hammer, and the hammer excitation signal and the acceleration response time domain signals of different measuring points were obtained when only the auxiliary mass block was excited by the hammer. Then the auxiliary mass block was hit in turn, and the acceleration response time domain signals under the single point excitation were obtained. The acceleration response time domain signals were transformed into acceleration response frequency domain signals through auto-spectrum FFT analysis. The global transmission rates from four buffer pads to two key components were obtained by comparing the acceleration response frequency domain data, and the direct transmission rates were obtained by LU numerical decomposition algorithm. Because the condition number of the inverse matrix was too large, in order to reduce the error, the global transmission matrix was processed by sections. Each frequency point corresponded to a direct transmission rate, and the direct transmission rate of the whole frequency band was obtained. In the experimental process, the signal was doped with noise, showing a narrow peak, which would affect the accuracy of the direct transmission rate. Therefore, the peak should be removed when processing data. Finally, the direct transmission curves from buffer pads to key components CPU and HDD were obtained, as shown in Fig. 5.
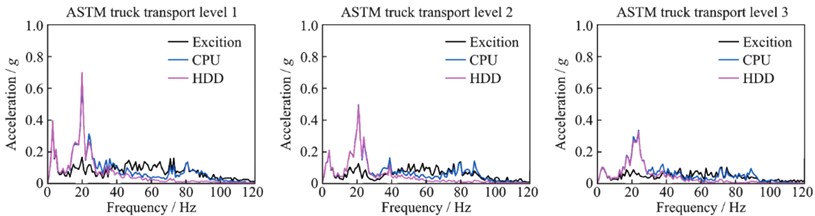
For random vibration test, a vibration test system for hydraulic shaker was used to conduct random vibration test on the computer host packaging, and the DASP data acquisition system was used to collect the excitation on the shaker and the vibration response of the two key components. The ASTM truck transport power spectrum of three vibration levels was input into the vibration test system TVT, and the signal on the shaker was the excitation signal of the four buffer pads. The frequency domain excitation and vibration acceleration signal on the key components under three vibration levels were obtained as shown in Fig. 6. The direct transmission rate quantifies the vibration transmission characteristics of each buffer pad to the critical component. The size of the direct transmission rate reflects the degree of vibration energy absorption of each buffer pad to the critical component. The larger the direct transmission rate is, the more vibration energy is transmitted to the critical component through the buffer pad. The acceleration response of the critical components CPU and HDD under the excitation of the three levels of ASTM truck spectrum is shown in Fig. 6. It can be seen that the frequency band with large transmission rate is also the frequency band with large vibration acceleration response. In these frequency bands, some buffer pads have strong vibration transmission capacity and less vibration energy absorption, resulting in severe vibration response of the critical component. In the 0-30 Hz frequency band, the vibration acceleration response of the two critical components has two large peaks. In this frequency band, the two buffer pads A and B have large vibration transmission capacity to the critical component. The vibration reduction design should focus on this frequency band to reduce the vibration transmission capacity of buffer pad A and B. In the 30-120 Hz frequency band, the vibration acceleration response of the two critical components is small as a whole. This frequency band is not the vibration reduction design focus. For this frequency band, the buffer pad with large vibration transmission capacity does not need to be optimized.
Fig. 5Model and parameterized dimensions
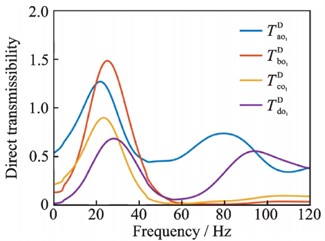
a) CPU transfer efficiency
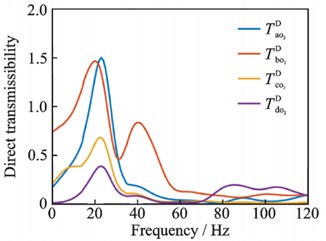
b) HDD transfer efficiency
Fig. 6Acceleration power spectrum
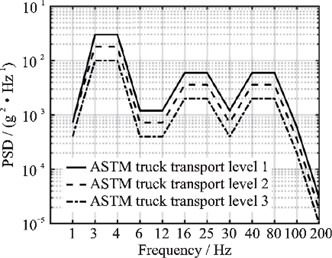
Fig. 7Acceleration response under different vibration levels
3. Vibration reduction optimization and benefit analysis
3.1. Optimization of vibration damping elements
The excitation on the shaker is transmitted to the product and its key components through four buffer gaskets A, B, C and D. According to the definition of direct transmission rate, the synthetic response of key components and is given by the following equation:
where, represents different vibration excitation, and represents direct transfer efficiency.
There are multiple resonance zones and resonance peaks of key components, and the smaller resonance peaks can be ignored. The first and second main resonance zones with larger resonance peaks are concentrated in the 0-30 Hz frequency band, so the main resonance frequency band is 0-30 Hz, and the vibration contribution of each buffer pad in the main resonance frequency band is shown in Fig. 8.
Fig. 8Vibration impact of each buffer pad on key components
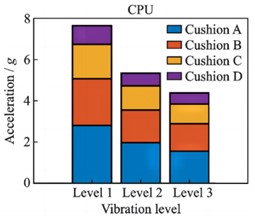
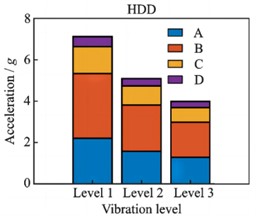
The vibration of the two key components is mainly contributed by the buffer pad A and B. The focus of the vibration optimization design is to optimize the buffer pads A and B, and reduce their vibration transmission capacity to the key components. The product should be kept stable during the transportation process, so the thickness of the four buffer pads should be kept consistent. Considering the process and cost, the non-key buffer pads should be kept unchanged, and only the key buffer pads should be optimized. By increasing the buffer area of the key buffer pads A and B, more vibration energy is absorbed, and the vibration transmission capacity in the main resonance area is reduced. The area of the buffer pad A and the buffer pad B in the original scheme (the original size with 90×40×30 mm) is increased by 50 % (plan A), 100 % (plan B), 150 % (plan C) and 200 % (plan D) respectively, and the buffer pad C and D are kept unchanged. Comparison of optimization results are shown in Table.1, it can be seen that plan C is the best vibration reduction scheme. According to the research results, the optimal size of pad A and pad B is 90×100×30 mm, and the optimal size of pad C and pad D is 90×40×30 mm.
Table 1Comparison of optimization results
Vibration damped element | The original PSD / (g2/Hz) | Plan A | Plan B | Plan C | Plan D |
Amplitude reduction ratio / % | |||||
CPU | 0.0648 | 12.5 | 22.6 | 37.5 | 35.9 |
HDD | 0.0659 | 14.4 | 33.2 | 45.5 | 37.7 |
3.2. Impact of vibration reduction design on benefits
Vibration reduction is of great significance for product sales and cost control. The vibration hazards of product transportation mainly come from the transportation environment and transportation vehicles. In the process of automobile transportation, the undulations of the road surface, the inherent vibration of the automobile engine, the inflation degree of the tire and the performance of the shock absorber spring and other factors will cause the product to vibrate in any direction. In the process of train transportation, the product will also have periodic vibration due to the influence of the traction locomotive and the rail joints. In the process of sea transportation, in addition to the vibration of the engine, the product also has low frequency vibration due to the turbulence of the water surface. In the process of air transportation, the product is not only affected by the high frequency excitation of the engine, but also produces low frequency vibration and periodic up and down and left and right swing by the action of airflow. Damping packaging design plays a crucial role in the process of product sales and transportation. A good damping packaging design can protect the product from damage and ensure the safety of the product in the transportation process. At the same time, damping packaging design is also an important part of the product image, which can attract the attention of consumers and improve the competitiveness of the product. Scientific vibration reduction packaging design can well reflect the positioning of the brand and product, so that consumers can be a bright eye from many commodities. To make consumers buy, it is also necessary to explain the reasons for product purchase and trust in packaging design, so that customers like to buy and buy at ease.
4. Conclusions
1) The dynamics analysis theory is introduced into the design of cushioning vibration-proof packaging for practical products, and the feasibility of the method in cushioning vibration-proof packaging design is verified through experiments. The experiment is simple and operable, and the vibration coupling effect is avoided. It has reference significance for the identification of key vibration paths of complex structural products and the optimization design of cushioning packaging for local cushioning.
2) The vibration reduction design should focus on optimizing the critical buffer pads. On the premise of keeping the non-critical buffer pads unchanged, the peak value of the vibration response PSD in the main resonance region of the critical component can be reduced by increasing the surface area of the critical buffer pad, so that the energy can be dispersed to a wider frequency range, and the purpose of vibration reduction can be achieved.
References
-
M. Sohrabifard, M. Nategh, and M. Ghazavi, “Evaluation, calibration, and modal analysis for determination of contact stiffness between workpiece and components of milling fixture,” Proceedings of the Institution of Mechanical Engineers, Part B: Journal of Engineering Manufacture, Vol. 237, No. 12, pp. 1819–1835, Nov. 2022, https://doi.org/10.1177/09544054221138165
-
S. de Carolis, A. Messina, and L. Soria, “Modal analysis through response-based FRFs: Additional modes for local diagnoses,” Journal of Sound and Vibration, Vol. 549, No. 1, p. 117574, Apr. 2023, https://doi.org/10.1016/j.jsv.2023.117574
-
M. R. Zarastvand, M. H. Asadijafari, and R. Talebitooti, “Acoustic wave transmission characteristics of stiffened composite shell systems with double curvature,” Composite Structures, Vol. 292, No. 1, p. 115688, Jul. 2022, https://doi.org/10.1016/j.compstruct.2022.115688
-
R. Talebitooti, M. Zarastvand, and H. Darvishgohari, “Multi-objective optimization approach on diffuse sound transmission through poroelastic composite sandwich structure,” Journal of Sandwich Structures and Materials, Vol. 23, No. 4, pp. 1221–1252, Jun. 2019, https://doi.org/10.1177/1099636219854748
-
R. Talebitooti, H. D. Gohari, and M. R. Zarastvand, “Multi objective optimization of sound transmission across laminated composite cylindrical shell lined with porous core investigating Non-dominated Sorting Genetic Algorithm,” Aerospace Science and Technology, Vol. 69, No. 1, pp. 269–280, Oct. 2017, https://doi.org/10.1016/j.ast.2017.06.008
-
H. D. Chalak, A. M. Zenkour, and A. Garg, “Free vibration and modal stress analysis of FG-CNTRC beams under hygrothermal conditions using zigzag theory,” Mechanics Based Design of Structures and Machines, Vol. 51, No. 8, pp. 4709–4730, Aug. 2023, https://doi.org/10.1080/15397734.2021.1977659
-
R. K. Bhamu, A. Shukla, S. C. Sharma, and S. P. Harsha, “Vibration response of steam turbine healthy and cracked blade under the stress stiffening and spin softening effects,” Proceedings of the Institution of Mechanical Engineers, Part K: Journal of Multi-body Dynamics, Vol. 236, No. 2, pp. 224–243, Feb. 2022, https://doi.org/10.1177/14644193221078656
-
A. Daşdemir, “A modal analysis of forced vibration of a piezoelectric plate with initial stress by the finite-element simulation,” Mechanics of Composite Materials, Vol. 58, No. 1, pp. 69–80, Mar. 2022, https://doi.org/10.1007/s11029-022-10012-7
About this article

The authors have not disclosed any funding.
The datasets generated during and/or analyzed during the current study are available from the corresponding author on reasonable request.
The authors declare that they have no conflict of interest.
