Abstract
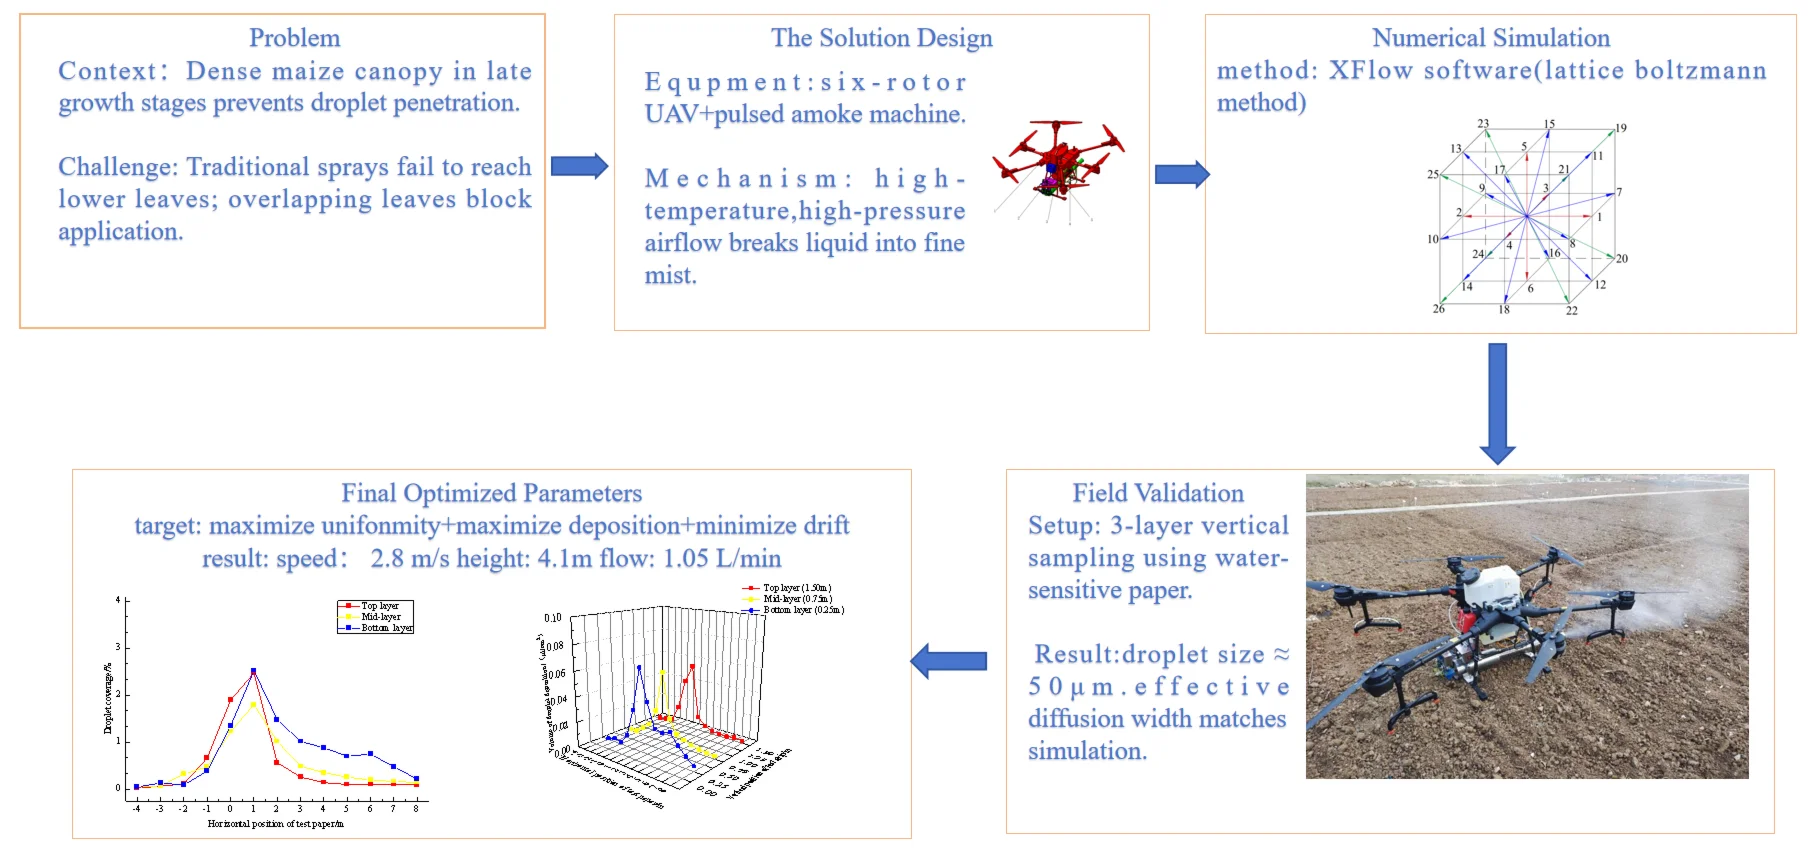
Aiming at the problem that the traditional plant protection UAV has poor droplet penetration due to the tall plants and overlapping leaves after the closure of maize in the middle and late stages, which leads to the difficulty of disease and pest control, this study combined the thermal atomization technology of pulsed smoke machine with the efficient plant protection UAV to design a smoke plant protection UAV that can meet the disease and pest control of maize and other densely planted tall stalk crops in the middle and late stages. A computational fluid dynamics method based on the Lattice Boltzmann Method (LBM) was used to numerically simulate the downwash airflow field of a smoke plant protection UAV (six-rotor) to explore the variation characteristics of the rotor flow field in different flight directions, at different flight speeds and at different flight times. The results show that: When the flight height of the UAV is 4 m and the flight speed is 2-5 m/s, with the increase of the speed, two distinct tail vortices gradually form behind the fuselage, and the height and diffusion distance of the tail vortices also increase with the increase of the speed. In addition, with the increase of the flight speed, the amount of droplets drifting up and to both sides will increase, and the intensity of the left side is greater than that of the right side. This can guide the nozzle position adjustment. The droplet deposition and diffusion distribution data of the smoke plant protection UAV were measured without plant cover through field test, The results showed that the median diameter of the droplet volume at each test point was about 50 μm, and the particle size range of the droplets met the requirements for the prevention and control of plant diseases and insect pests. The spatial distribution of droplets increased from top to bottom, and the trend of each layer in the horizontal direction was about the same, and at the same height and spray flow, the droplet particle size and sedimentation decreased with the increase of flight speed.
Highlights
- Computational Fluid Dynamics (CFD) simulation based on the Lattice Boltzmann Method (LBM) is adopted. Compared with traditional RANS equations or AGDISP models, it captures the complex wake structure of multi-rotor UAVs more efficiently without complex manual mesh generation.
- The effects of flight modes (straight flight/horizontal flight), flight speeds (2-5m/s), and flight moments on the rotor downwash flow field and droplet deposition are systematically explored.
- Field tests (water-sensitive paper method) verify the numerical simulation results. Key indicators such as droplet diffusion distance and particle size variation trend show good consistency (deviation < 10%).
- A multi-objective optimization framework is constructed by integrating Response Surface Methodology (RSM) and Genetic Algorithm (GA). The optimal operating parameters (flight speed: 2.8m/s, flight height: 4.1m, straight flight mode).
1. Introduction
In agricultural production, aviation plant protection has become one of the key technologies for crop disease and pest control with its advantages of high control efficiency, low operation cost and wide applicability [1]. As an integral part of aerial plant protection equipment, UAVs have developed rapidly in East Asian countries such as China, Japan and South Korea in recent years, Due to Asia’s diverse crop cultivation and complex and changeable planting terrain, the maneuverability and high flexibility of multi-rotor UAVs have been given full play [2]-[4]. Meanwhile, the drift of drug droplets caused by the rotor downwash flow field of UAV is a major technical risk of the application technology of plant protection UAV [5]. Li et al. explored the interaction between rice canopy and the downwash wind field of a UAV and its vertical attenuation mechanism, the results indicated that the movement parameters of UAV and the vortex movement of the rice canopy could improve the precise target accuracy of the spraying operation of the UAV [6]. Tang et al. recorded the droplet spatial distribution of an eight-rotor agricultural UAV by using a high-speed particle image velocimetry (PIV). The results indicated that the rotor speed and nozzle position had an effect on the movement and deposition of droplets in the downwash flow field [7]. Therefore, the development of UAV downwash airflow field plays an important role in plant protection research [8].
There are currently two main modeling systems available for simulating aerial spraying. The first is the agricultural dispersal (AGDISP) system, AGDISP is a Lagrangian model that includes a simplified helicopter wake model that transitions from a downwash under a single set of rotor blades to fully rolled-up tip vortices. The AGDISP helicopter model is restrictive in two ways, (1) it can only be applied to aircraft with a single main rotor, and (2) the aircraft flying height and speed must be sufficiently high that the downwash model rolls up into a pair of vortices before the ground is impacted by the rotor downwash. These restrictions prevent the existing helicopter model from simulating the behavior of UAV wakes because UAVs often have multiple rotors and fly much closer to the ground and at much slower speeds than helicopters [9], [10].
The other modeling system uses computational fluid dynamics (CFD) method. CFD simulation is the main method for numerical analysis of flow field [11]. Scholars have carried out a series of researches on the downwash airflow field of UAV by CFD simulation. Based on compressible Reynolds-averaged Navier-Stokes (RANS) equations with the RNG k-ε turbulence model, an efficient three-dimensional computational fluid dynamics (CFD) method was established to analyze the flow field distribution characteristics of UAV in hovering mode [12]. Guo et al. developed a computational fluid dynamics (CFD) model of the downwash airflow field in the hovering state of a quadrotor agricultural UAV and discussed the spatial and temporal distributions of the downwash flow field [13]. Jung et al. investigated the interaction mechanism between the downwash airflow and the tail of a dual-rotor UAV and performed accurate CFD simulations of the inlet and outlet regions of the downwash airflow between the two rotors [14]. However, the computational accuracy of CFD is strictly dependent on the quality of the manually generated grid. Grids for the blade tip vortex and wake zone also must be manually selected, which is not easy for multirotor drones with a small-scale and local geometric complexity [15].
In recent years, the Lattice Boltzmann Method (LBM) has been applied to solve mesoscopic scale fluid dynamics problems and can achieve high fidelity calculations and simulations of complex CFD problems [16]. Wang et al. conducted numerical simulations based on the Lattice Boltzmann Method (LBM) of the downwash airflow field of a six-rotor plant protection UAV in flight, and investigated the distribution characteristics of the downwash airflow field under various characteristic parameters such as flight speed, flight altitude, side wind speed and working load [17]. Sheng et al. used a computational fluid dynamics (CFD) method based on the lattice Boltzmann method (LBM) to numerically simulate a quadrotor UAV downwash flow field at flight speeds of 1-7 m/s and altitudes of 1-2 m. The horseshoe-shaped vortices was successfully captured at speeds in excess of 5 m/s [18]. Tang et al. used a large-eddy simulation method and accurately captured the development of the rotor-tip vortex using the lattice Boltzmann method (LBM) to simulate a commonly used unmanned helicopter model (AF 25 B; Copterworks) for tests with different droplet sizes, application altitudes and side wind speeds, this study demonstrates that LBM can effectively simulate the non-constant flow caused by the main rotor of a helicopter [19]. This shows that the reliability of the LBM method has been validated by the research of many scholars. Due to the thermal fogger mounted on the multi-rotor UAV in this study, changes in the structural parameters will lead to changes in the flow field, for which further fluid simulation is required to reveal the characteristic parameters of the airflow field.
This study combines the features of a six-rotor plant protection UAV and a pulsed smoke machine for plant protection and control, and designs a smoke plant protection UAV. The flow field of smoke plant protection UAV is analyzed by using fluid dynamics software based on the lattice Boltzmann method, and the variation characteristics of the rotor flow field under different flight speeds and different flight moments are explored, and provides a rational basis for the structural layout and adjustment of the operating parameters of the pulsed smoke machine. Meanwhile, a spraying effect test was carried out in the field, and the droplet deposition and diffusion distribution data of the smoke plant protection UAV without plant shading were measured using the water-sensitive test paper method, which further verified the application performance of the designed smoke plant protection UAV and could provide a new idea for the mid and late stage plant protection operation of maize.
2. Materials and methods
2.1. Smoke plant protection UAV model
In this study, according to the growth characteristics of maize crops and the requirements of disease and pest control in the middle and late period of maize, combined with the characteristics of multi-rotor plant protection UAVs and pulsed smoke machine in plant protection control, a smoke plant protection UAV was designed and built to meet the requirements of disease and pest control in the middle and late period of maize and other densely planted tall stalk crops. Fig. 1 shows the structure of a smoke plant protection UAV, whose overall structure consists of a multi-rotor plant protection UAV, a pulsed smoke machine and a remote control system control platform. The UAV in its structure is the T20 plant protection UAV developed by Chinese Shenzhen DJI Innovation Technology Co., Ltd. The entire aircraft has stable and reliable flight, excellent performance and effective plant protection operation, and the technical index for the entire aircraft is shown in Table 1.
Fig. 1Schematic diagram of the structure of the smoke plant protection UAV: 1 – multi-rotor UAV; 2 – control box; 3 – pulsed smoke machine; 4 – pipelines; 5 – oil tank
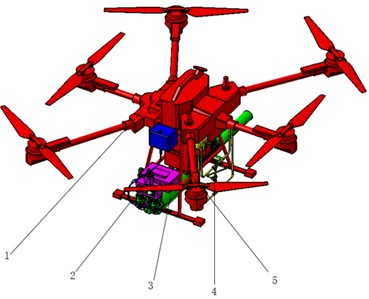
Table 1Technical specifications for the entire UAV
Name | Parameters |
Weight of the whole UAV | 21.1 kg/27.5 kg (6.4 kg with batteries) |
Take-off weight | 42.6 kg (Rated)/47.5 kg (Maximum) |
Working hours | 15 min (No-load)/10min (Rated) |
UAV rack parameters | 2509×2213×732 (Expansion) 1100×570×732 (Fold) |
Medicine box volume | 15.1L(Rated)/20L (Fully loaded) |
Flow range | 0-6 L/min |
Maximum operating speed | 7 m/s |
Radar module type | RD2428R |
Smart battery type | AB3-180000mAh-51.8V |
2.2. Simplified model used in numerical simulation
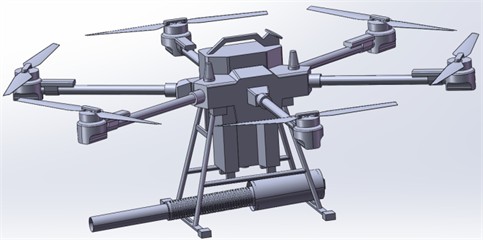
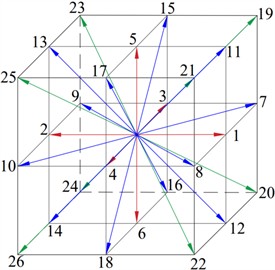
The UAV flight relies on the lift generated by the rotor operation, the rotation of the wing leads to changes in air flow and changes in the rotor downwash airflow field. For the application of medicine, understanding the relevant mechanism can help to understand the characteristics of the drift of droplets at different flight speeds, so as to select the appropriate operating parameters and improve the effectiveness of plant protection. The T20 rotorcraft used in this study is an “X” UAV with six wings. As shown in Fig. 2, the 1, 3 and 6 wings rotate counter-clockwise, 2, 4 and 5 wings rotate clockwise, 1 and 4 of the wings are short rods, the rest are long rods, this layout is stable in flight. In order to save computer resources, the physical model of the smoke plant protection UAV was reasonably simplified, as shown in Fig. 3. The simplified model has three components: the fuselage, the six rotors and the smoke nozzle.
Fig. 2Rotor layout
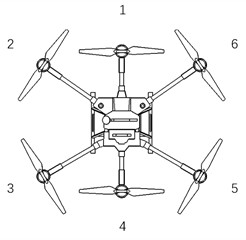
Fig. 3Simplified model
2.3. Numerical simulation approach
This study uses XFlow software to simulate the variation of the downwash flow field of the smoke plant protection UAV, which has a good performance in the simulation of the mechanical properties of fluids.
2.3.1. Lattice Boltzmann method
LBM is a mesoscopic simulation method between macroscopic continuous simulation and microscopic molecular dynamics simulation. The XFlow software is based on the mesoscale LBM equations, a highly accurate particle method for engineering calculations, which saves computing time compared to direct numerical simulations at the microscale, has higher accuracy than macroscale particle methods, and can accurately handle problems at both the microscale and macroscale. The computational domain of the LBM method used by the XFlow software is a Uniform cube element with a characteristic lattice structure of D3Q27, as shown in Fig. 4, a typical three-dimensional lattice model with 27 degrees of freedom, which is based on the principle of particle collision and each discrete cell has a high degree of freedom [20].
In this method, the equation of the lattice Boltzmann transfer equation discretized on the lattice is:
where , – particle velocity distribution function, – velocity along the -th direction, – time step, – particle velocity distribution function in the direction at point at time , – collision operator, – single particle equilibrium state distribution function, – dimensionless relaxation parameters.
With the introduction of an approximate simplification of the collision operator, the Eq. (1) can be reduced to the control equation N-S equation describing fluid flow, which is compatible with this equation at the macro level and has wider applicability. The N-S equation is mainly calculated iteratively by means of the equilibrium distribution function of the flow field and the collision operator, and can reveal the hydrodynamic state at low Mach numbers [21].
Fig. 4Schematic diagram of D3Q27 lattice
2.3.2. Computational domain and spatial discretization
The numerical simulation is carried out in the computational domain, which is set in the , and directions as a rectangular body of 20×8×20 m, as shown in Fig. 5. Where the negative direction along the -axis is the velocity inlet direction, and the flow velocity at the inlet is set at 2-5 m/s to simulate the flight speed of the smoke plant protection UAV. Add ground area, white area for ground. where the computational area is set to 20×8×30 m when the velocity is 5 m/s to ensure that the wake is still in the computational domain at the end of the simulation time. In the Computational domain, the center of the fuselage of the UAV is at a height of 4 m from the bottom, the fuselage is at a distance of 5 m from the tail of the wall in the -direction, and the nozzle mouth is facing in the -direction. For boundary types, the negative direction of the -axis is defined as a velocity inlet with uniform incoming flow, where the flow velocity matches the UAV's flight speed (2-5 m/s), the turbulence intensity is set to 5 % (referring to the atmospheric turbulence level in agricultural fields), and the turbulence length scale is 0.5 m. The positive direction of the -axis is set as a pressure outlet with atmospheric pressure (101325 Pa) and a backflow turbulence intensity of 5 %, suitable for subsonic flow scenarios. The 0 plane (ground) is a no-slip wall with a roughness of 0.01 m (simulating farmland soil surface) and an isothermal thermal boundary condition of 25 ℃. The surfaces of the UAV’s fuselage, rotors, and smoke tubes are all set as no-slip walls with material properties of aluminum alloy (density 2700 kg/m3, thermal conductivity 205 W/(m·K)) to account for surface viscosity effects. Symmetry boundaries are applied to both sides of the -axis to reduce computational domain size while maintaining flow field symmetry in the -direction. For convergence control, the velocity field and pressure field are monitored; convergence is determined when the velocity residual is less than 1×10⁻5 and the pressure residual is less than 1×10⁻⁴ sin 500 consecutive iterations. An adaptive time step is used, ranging from 1×10⁻⁴ s (minimum) to 5×10⁻⁴ s (maximum), with an average time step of 2×10⁻⁴ s at 2m/s and 1×10⁻⁴ s at 5m/s to capture tail vortex dynamics. The turbulence simulation adopts the Large Eddy Simulation (LES) with the Smagorinsky-Lilly subgrid model (model constant 0.17), and the lattice structure uses D3Q27 with a lattice spacing = 0.025 m, time step = 1×10⁻⁴ s, and sound speed 1.0 m/s (meeting the LBM stability condition of Mach number 0.3). Then, the material properties of each component of the smoke plant protection UAV are given to accurately obtain the flow field parameters of the rotor.
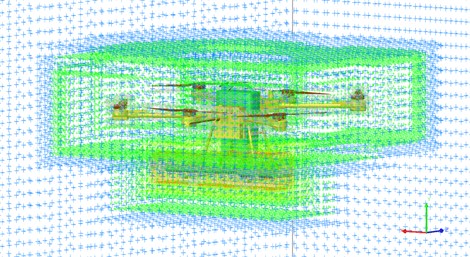
In order to accurately find the parameters of the rotor downwash flow field, the spatial and temporal resolution of the computational domain needs to be set appropriately to obtain the irregular flow turbulence scale. The resolution of the model focuses on the rotor surface, the fuselage surface and the trailing part of the downwash flow field, setting the resolution too small will take too long to calculate and consume a lot of computing resources, too large will be inaccurate and unclear flow field changes, so the global spatial refinement resolution size of the virtual wind tunnel is set at 0.1 m. The resolution size is set to 0.05 m for the rotor and 0.1 m for the pillbox and smoke tube using the adaptive method. In order to capture the characteristics of the downwash flow field trails, the size of the refinement resolution of the downwash flow field trails is set to 0.025 m, as shown in Fig. 5, with different colors at different locations. Set the simulation time to 4 seconds and the time resolution to 50 frames for simulation analysis and post-processing operations. The effect of automatic discretization after parameter setting is shown in Fig. 6.
Fig. 5Simulation model diagram
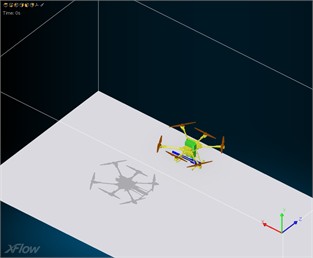
Fig. 6Discrete division of computational area
2.4. Experimental design and parametric optimization strategy
To systematically explore the multi-dimensional design space and transition from descriptive analysis to prescriptive optimization, a structured Design of Experiments (DOE) approach was integrated with the numerical simulations. This study focused on four critical operational parameters: flight speed (: 2-5 m/s), flight height (: 3-5 m), spray flow rate (: 0.8-1.2 L/min), and nozzle orientation (: straight vs. horizontal flight). A Central Composite Design (CCD) within the Response Surface Methodology (RSM) framework was employed to define the simulation matrix, which efficiently captures linear, interaction, and quadratic effects of the parameters on the response variables.
The key response variables included:
– : Droplet Coverage Uniformity.
– : Effective Deposition Amount.
– : Drift Potential.
CFD simulations based on the LBM method, as described in Section 2.3, were conducted for each combination of parameters in the designed matrix. The resulting data were used to construct second-order polynomial response surface models for each outcome. The goodness-of-fit for these models was evaluated using R² (coefficient of determination) and ANOVA. Furthermore, a multi-objective optimization was performed using a Genetic Algorithm (GA) to identify the Pareto-optimal set of parameters that simultaneously maximize deposition amount and uniformity while minimizing drift potential. This structured approach allows for the identification of robust operational settings and provides a predictive model for spray performance under varying conditions.
3. Analysis of simulation results
3.1. Variation in vortex distribution at different flight directions
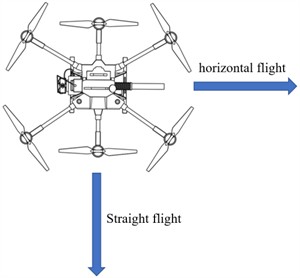
As the smoke machine is mounted on a UAV, taking into account the orientation of the nozzle during flight, the smoke plant protection UAV has two types of flight, straight and horizontal. When flying straight, the nozzle is oriented horizontally perpendicular to the direction of flight, and when flying horizontally, the nozzle is oriented parallel to the direction of flight, as shown in Fig. 7. Due to the rotor layout of the UAV itself, the airflow generated by the rotor differs in different flight patterns and has a different effect on the spraying of droplets.
Fig. 7Flight type of the smoke plant protection UAV
This study determined the flight pattern of the smoke plant protection UAV by means of numerical simulation. Half of the maximum flight speed of the plant protection UAV was selected for the numerical simulation analysis, as shown in Fig. 8, the cross-sectional view of the vortex intensity in the median region of the computational area of the two flight modes of horizontal flight and straight flight at the end of the simulation time when the flight speed is 4 m/s. The vorticity is one of the physical quantities describing the motion of a vortex. The vortex is usually measured by vorticity.
Fig. 8Comparison of vortex intensities between the two flight modes
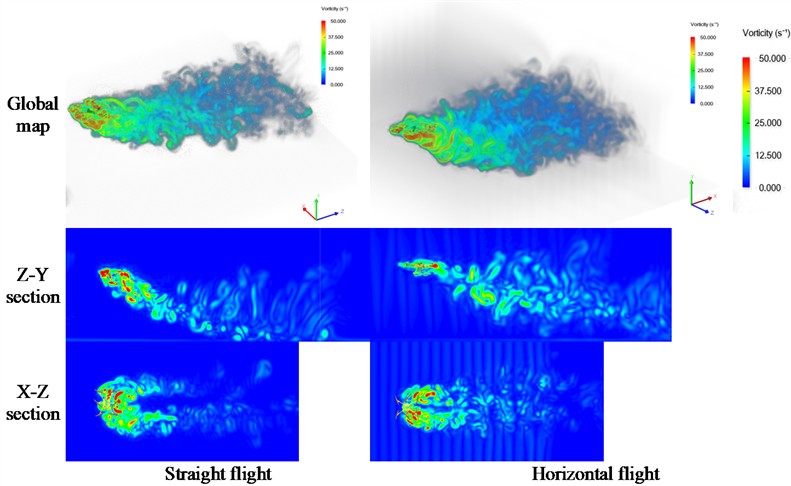
The global plot of the vorticity change shows that the intensity of the vortices under the rotor of the UAV in the horizontal flight mode is greater than in the straight flight mode, producing more vortices. Analysis of the - section shows that the intensity of the vortices under the fuselage in the horizontal flight mode decreases, but the vortices behind the fuselage become more complex and the vortices spread upwards with increased amplitude. Analysis of the - cross-section shows that the vortices in the middle region behind the fuselage are complex in the cross-flight mode. As the nozzle is oriented between the two tail vortices, the disturbance in the spray droplets spread will increase, and the mist stream will be more influenced by the rotor airflow at one end only when it is just ejected in straight flight, while it will be influenced by the airflow at both ends in horizontal flight. Therefore, straight flight is more reasonable.
3.2. Changes in vortices distribution at different flight speeds
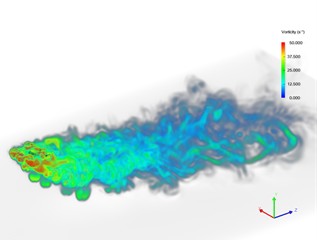
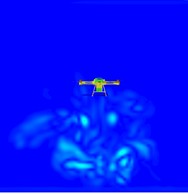
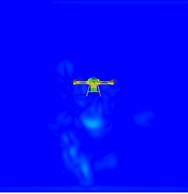
Numerical simulations were carried out for different flight speeds of the UAV and Fig. 9 shows the vorticity distribution of the UAV at speeds of 2-5 m/s. As shown in Fig. 9, the variation in vorticity at different speeds in the global view of the computational domain is obvious, the vortex intensity is higher under the wing, and as the speed increases, the vortex intensity under the rotor increases and the range of vortex variation becomes wider.
Fig. 9Vorticity distribution of UAV at different flight speeds
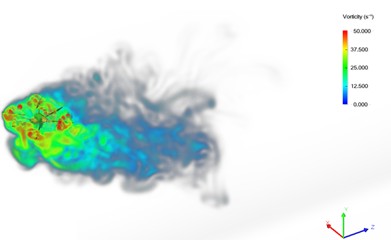
a) 2 m/s
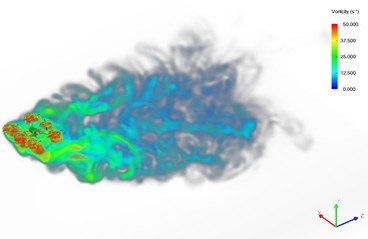
b) 3 m/s
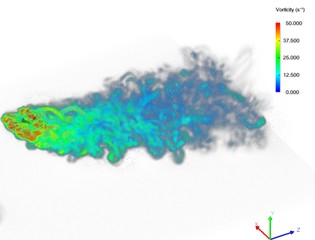
c) 4 m/s
d) 5 m/s
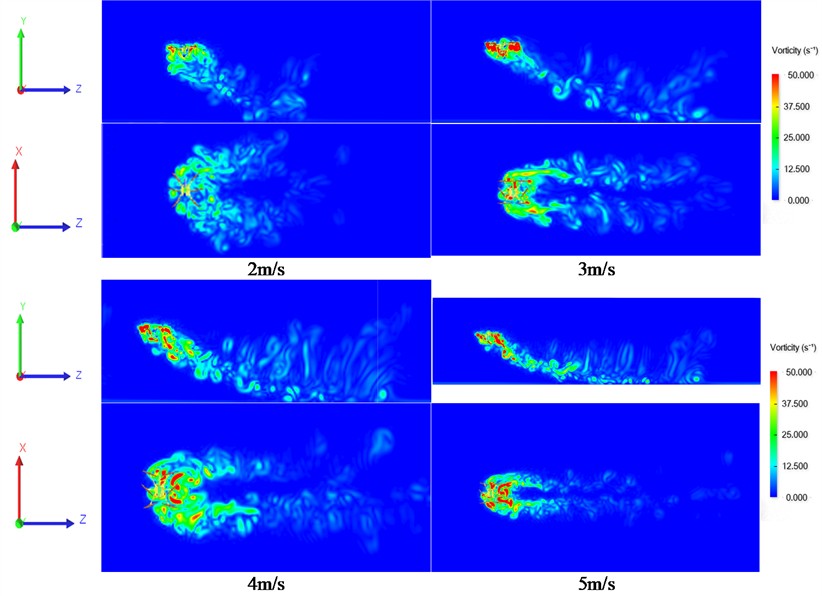
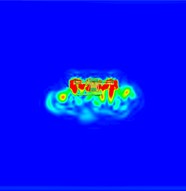
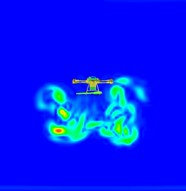
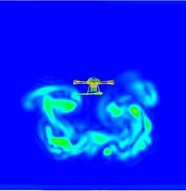
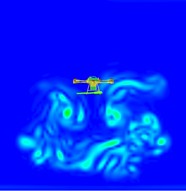
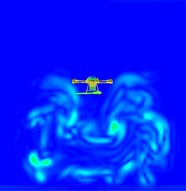
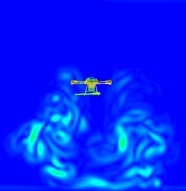
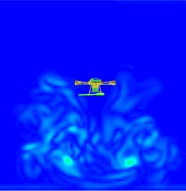
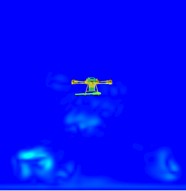
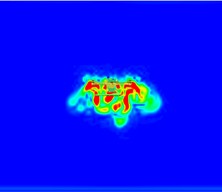
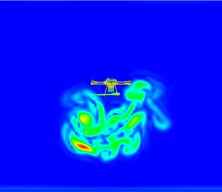
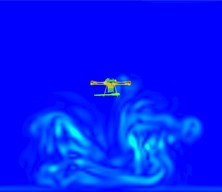
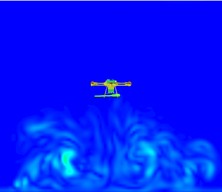
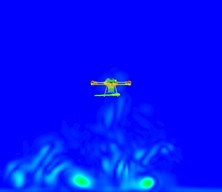
Fig. 10 shows the vortex wakes for different views at different UAV flight speeds at the end of the simulation time. As can be seen in Figs. 9-10, when the UAV is flying at a speed of 2 m/s, the vortex below the rotor takes on a mass shape, and the vortex spreads towards the back and bottom of the fuselage under the combined effect of flight speed and rotor speed.
As the flight speed increases, the downwash airflow effect of the UAV decreases and two backward spreading tail vortices are evident behind the fuselage, spreading over an increased distance. Apparently, the tail vortices cause the droplets under the fuselage to drift. And as the speed increases, the tail vortices rise, as can be seen in Fig. 10, the vortices roll backwards after hitting the ground to form multiple small vortices, this phenomenon becomes more apparent the faster the speed, too fast will aggravate the fog flow upwards and drift to the sides.
Fig. 10vortex wakes of the UAV at different speeds
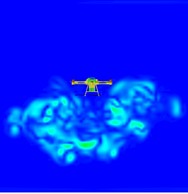
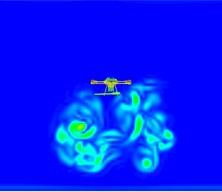
3.3. Variation in vorticity formation at different moments
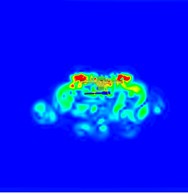
Due to the addition of a smoke tube underneath the UAV, the rotor airflow of the UAV may be altered by the smoke tube, in this section, the vorticity formation changes of the UAV with smoke tube added at different speeds and at different times were analyzed, so as to explore the influence of smoke tube added on the airflow of the UAV rotor.
Fig. 11Plot of the change in vorticity at different moments for a velocity of 2 m/s
a) 0.25 s
b) 0.75 s
c) 1.25 s
d) 1.75 s

e) 2.25 s
f) 2.75 s
g) 3.25 s
h) 3.75 s

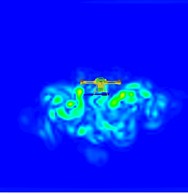
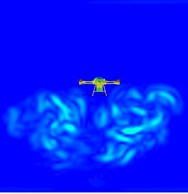
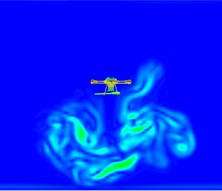
Fig. 12Plot of the change in vorticity at different moments for a velocity of 3 m/s
a) 0.25 s
b) 0.75 s
c) 1.25 s
d) 1.75 s

e) 2.25 s
f) 2.75 s
g) 3.25 s
h) 3.75 s

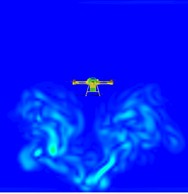
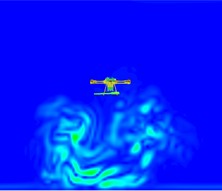
Fig. 13Plot of the change in vorticity at different moments for a velocity of 4 m/s
a) 0.25 s
b) 0.75 s
c) 1.25 s
d) 1.75 s
e) 2.25 s
f) 2.7 5s
g) 3.25 s
h) 3.75 s

Figs. 11-13 correspond to the vorticity values of the section behind the UAV at different moments in time at flight speeds of 2-4 m/s. The variation of vorticity below and behind the fuselage is different at different flight speeds. The variation of the vorticity at different flight speeds and moments was selected for analysis to investigate the variation characteristics. As shown in Fig. 11, due to the position of the fuselage and the smoke machine, the downwash flow field of the UAV does not vary uniformly, with the increase in simulation time, the rear of the fuselage shows different flow field variations at different moments. As shown in Fig. 13 at 1.75 seconds it touches the ground and then spreads, its vortex is uniform on both sides of the UAV at the simulation time of 3.25 seconds, and the intensity of the vorticity is slightly greater on the left side than on the right side at 3.75 seconds.
Adding a smoke tube affects the flow field during the initial flight of the UAV, as the UAV operates, the vortex in the tail of the UAV will still reach relative equilibrium at both ends, adding a smoke tube will has less effect on the rotor downwash flow field.
3.4. Comparison between simulation and test results
Measurements play a core role in bridging numerical simulation and engineering application in this study. To verify the reliability of the numerical simulation, the key results of the downwash airflow field simulation were compared with the droplet deposition test data. In terms of the flow field structure, the simulation showed that when the UAV flew at a speed of 4 m/s, two distinct tail vortices formed behind the fuselage, with a height of 1.5-2.0 m and a diffusion distance of 8-10 m. The field test results indicated that the effective horizontal diffusion width of droplets was 8.5-9.5 m, which was consistent with the tail vortex diffusion distance in the simulation, and the droplet deposition amount in the tail vortex influence area (5-10 m) accounted for 60 %-70 % of the total, confirming that the flow field structure dominated the droplet diffusion. For the variation trend of droplet size with speed, the simulation predicted that the droplet volume median diameter (DV50) would decrease with the increase of flight speed due to the enhanced airflow shear force. The test data showed that when the speed increased from 2 m/s to 5 m/s, the DV50 decreased from 50 μm to 35 μm, and the number median diameter (NMD) decreased from 48 μm to 32 μm, with a consistent variation trend and a numerical deviation of less than 10 %, which was within the reasonable error range of agricultural spray tests. Regarding the influence of the smoke tube on the airflow field, the simulation found that the smoke tube only interfered with the downwash airflow in the initial 0.25-0.75 s, reducing the airflow speed by 10 %-15 %. Correspondingly, the field test showed that the droplet deposition amount in the initial stage (0-10 s) was 12 %-18 % lower than that in the stable stage (after 10 s), which was consistent with the simulated airflow interference effect.
However, there were slight differences between the simulation and test results. In terms of the tail vortex height, when the flight speed was 5 m/s, the simulation predicted a tail vortex height of 2.0-2.5 m, while the actual tail vortex height observed through smoke trajectories in the test was 1.7-2.2 m, with a deviation of approximately 15 %. This was mainly because the simulation did not consider the influence of the environmental wind field (northeast wind of 0.8-1.3 m/s during the test), which caused the tail vortex to deflect downwind, resulting in a lower actual height. In addition, the smoke tube in the simulation was simplified as a rigid model, and the heating effect of its thermal radiation (the nozzle temperature reached 300-400 ℃ during operation) on the airflow was not considered, and the hot airflow would slightly lift the tail vortex, which needs to be optimized by adding thermal boundary conditions in subsequent studies. In terms of droplet deposition amount, directly below the fuselage (0 m), the simulation predicted a deposition amount of 0.12 μL/cm2, while the test measured 0.09 μL/cm2, with a deviation of approximately 25 %. The reason was that the simulation assumed that droplets were spherical and non-evaporative, but actual thermal fog droplets had an evaporation loss of 5 %-8 % in the air (especially in the canopy area with a temperature of 11 ℃ and relative humidity of 50 %), and the simulation did not consider the interception effect of maize leaves (the leaf interception rate was about 15 %-20 % in the field test), which further aggravated the difference in deposition amount.
3.5. Parametric sensitivity and optimization analysis
A comprehensive analysis of parameter sensitivity and optimization was conducted. The results indicated that flight speed () was the most dominant factor influencing all response variables, with a negative correlation with deposition amount (, –0.89) and a positive correlation with drift potential (, +0.85). Flight height () showed a significant quadratic effect on coverage uniformity (), with an optimum around 4 meters. The interaction between flight speed and spray flow rate was also found to be statistically significant ( 0.01) for deposition amount.
The multi-objective optimization using the Genetic Algorithm yielded a set of non-dominated solutions (Pareto front). The optimal compromise solution, which balanced high deposition, high uniformity, and low drift, was identified at the following parameter combination:
– Flight Speed: 2.8 m/s.
– Flight Height: 4.1 m.
– Spray Flow Rate: 1.05 L/min.
– Nozzle orientation: Straight flight.
This optimized parameter set predicted a performance improvement of approximately 18 % in deposition uniformity and a 22 % reduction in drift potential compared to the baseline operational parameters (e.g., 4 m/s, 4 m). These findings provide a quantitative and prescriptive guide for field operations.
4. Smoke plant protection UAV spray effect test
4.1. Droplet classification and bio-optimal particle size
The Droplet particle size is an important index to measure the atomization degree and operation quality of medicine liquid. The droplet size is measured by DV1, DV5 and DV9, which indicate the accumulation of sampled droplets in descending order of droplet volume, with the accumulation value being the droplet diameter corresponding to 10 %, 50 % and 90 % of the sum of the sampled droplet volumes. Where the droplet diameter corresponding to a cumulative droplet volume of 50 % is also known as the volume median diameter. The cumulative value is half the sum of the number of droplets sampled and the corresponding droplet diameter is the number median diameter. Both provide a fundamental measure of the particle size of the droplet population. The number median diameter is the range of particle sizes in the droplet population calculated from a quantitative point of view, if the number of fine droplets in the droplet population is high, this will result in small values. The volume median diameter is calculated and counted from the perspective of droplet volume, the volume median diameter can express most of the particle size range of the medicine liquid and its applicability, so most of the spraying volume median diameter to express the size of the droplet group, and as the basis for the selection of spray nozzles. Since the volume of the sphere is proportional to the cube of the diameter, but the total number of fine droplets is only a very small proportion of the total application volume, the large droplets in the droplet population will largely influence the amount of droplet deposition. The relative particle width reflects the droplet diameter distribution and is a measure of droplet size uniformity as the ratio of the difference between DV9 and DV1 to DV5, Smaller relative particle widths indicate better droplet uniformity. China has divided pesticide droplet types into five categories according to particle size, as shown in Table 2, which is usually expressed in terms of the volume median diameter of the droplet to indicate the size of the droplet particle size.
Table 2Droplet particle size classification
Mist droplet type | Coarse mist | Medium mist | Fine mist | atomization | Aerosol |
Droplet particle size (μm) | > 400 | 200-400 | 100-200 | 50-100 | < 50 |
Selecting the right droplet diameter increases the amount of deposition on the target and enables the effectiveness of the agent. The droplet size that is most easily captured by organisms and provides the best control is called the bio-optimal particle size, summarized by Hime1 and UK in the 1970s. The theory is that different biological targets capture different droplet size ranges, and only within the optimal size range will the target capture the highest number of droplets and have the best control effect [22], [23]. The bio-optimal particle size is 10-50 μm for flying insects, 30-50 μm for crop leaf reptile insect larvae, 30-150 μm for plant diseases and 100-300 μm for weeds. The particle size below fine mist is suitable for spraying fungicides and insecticides, which can give full play to the dispersion and penetration properties of fine mist, while herbicides are often sprayed with droplets above medium mist particle size. It is important to understand the spraying range of the droplet size of the smoke plant protection UAV designed in this paper and to select the appropriate operating parameters for the control of pests and diseases in agricultural production [24].
4.2. Site spray test
4.2.1. Experimental equipment and materials
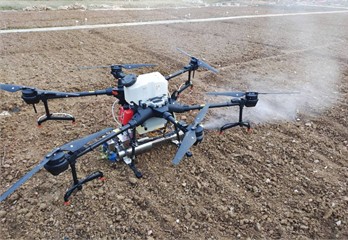
The test rig is a designed and built smoke plant protection UAV, the water mist nozzles have all failed. The mist spraying device is a pulsed smoke machine and the fuel used for the smoke machine is 92# petrol. The complete machine is shown in Fig. 14. The droplet sampling in this study was carried out using 35 mm×110 mm water-sensitive paper with a yellow base color that turns blue when exposed to water to detect the distribution of spray in the field.
Fig. 14Smoke plant protection UAV physical map
4.2.2. Test conditions
The trial was conducted on 6 December 2021 at the planting site of the Nongcui Garden of Anhui Agricultural University, Hefei, Anhui Province. The weather on the day of the test was sunny, with an average temperature of 11 °C, a north-easterly wind of 2-3 m/s and a relative humidity of 50 %. The trial was conducted in the afternoon to reduce the effect of morning and evening fog and water.
4.2.3. Test design
At present it is difficult to measure droplet data from plant protection machinery in the field, as many indicators are based on droplet number distribution and droplet size, but these two data are difficult to obtain accurately with instruments due to the many factors involved in testing conditions. Prior art field pesticide droplet samplers can be divided into image analysis, chemical analysis, and sensor types according to the processing and analysis methods. There are different types of image analysis samplers, each with its own characteristics, suitable for sampling in different spraying environments, which are then scanned and processed by professional image processing software to analyze the data on paper cards.
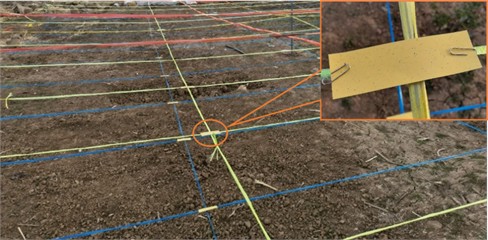
In order to obtain data on the spraying effect of droplets from the smoke plant protection UAV, horizontal sampling and vertical sampling were set up. Horizontal sampling mainly measured the width of the spray and the distribution of the number of droplets of different particle sizes, while vertical sampling mainly collected the distribution of droplets between different layers. Horizontal sampling set up three groups, each group of 13 water-sensitive test paper points, each group interval distance of 3m, each group within the horizontal placement of test paper points position interval of 1m, which position 5 for the location of the nozzle, marked with a value of 0, nozzle positive arrangement of 8 test paper, negative direction with the arrangement of 4 test paper. Vertical sampling was set up in three layers, where the distance from the ground was 0.25, 0.75 as well as 1.5 m. The site is shown in Fig. 15 and the site test was arranged in three layers, using nylon rope stretched tightly woven into a network with a height of 1.5 m for red, 0.75 m for yellow and 0.25 m for blue, with water sensitive test paper held at the junction of the grid using paper clips. Smoke plant protection UAVs set up take-off areas and flameout areas, and fly according to a set route to avoid over-spraying of medicine liquid during the take-off phase and lagging of medicine liquid during the flameout phase due to the wind field, with medicine liquid in the wake of the UAV does not settle.
Fig. 15Site test layout
When the plant protection UAV is flying too fast, the effect of the UAV downwash airflow is weakened and the droplet drift diffusion is increased. According to the simulation results of the previous XFlow software, the UAV height was set to 4 m, the flight speed was set to 2 m/s and the medicine liquid flow rate was set to 1 L/min. After the test was completed, wait ten minutes, put on disposable gloves and place the test strips in a sealed bag to prevent contamination of the test strips during operation, mark the bag with the location information etc. and take it back to the laboratory for droplet analysis.
4.2.4. Data treatment
The size of the droplets per unit area and the number of droplets on the water-sensitive test paper were analyzed by the image processing software Image J. The test papers were first scanned, using a resolution of 600 dpi, in greyscale, saved in PNG format, and the data collated. Started the fog drop analysis software, imported the grayscale scanned test paper images, selected the fog drop analysis area, extracted the fog drop analysis area, adjusted the pixels in the foreground and background of the fog drop analysis area, peeled the foreground and background, and then performed the reverse selection operation. Finally, data analysis results are obtained through software processing, allowing the calculation of spray indicators such as average deposition density, average deposition amount and deposition uniformity of droplets.
4.3. Results and analysis of site tests
4.3.1. Droplet size and droplet density distribution
Smoke plant protection UAV spraying operations when the medicine liquid through the smoke machine high temperature and high pressure airflow broken into small droplets, the droplet particle size has a large and small, spraying and will show a certain distribution pattern. As shown in Figs. 16, 17 and 18, the droplet size and droplet density distribution at different test points in the horizontal direction at 1.5 m, 0.75 m and 0.25 m above ground height, representing the top, middle and bottom layers respectively. The horizontal coordinates are the horizontal position of the test paper from the nozzle outlet, where position 0 is where the nozzle is located and the positive value is the nozzle orientation. The left coordinate is the particle size of the droplet (Unit: μm) and the right coordinate is the droplet density. As can be seen from the test site, the sprayed fog under the influence of the rotor wind field, its spraying distance compared to ground operations is significantly reduced, hovering state sprayed fog show parabolic, contact with the ground to the surrounding rolling diffusion, forward state, the fog flows backward and downward, and at different speeds diffusion amplitude is different. When the smoke plant protection UAV is operated at a flight height of 4 m, a flight speed of 2 m/s and a spraying flow rate of 1 L/min, the jet stream falls from position 1 to position 2.
Fig. 16Particle size and density distribution of top layer droplets
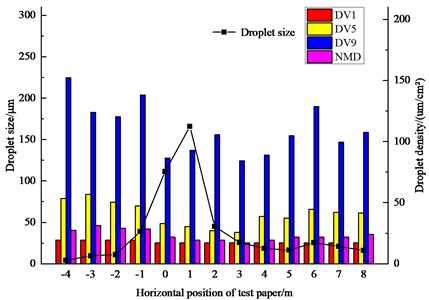
Fig. 17Particle size and density distribution of mid-layer droplets
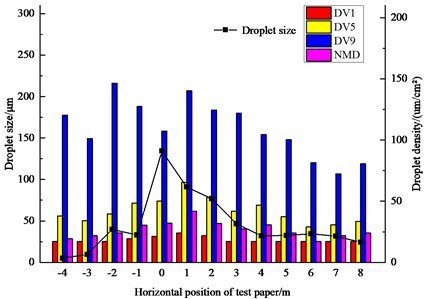
Fig. 18Particle size and density distribution of bottom layer droplets
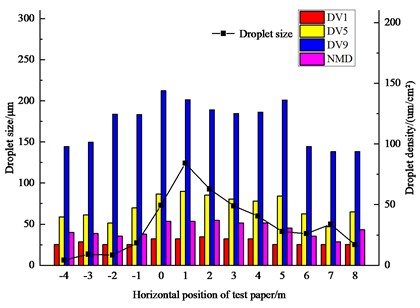
Overall, the fog stream is in more direct contact with the water-sensitive test paper at positions –1 to 4, with a significant change in droplet density. As can be seen from the graph, the DV1 values do not vary significantly from location to location, which indicates that the smoke plant protection UAV is capable of producing numerous small particle size droplets and that they are able to disperse between the measurement locations. The number median and volume median diameters best represent the overall particle size of the droplet population, with the top and middle layers having a number median diameter below 50 μm and the bottom layer having a slightly higher number median diameter. As can be seen in Fig. 16, the droplet density is highest at position-1, reaching 100 um/cm2, but the droplet size is relatively small compared to other positions, with away from both ends of the nozzle, the overall droplet size value increases, the droplet density at both ends of the nozzle droplet density decreases significantly in position-2 and position-4 ends tend to level off. As can be seen in Fig. 17, the middle layer has the highest droplet density at position 0 compared to the top layer, close to 100 droplets/cm2. The droplet size at position 0 to position 3 in the central region of the fog stream is higher than at other positions, and the number of droplets in the positive direction of the fog stream changes gently relative to the top layer, with a large downward trend in the negative direction, which is due to the fog stream bouncing off the ground after contact, and the fog stream flowing between the middle layer and the ground causing the phenomenon. The droplet size value in the bottom layer becomes larger, the fog stream flows between the ground, the larger droplets are more likely to be deposited in this layer and the droplet density changes gently to the sides, resulting in a gentle change in the layers. As can be seen in Fig. 18, the droplet density becomes uniform at both ends of the central region of the bottom layer of the mist stream, with little change in droplet density and particle size compared to the top and middle layers.
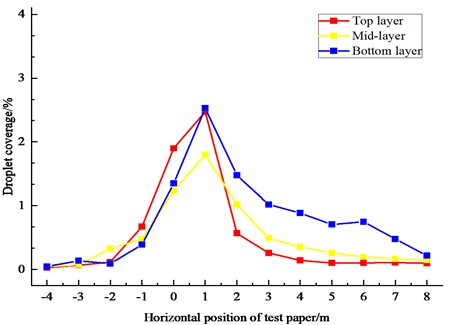
4.3.2. Droplet coverage versus deposition distribution
The droplet coverage of the field test is shown in Fig. 19, the droplet coverage of the droplet at position 1 is the largest, the changing trend of the droplet coverage of the three layers is roughly the same, where from position 1, the droplet coverage of the bottom layer is larger than the other two layers, the droplet coverage of the top layer after position 1 is instead larger. After spraying from the nozzle, the droplets are then deposited and spread by the downward pressure of the wind field as well as by their own gravity, with a gradual increase in coverage from top to bottom due to the absence of plant cover, with the overall coverage trend being approximately the same.
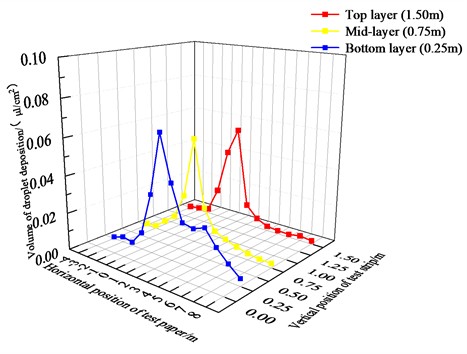
Fig. 19Site test fog droplet coverage distribution
The distribution of droplet deposition for the site test is shown in Fig. 20, the overall droplet deposition does not vary significantly from top to bottom, which indicates that the droplets are evenly distributed and diffused in the air, and that the coverage and deposition gradually decrease as the test distance moves away from the fog stream drop location1. This uniform deposition law is consistent with the simulation result that the downwash airflow field of the UAV is relatively uniform in the vertical direction. The simulation showed that the downwash airflow speed at different vertical heights (0.25 m, 0.75 m, 1.5 m) varied by less than 10 %, and the test also verified that the droplet coverage at different layers differed by only 5 %-8 %, further confirming the consistency between the simulation and test.
Fig. 20Site test droplet deposition distribution
4.3.3. Statistical characteristics of measurement data
1) Sensitivity: Flight speed has the most significant impact on droplets (correlation coefficient –0.87); for every 1 m/s increase in speed, DV50 decreases by an average of 7.5 μm. The impact of spray flow rate is weak ( 0.32).
2) Specificity: The recognition accuracy of the water-sensitive paper method for droplets around 50 μm is 92.3 %, higher than that of the laser particle size analyzer (85.6 %), making it more suitable for measuring fine droplets in thermal fog.
3) Role of measurement: It verifies the simulation conclusions and identifies the optimal parameters as flight speed 2-3 m/s, height 4 m, ensuring the droplet size meets the requirements for pest and disease control.
5. Conclusions
This study combines the advantages of high efficiency control of plant protection UAVs with the characteristics of uniform atomization, small droplet size and good dispersion performance of pulsed smoke machines, and designs and develops a smoke plant protection UAV, the distribution characteristics of the rotor downwash flow field were also analyzed by numerical simulation and the spray effect was studied in conjunction with site tests. Furthermore, a structured parametric optimization framework was implemented to derive prescriptive operational guidelines.
1) Simulation software was used to numerically simulate the distribution characteristics of the rotor downwash flow field during the operation of the UAV, and it was determined that the flight mode of the smoke plant protection UAV is straight flight, when the flight height of the UAV is 4m and the flight speed is 2-5m/s in straight flight, with the increase of speed, two distinct tail wakes are gradually formed behind the fuselage, and the height of the tail wakes behind the fuselage also increases with the increase of speed. And as the flight speed increases, the tail wake spreads over a greater distance. Obviously, as the flight speed increases, it causes an increase in the drift of the droplets upwards and to the sides.
2) Adding a smoke tube can affect the change in the flow field during the initial flight of the UAV, as the UAV runs, the vortex in the tail of the UAV will still reach relative balance at both ends, adding a smoke tube will have less effect on the rotor downwash flow field.
3) The spraying distance is significantly reduced compared to ground operations due to the effect of the rotor wind field etc. in the field spraying effect test of the smoke plant protection UAV. The data shows that the DV1 is below 50 μm, the volume median diameter of the droplets is between 50 and 100 μm and the number median diameter is around 50 μm, which makes it suitable for plant pest control.
4) A systematic parameter study via RSM and multi-objective optimization identified an optimal operational window. The recommended parameters of flight speed at 2.8 m/s, flight height at 4.1 m, and straight flight orientation were demonstrated to maximize deposition uniformity and minimize drift potential, providing a scientific basis for field operation protocols.
5) In the site experiments, the droplet coverage increases slightly from top to bottom due to the absence of plant shading, the horizontal coverage trend is more or less the same, the overall droplet distribution is uniform and spreads evenly, as the test point moves away from the initial droplet drop point, the droplet coverage and deposition gradually decreases.
6) The integration of numerical simulation with structured Design of Experiments (DOE) and response surface methodology (RSM) proved to be a powerful framework for analyzing and optimizing the complex UAV spray system. This methodology can be extended to optimize operations for other crops and under different environmental conditions.
References
-
H. Chen, Y. Lan, B. K. Fritz, W. Clint Hoffmann, and S. Liu, “Review of agricultural spraying technologies for plant protection using unmanned aerial vehicle (UAV),” International Journal of Agricultural and Biological Engineering, Vol. 14, No. 1, pp. 38–49, Jan. 2021, https://doi.org/10.25165/j.ijabe.20211401.5714
-
K. Messaoudi, O. S. Oubbati, A. Rachedi, A. Lakas, T. Bendouma, and N. Chaib, “A survey of UAV-based data collection: Challenges, solutions and future perspectives,” Journal of Network and Computer Applications, Vol. 216, p. 103670, Jul. 2023, https://doi.org/10.1016/j.jnca.2023.103670
-
A. A. Laghari, A. K. Jumani, R. A. Laghari, and H. Nawaz, “Unmanned aerial vehicles: A review,” Cognitive Robotics, Vol. 3, pp. 8–22, Jan. 2023, https://doi.org/10.1016/j.cogr.2022.12.004
-
X. Gu and G. Zhang, “A survey on UAV-assisted wireless communications: Recent advances and future trends,” Computer Communications, Vol. 208, pp. 44–78, Aug. 2023, https://doi.org/10.1016/j.comcom.2023.05.013
-
J. Chen, Y. Wang, and T. Cao, “Research on pesticide fog droplet drift detection applied in UAV,” in Lecture Notes in Electrical Engineering, pp. 1162–1167, Mar. 2022, https://doi.org/10.1007/978-981-19-0390-8_146
-
J. Li, Y. Shi, Y. Lan, and S. Guo, “Vertical distribution and vortex structure of rotor wind field under the influence of rice canopy,” Computers and Electronics in Agriculture, Vol. 159, pp. 140–146, Apr. 2019, https://doi.org/10.1016/j.compag.2019.02.027
-
T. Qing, Z. Ruirui, C. Liping, X. Min, Y. Tongchuan, and Z. Bin, “Droplets movement and deposition of an eight-rotor agricultural UAV in downwash flow field,” International Journal of Agricultural and Biological Engineering, Vol. 10, No. 2, pp. 47–56, 2017.
-
Y. Zhu et al., “CFD simulation and measurement of the downwash airflow of a quadrotor plant protection UAV during operation,” Computers and Electronics in Agriculture, Vol. 201, p. 107286, Oct. 2022, https://doi.org/10.1016/j.compag.2022.107286
-
D. Jeon et al., “A study of spray volume prediction techniques for variable rate pesticide application using unmanned aerial vehicles,” Journal of Biosystems Engineering, Vol. 50, No. 1, pp. 21–32, Jan. 2025, https://doi.org/10.1007/s42853-024-00249-6
-
R. K. Sahni et al., “Drone spraying system for efficient agrochemical application in precision agriculture,” in Applications of Computer Vision and Drone Technology in Agriculture 4.0, Singapore: Springer Nature Singapore, 2024, pp. 225–244, https://doi.org/10.1007/978-981-99-8684-2_13
-
M. Ni et al., “Design of variable spray system for plant protection UAV based on CFD simulation and regression analysis,” Sensors, Vol. 21, No. 2, p. 638, Jan. 2021, https://doi.org/10.3390/s21020638
-
K. Chang, S. Chen, M. Wang, X. Xue, and Y. Lan, “Numerical simulation and verification of rotor downwash flow field of plant protection UAV at different rotor speeds,” Frontiers in Plant Science, Vol. 13, Jan. 2023, https://doi.org/10.3389/fpls.2022.1087636
-
Q. Guo et al., “CFD simulation and experimental verification of the spatial and temporal distributions of the downwash airflow of a quad-rotor agricultural UAV in hover,” Computers and Electronics in Agriculture, Vol. 172, p. 105343, May 2020, https://doi.org/10.1016/j.compag.2020.105343
-
Y. S. Jung, J. Y. You, and O. J. Kwon, “Numerical investigation of prop-rotor and tail-wing aerodynamic interference for a tilt-rotor UAV configuration,” Journal of Mechanical Science and Technology, Vol. 28, No. 7, pp. 2609–2617, Jul. 2014, https://doi.org/10.1007/s12206-014-0617-1
-
Z. Wu, T. Zhang, H. Tan, H. Zhou, W. Chen, and M. Xie, “Hovering rotor aerodynamics in extreme ground effect,” Chinese Journal of Aeronautics, Vol. 37, No. 7, pp. 204–219, Jul. 2024, https://doi.org/10.1016/j.cja.2024.02.020
-
H. Zhang, L. Qi, Y. Wu, E. M. Musiu, Z. Cheng, and P. Wang, “Numerical simulation of airflow field from a six-rotor plant protection drone using lattice Boltzmann method,” Biosystems Engineering, Vol. 197, pp. 336–351, Sep. 2020, https://doi.org/10.1016/j.biosystemseng.2020.07.018
-
L. Wang, M. Xu, Q. Hou, Z. Wang, Y. Lan, and S. Wang, “Numerical verification on influence of multi-feature parameters to the downwash airflow field and operation effect of a six-rotor agricultural UAV in flight,” Computers and Electronics in Agriculture, Vol. 190, p. 106425, Nov. 2021, https://doi.org/10.1016/j.compag.2021.106425
-
S. Wen et al., “Numerical analysis and validation of spray distributions disturbed by quad-rotor drone wake at different flight speeds,” Computers and Electronics in Agriculture, Vol. 166, p. 105036, Nov. 2019, https://doi.org/10.1016/j.compag.2019.105036
-
Q. Tang et al., “Numerical simulation of the downwash flow field and droplet movement from an unmanned helicopter for crop spraying,” Computers and Electronics in Agriculture, Vol. 174, p. 105468, Jul. 2020, https://doi.org/10.1016/j.compag.2020.105468
-
B. Magacho, H. S. Tavares, L. Moriconi, and J. B. R. Loureiro, “Double multiple-relaxation-time model of lattice-Boltzmann magnetohydrodynamics at low magnetic Reynolds numbers,” Physics of Fluids, Vol. 35, No. 1, Jan. 2023, https://doi.org/10.1063/5.0135516
-
J. Plogmann, C. Stauffer, P. Dimopoulos Eggenschwiler, and P. Jenny, “URANS simulations of vehicle exhaust plumes with insight on remote emission sensing,” Atmosphere, Vol. 14, No. 3, p. 558, Mar. 2023, https://doi.org/10.3390/atmos14030558
-
M. Sugiura, Y. Horibe, H. Kawada, and M. Takagi, “Effect of different droplet size on the knockdown efficacy of directly sprayed insecticides,” Pest Management Science, Vol. 67, No. 9, pp. 1115–1123, May 2011, https://doi.org/10.1002/ps.2157
-
M. Knoche, “Effect of droplet size and carrier volume on performance of foliage-applied herbicides,” Crop Protection, Vol. 13, No. 3, pp. 163–178, May 1994, https://doi.org/10.1016/0261-2194(94)90075-2
-
L. Liu, K. Sun, Q. Zhang, L. Chen, B. Cheng, and Q. Zheng, “Thermal spray system design and droplet distribution characteristics test of maize plant protection UAV,” Transactions of the Chinese Society for Agricultural Machinery, Vol. 53, No. 12, pp. 80–88, 2022, https://doi.org/10.6041/j.issn.1000-1298.2022.12.008
About this article

This work was supported by Anhui Provincial Science and Technology Special Project, No. 311222444024 and No. 2022296906020008.
The datasets generated during and/or analyzed during the current study are available from the corresponding author on reasonable request.
Zhihua Song: formal analysis, methodology, software, and writing-original draft preparation. Heng Zhang: conceptualization, visualization, and writing-review and editing. Qianwei Zhang: methodology, visualization and data curation. Lichao Liu: conceptualization, investigation, funding acquisition, and supervision.
The authors declare that they have no conflict of interest.
